

NMDARs antagonist MK801 suppresses LPS-induced apoptosis and mitochondrial dysfunction by regulating subunits of NMDARs via the CaM/CaMKII/ERK pathway
- PMID: 36774369
- PMCID: PMC9922289
- DOI: 10.1038/s41420-023-01362-9
NMDARs antagonist MK801 suppresses LPS-induced apoptosis and mitochondrial dysfunction by regulating subunits of NMDARs via the CaM/CaMKII/ERK pathway
Abstract
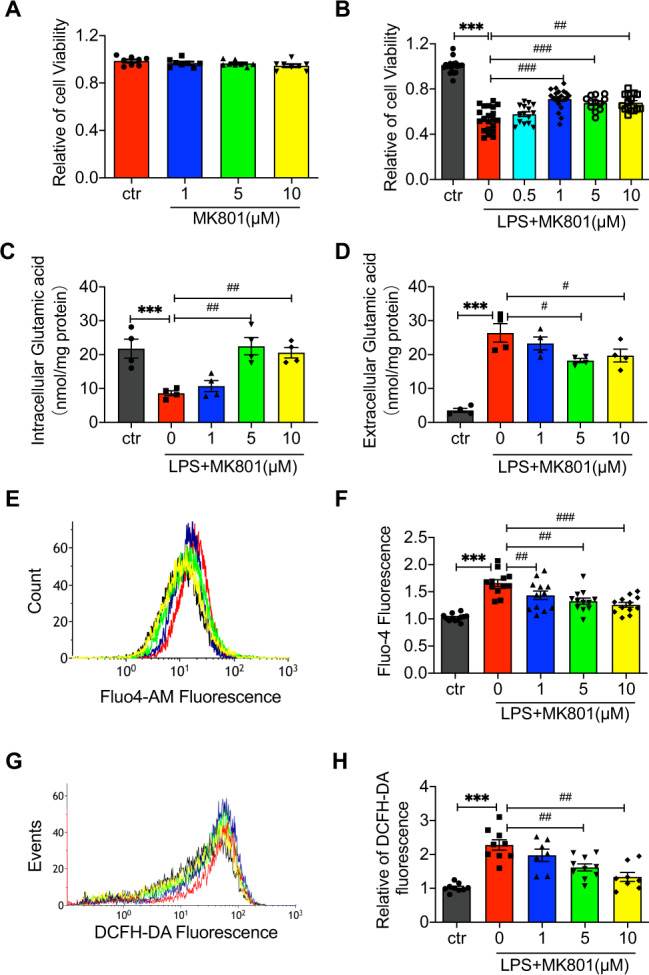
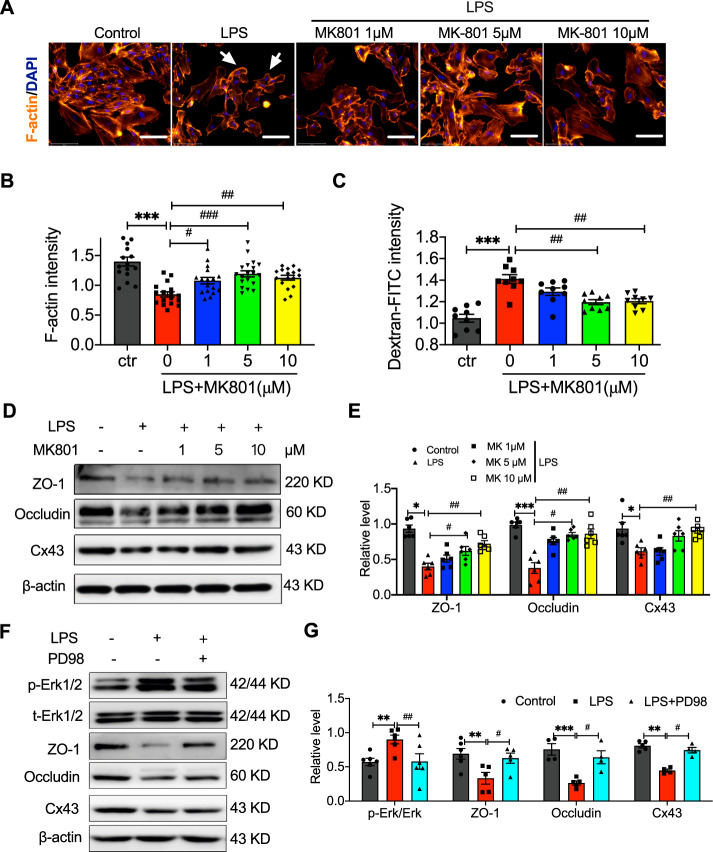
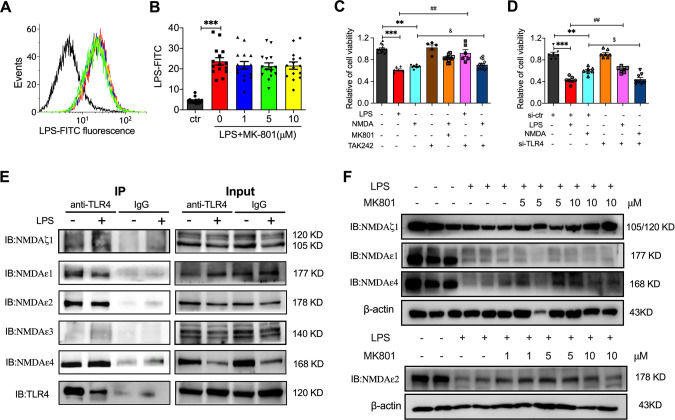
Lipopolysaccharide (LPS) displays a robust immunostimulatory ability upon Toll-like receptor 4 (TLR4) recognition. N-methyl-D-aspartate receptors (NMDARs) are highly compartmentalized in most cells and implicated in various inflammatory disorders. However, the relationship between TLR4 and NMDARs has not been explored deeply. This study aimed to examine the role of NMDARs and its specific inhibitor MK801 in LPS-treated endothelial cell dysfunction and the related mechanism in vivo and in vitro. The results showed that pre-treatment with MK801 significantly decreased LPS-induced cell death, cellular Ca2+, cellular reactive oxygen species, and glutamate efflux. Moreover, MK801 restrained LPS-induced mitochondrial dysfunction by regulating mitochondrial membrane potential and mitochondrial Ca2+ uptake. The oxygen consumption, basal and maximal respiration rate, and ATP production in LPS-treated HUVECs were reversed by MK801 via regulating ATP synthesis-related protein SDHB2, MTCO1, and ATP5A. The molecular pathway involved in MK801-regulated LPS injury was mediated by phosphorylation of CaMKII and ERK and the expression of MCU, MCUR1, and TLR4. LPS-decreased permeability in HUVECs was improved by MK801 via the Erk/ZO-1/occluding/Cx43 axis. Co-immunoprecipitation assay and western blotting showed three subtypes of NMDARs, NMDAζ1, NMDAε2, and NMDAε4 were bound explicitly to TLR4, suppressed by LPS, and promoted by MK801. Deficiency of NMDAζ1, NMDAε2, or NMDAε4 induced cell apoptosis, Ca2+ uptake, ROS production, and decreased basal and maximal respiration rate, and ATP production, suggesting that NMDARs integrity is vital for cell and mitochondrial function. In vivo investigation showed MK801 improved impairment of vascular permeability, especially in the lung and mesentery in LPS-injured mice. Our study displayed a novel mechanism and utilization of MK801 in LPS-induced ECs injury and permeability.
© 2023. The Author(s).
Conflict of interest statement
The authors declare no competing interests.
Figures


Similar articles
-
NMDA receptor inhibitor MK801 alleviated pro-inflammatory polarization of BV-2 microglia cells.Eur J Pharmacol. 2023 Sep 15;955:175927. doi: 10.1016/j.ejphar.2023.175927. Epub 2023 Jul 20. Eur J Pharmacol. 2023. PMID: 37479018
-
Endothelial immune activation programmes cell-fate decisions and angiogenesis by inducing angiogenesis regulator DLL4 through TLR4-ERK-FOXC2 signalling.J Physiol. 2018 Apr 15;596(8):1397-1417. doi: 10.1113/JP275453. Epub 2018 Mar 2. J Physiol. 2018. PMID: 29380370 Free PMC article.
-
NMDARs activation regulates endothelial ferroptosis via the PP2A-AMPK-HMGB1 axis.Cell Death Discov. 2024 Jan 17;10(1):34. doi: 10.1038/s41420-023-01794-3. Cell Death Discov. 2024. PMID: 38233385 Free PMC article.
-
Role of nonsynaptic GluN2B-containing NMDA receptors in excitotoxicity: evidence that fluoxetine selectively inhibits these receptors and may have neuroprotective effects.Brain Res Bull. 2013 Apr;93:32-8. doi: 10.1016/j.brainresbull.2012.10.005. Epub 2012 Oct 23. Brain Res Bull. 2013. PMID: 23089362 Review.
-
Glutamate excitotoxicity and Ca2+-regulation of respiration: Role of the Ca2+ activated mitochondrial transporters (CaMCs).Biochim Biophys Acta. 2016 Aug;1857(8):1158-1166. doi: 10.1016/j.bbabio.2016.04.003. Epub 2016 Apr 7. Biochim Biophys Acta. 2016. PMID: 27060251 Review.
Cited by
-
Mesenchymal stem cells: a novel therapeutic approach for feline inflammatory bowel disease.Stem Cell Res Ther. 2024 Nov 9;15(1):409. doi: 10.1186/s13287-024-04038-y. Stem Cell Res Ther. 2024. PMID: 39522034 Free PMC article.
-
Dose-Dependent Modulation of NMDA Receptors: Neuroprotective Mechanisms against Oxidative Stress in Hippocampal Neurons.Int J Mol Cell Med. 2025 Jul 1;14(2):682-693. doi: 10.22088/IJMCM.BUMS.14.2.682. eCollection 2025. Int J Mol Cell Med. 2025. PMID: 40765754 Free PMC article.
-
Consumption of Endogenous Caspase-3 Activates Molecular Theranostic Nanoplatform against Inflammation-Induced Profibrotic Positive Feedback in Pulmonary Fibrosis.Adv Sci (Weinh). 2025 Feb;12(6):e2412303. doi: 10.1002/advs.202412303. Epub 2024 Dec 17. Adv Sci (Weinh). 2025. PMID: 39686776 Free PMC article.
-
TNF-α and RPLP0 drive the apoptosis of endothelial cells and increase susceptibility to high-altitude pulmonary edema.Apoptosis. 2024 Oct;29(9-10):1600-1618. doi: 10.1007/s10495-024-02005-9. Epub 2024 Aug 7. Apoptosis. 2024. PMID: 39110356 Free PMC article.
-
Poria cocos Ethanol Extract Restores MK-801-Induced Cytoskeleton Regulation in Neuro2A and IMR-32 Cells and Locomotor Hyperactivity in C57BL/6 Mice by Modulating the Rho Signaling Pathway.Curr Issues Mol Biol. 2025 Apr 28;47(5):312. doi: 10.3390/cimb47050312. Curr Issues Mol Biol. 2025. PMID: 40699710 Free PMC article.
References
Grants and funding
- 82270417/National Natural Science Foundation of China (National Science Foundation of China)
- U1605226/National Natural Science Foundation of China (National Science Foundation of China)
- 3502Z20184025/Xiamen Municipal Bureau of Science and Technology (Xiamen Science and Technology Bureau)
- 2021QNB022/Natural Science Foundation of Fujian Province (Fujian Provincial Natural Science Foundation)
LinkOut - more resources
Full Text Sources
Miscellaneous
