. 2023 Feb 11;14(1):772.
doi: 10.1038/s41467-023-36402-6.

Mechanistic insights into RNA surveillance by the canonical poly(A) polymerase Pla1 of the MTREC complex

Affiliations

Mechanistic insights into RNA surveillance by the canonical poly(A) polymerase Pla1 of the MTREC complex

Komal Soni et al. Nat Commun. .

Abstract

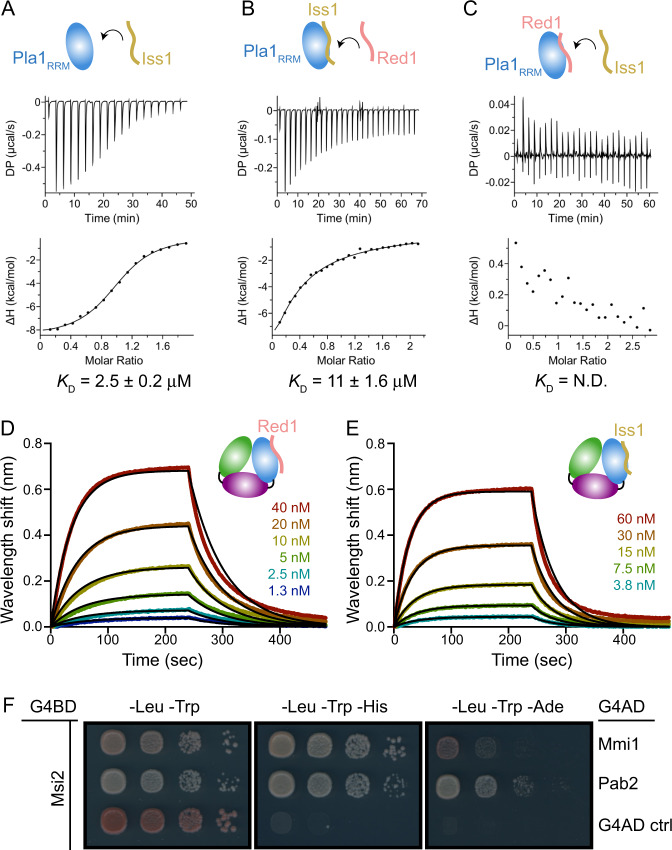
The S. pombe orthologue of the human PAXT connection, Mtl1-Red1 Core (MTREC), is an eleven-subunit complex that targets cryptic unstable transcripts (CUTs) to the nuclear RNA exosome for degradation. It encompasses the canonical poly(A) polymerase Pla1, responsible for polyadenylation of nascent RNA transcripts as part of the cleavage and polyadenylation factor (CPF/CPSF). In this study we identify and characterise the interaction between Pla1 and the MTREC complex core component Red1 and analyse the functional relevance of this interaction in vivo. Our crystal structure of the Pla1-Red1 complex shows that a 58-residue fragment in Red1 binds to the RNA recognition motif domain of Pla1 and tethers it to the MTREC complex. Structure-based Pla1-Red1 interaction mutations show that Pla1, as part of MTREC complex, hyper-adenylates CUTs for their efficient degradation. Interestingly, the Red1-Pla1 interaction is also required for the efficient assembly of the fission yeast facultative heterochromatic islands. Together, our data suggest a complex interplay between the RNA surveillance and 3'-end processing machineries.


Conflict of interest statement

The authors declare no competing interests.

Figures

Fig. 1
Fig. 1. Interaction mapping between Pla1 and Red1.
A Domain organisation of Pla1, consisting of the NTD, MD and RRM domains shown in green, purple and blue, respectively. B Y2H experiments show that the Pla1 RRM domain is responsible for the interaction with Red1. Full-length (FL) Pla1, Pla1NTD-MD or Pla1RRM constructs were fused to the Gal4 DNA binding domain (G4BD) while full-length Red1 was fused to the Gal4 activation domain (G4AD). Auto-activation controls (ctrl) for FL-Pla1 Pla1NTD-MD and Pla1RRM are provided. Serial dilutions of equivalent amounts of yeast were plated on double (-Leu-Trp) and triple dropout media (-Leu-Trp-His, -Leu-Trp-Ade), with growth on triple dropout media indicating an interaction between the tested proteins. C In vitro pull-down assays. Untagged Pla1RRM was co-expressed with His6-MBP fusion constructs of Red1 or His6-MBP (control). 0.01% of input (lanes 1–5) and 25% of elution fractions (lanes 6–10) were separated on 12% SDS-PAGE gel. Asterisks mark the different His6-MBP fusion constructs. A representative gel from two independent runs is shown. Source data are provided as a Source Data file. D Overlay of 1H, 15N-HSQC NMR spectra of GB1-tagged Red1288-322 in the absence and presence of Pla1RRM are shown in black and salmon, respectively. Zoom-in views of Red1 residues showing chemical shift perturbations or line broadening are shown. E, F ITC experiments with a serial titration of Red1288-322 (E) or Red1288-345 (F) into Pla1RRM. The calculated dissociation constants (KD) from an average of two or three independent measurements are shown.
Fig. 2
Fig. 2. Crystal structures of Pla1 in its apo form and in complex with Red1.
A The overall architecture of Pla1 in its apo form is shown. Colour scheme for Pla1 domains are the same as Fig. 1A. The N- and C-termini of the protein and loops L1 (shown in grey) and L2 of RRM domain are marked. The Pla1 N-terminal α1, which forms a part of the MD, is boxed in purple. The secondary structure elements of the RRM domain comprising helices α12-α16 and β-strands β6-β11 are marked. B Crystal structure of Pla1-Red1 complex. Red1 and Pla1RRM are shown in salmon and blue, respectively, while the NTD and MD are coloured in grey. The Red1 N- and C-termini, its secondary structure elements α0 and β0, along with the Pla1RRM domain loops L1 and L2 are marked. The two Red1 interaction interfaces are boxed. C, D Zoom-in views of residues involved in the Pla1-Red1 interaction. Polar contacts are shown by red dotted lines. The β-zipper formed between Red1 β0 and Pla1 residues Arg491-Asp493 is boxed in black.
Fig. 3
Fig. 3. Mutational analyses of Pla1-Red1 interaction.
Isothermal titration calorimetry experiments with specific Pla1 and Red1 point mutants that affect their interaction interface are shown in panels AF. The calculated dissociation constant (KD) from an average of two independent measurements is shown. G In vitro polyadenylation assay. Polyadenylation of a 5′-Cy3 labelled A15 RNA primer by Pla1 alone (left panel), in the presence of Red1288-345 (middle panel) and Red1W298A/F305A (right panel), analysed by 14% denaturing urea PAGE at different time points. Densitometric analyses of the gels are plotted below, where the RNA length is marked based on an RNA ladder. Representative gels from two independent experiments are shown. Source data are provided as a Source Data file.
Fig. 4
Fig. 4. Disrupting Red1-Pla1 interaction in vivo leads to ‘Pla1-truncated’ MTREC complex.
A Y2H experiments showing the effects of deletion of Red1 residues 288-345 or Red1W298A/F305A double mutant on Pla1-Red1 interaction in the context of full-length proteins. B Coomassie blue stained SDS polyacrylamide gel of tandem affinity purified MTREC complex using Red1 as bait, from respective mutant strains (a representative gel from two independent experiments is shown); and C heat map representation of mass-spectrometry (MS) analysis of these purifications. Heat map shows the changes in the amount of co-purifying MTREC subunits (except the Cbc1 subunit which was not conclusively quantified), in indicated mutant strains compared to WT. Co-purifying protein amounts were normalised to the corresponding purified bait protein (WT or mutant Red1) amount. D Co-Immunoprecipitation (co-IP) of HA-tagged Pla1 (Pla1-HA) using Red1 as bait in WT and Red1 mutant strains. Inputs and final eluates of the tandem affinity purifications of the indicated strains were blotted to nitrocellulose membrane and cut around the 100 kDa marker. The bottom part of the membrane was probed with α-HA to detect co-purifying Pla1-HA (top panel) and the top part was probed with α-Flag to detect the bait protein Red1-FTP (bottom panel). Note that the Red1 bait protein in the Flag eluate runs ~20 kDa lower than in the input, due to the cleavage of the C-terminal Protein-A tag by the TEV enzyme during the elution step from the IgG column (see details in Methods section). A representative membrane from two independent experiments is shown. Source data are provided in Source Data file.
Fig. 5
Fig. 5. Pla1 in the context of the MTREC complex is responsible for degradation of PROMPTs.
A, B Metagene profile of sense (A) and antisense (B) RNA levels in the indicated strains for a subset of S. pombe genes with detectable levels of PROMPTs (2400 genes). The geometric average of RNA levels from 500 bp upstream to 750 bp downstream of the transcription start site (TSS) and 750 bp upstream to 500 bp downstream of the transcription termination site (TTS) are shown. Solid lines represent the average of two replicates for all indicated strains, with the exception of red1∆ which represent a single dataset. Dotted lines indicate the individual biological replicates. The grey shading represents the average RNA levels in the WT strain. C Strand-specific RNA-seq read coverage of a representative set of genes in WT and mutant strains. Dashed boxes highlight two representative examples of CUTs: antisense RNA transcripts (AS) on the left panel and PROMPTs on the right panel. D, E Box-plot of mean poly(A) tail length distribution of MTREC-associated mRNAs (D) and PROMPTs (E) for the WT and indicated mutant strains (5135 mRNAs and 619 PROMPTs with FC > 2 are shown). Dots represent the mean poly(A) tail length of individual mRNAs/PROMPTs, boxes show the 25–75 percentile range and the horizontal lines represent the median values. Upper and lower whiskers represent 75th percentile plus 1.5 times the inter-quartile distance (IQR) and he 25th percentile minus 1.5IQR, respectively. Source data are provided in Source Data file.
Fig. 6
Fig. 6. Interactions between MTREC and CPF.
A ITC titration of Iss1 into Pla1RRM. B ITC titration of Red1288-345 into a pre-formed complex of Pla1RRM-Iss130-76. C ITC titration of Iss1 into a pre-formed complex of Pla1RRM-Red1288-345. The calculated dissociation constants (KD) from an average of two independent measurements are shown. BLI kinetic analyses of biotinylated Red1288-345 and Iss130-76 with varying concentrations of Pla1FL are shown in panels D and E, respectively. Black lines represent fits to the experimental data obtained using a 1:1 binding global fitting model. F Y2H experiments show interaction between Msi2 fused to G4BD and MTREC components Mmi1 or Pab2 fused to G4AD compared to an auto-activation control (ctrl).
Fig. 7
Fig. 7. Pla1 – MTREC interaction is required for efficient assembly of facultative heterochromatic islands at meiotic genes.
A Genome-wide heat-map representation of H3K9me2 ChIP-seq analysis of three independent WT strains (WT-1 is the isogenic WT strain for the mutants) and red1Δ, red1W298A/F305A and red1Δ288-345 mutants, showing the H3K9me2 enrichment levels (yellow/blue scale of 0-500) for the 3 chromosomes of the S. pombe genome (length not to scale). Centromeres, Mating-type locus, telomeres and a selection of facultative heterochromatic islands are indicated. B Representative examples of red1∆-sensitive meiotic heterochromatic islands in WTs and mutant strains are shown in higher resolution (scales are indicated for individual islands). C Average of H3K9me2 enrichment over all meiotic heterochromatic islands (12 islands: is1(mcp7); is1.5(tht2); is1.6(SPAC631.02), is2(mug8); is4(SPAC8C9.04/SPNCRNA.925); is5(vps29); is6(ssm4); is8(mcp5); is9(mei4); is16(mbx2/SPNCRNA.1626); is17(mug45); is20(mug9)) plotted on a linear scale. The plots represent the geometric average of enrichment values from 500 bp upstream to 500 bp downstream of the islands, with the island regions scaled to the same lengths for all islands (stretched or condensed to 2000 bp). The grey shading represents the average H3K9me2 enrichment levels in the WT strain. D Representative examples of non-meiotic (red1∆-insensitive) heterochromatic islands in WTs and mutant strains (scales are indicated for individual islands).
Fig. 8
Fig. 8. Model of the role of Pla1 in MTREC-mediated degradation of CUTs.
MTREC complex is recruited to CUTs and meiotic mRNAs during their transcription by a not well understood mechanism. Pla1, as part of the CPF, is responsible for the initial poly-adenylation of CUTs and the resulting poly(A) tail is likely bound by the canonical poly(A) binding protein Pabp. MTREC complex sequesters Pla1 from CPF via Red1, replacing Iss1 that anchors Pla1 to CPF. MTREC-bound Pla1 hyper-adenylates CUTs. We suggest that the non-canonical poly(A)-binding protein, Pab2, might be preferentially loaded on these poly(A) tail extensions (marked with a "?" in the Fig.) to facilitate exosome-mediated degradation of CUTs. Both the CPF complex and the Red1-Pla1 interaction are required for the efficient recruitment of the ClrC complex to methylate histone H3K9 at meiotic heterochromatic islands, indicating a sophisticated functional interplay between CPF and MTREC complex during the transcriptional termination, end-processing and degradation of CUTs.

References

    1. Kilchert C, Wittmann S, Vasiljeva L. The regulation and functions of the nuclear RNA exosome complex. Nat. Rev. Mol. Cell Biol. 2016;17:227–239. doi: 10.1038/nrm.2015.15. - DOI - PubMed
    1. Mitchell P. Exosome substrate targeting: the long and short of it. Biochem Soc. Trans. 2014;42:1129–1134. doi: 10.1042/BST20140088. - DOI - PubMed
    1. Mitchell P, Petfalski E, Shevchenko A, Mann M, Tollervey D. The exosome: a conserved eukaryotic RNA processing complex containing multiple 3’–>5’ exoribonucleases. Cell. 1997;91:457–466. doi: 10.1016/S0092-8674(00)80432-8. - DOI - PubMed
    1. Core LJ, Waterfall JJ, Lis JT. Nascent RNA sequencing reveals widespread pausing and divergent initiation at human promoters. Science. 2008;322:1845–1848. doi: 10.1126/science.1162228. - DOI - PMC - PubMed
    1. Xu Z, et al. Bidirectional promoters generate pervasive transcription in yeast. Nature. 2009;457:1033–1037. doi: 10.1038/nature07728. - DOI - PMC - PubMed

Publication types

MeSH terms