. 2023 Mar;42(14):1072-1087.
doi: 10.1038/s41388-023-02619-4. Epub 2023 Feb 11.

Targeting the E3 ligase NEDD4 as a novel therapeutic strategy for IGF1 signal pathway-driven gastric cancer

Affiliations

Targeting the E3 ligase NEDD4 as a novel therapeutic strategy for IGF1 signal pathway-driven gastric cancer

Ke Wang et al. Oncogene. 2023 Mar.

Abstract

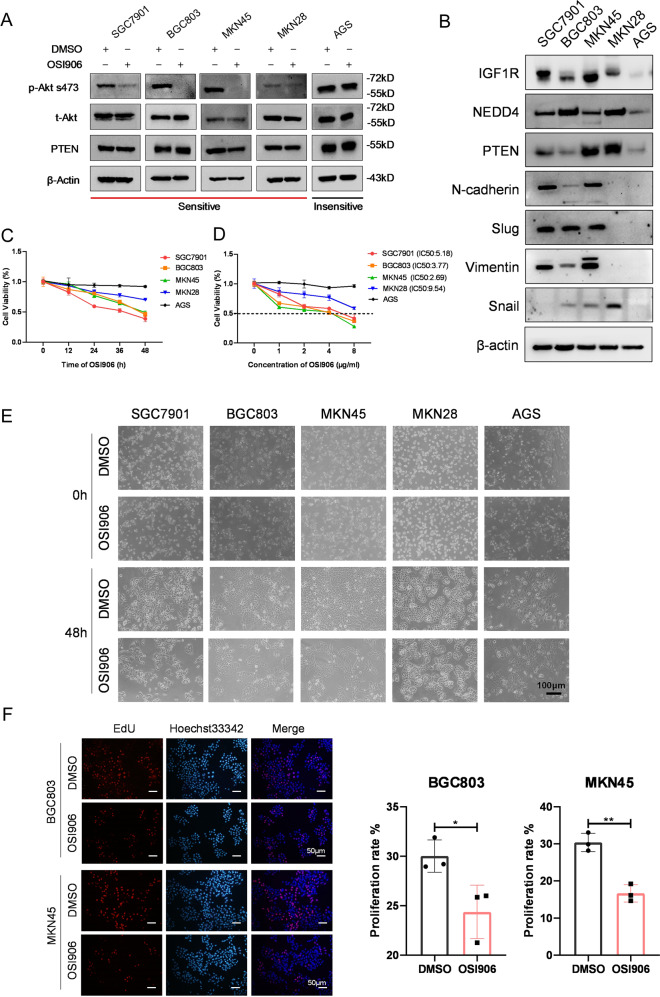
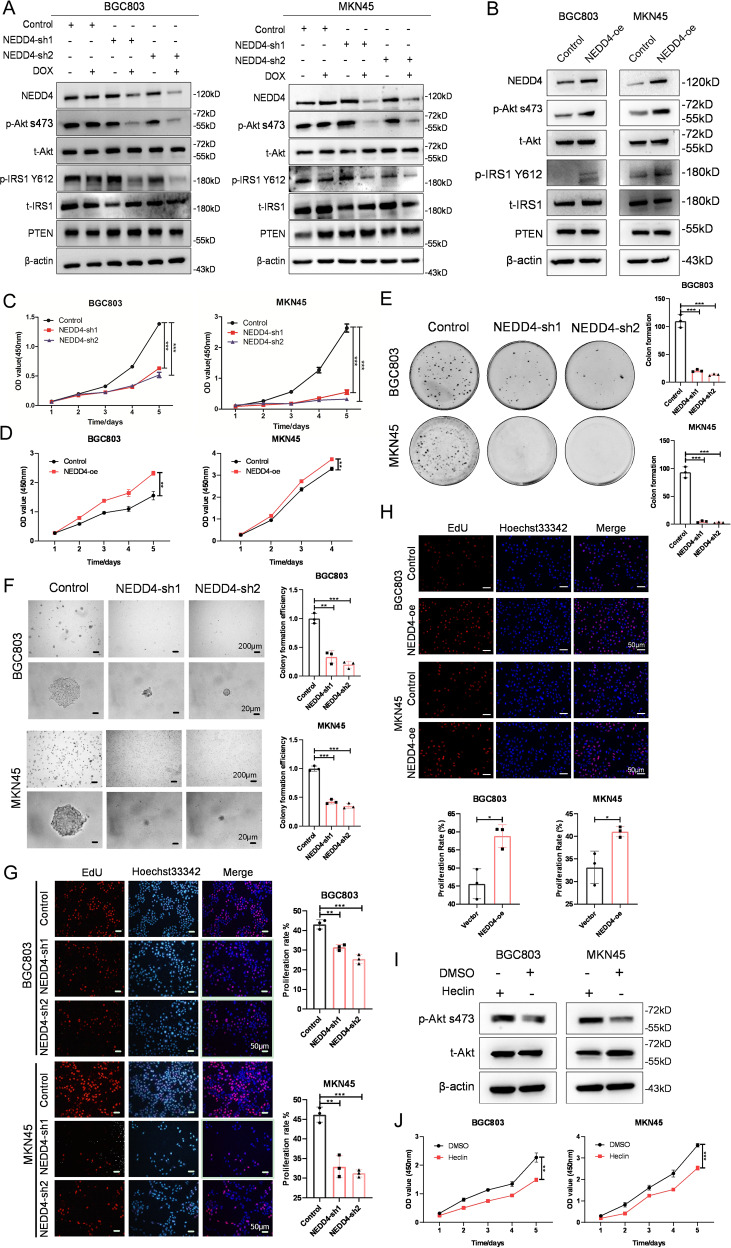
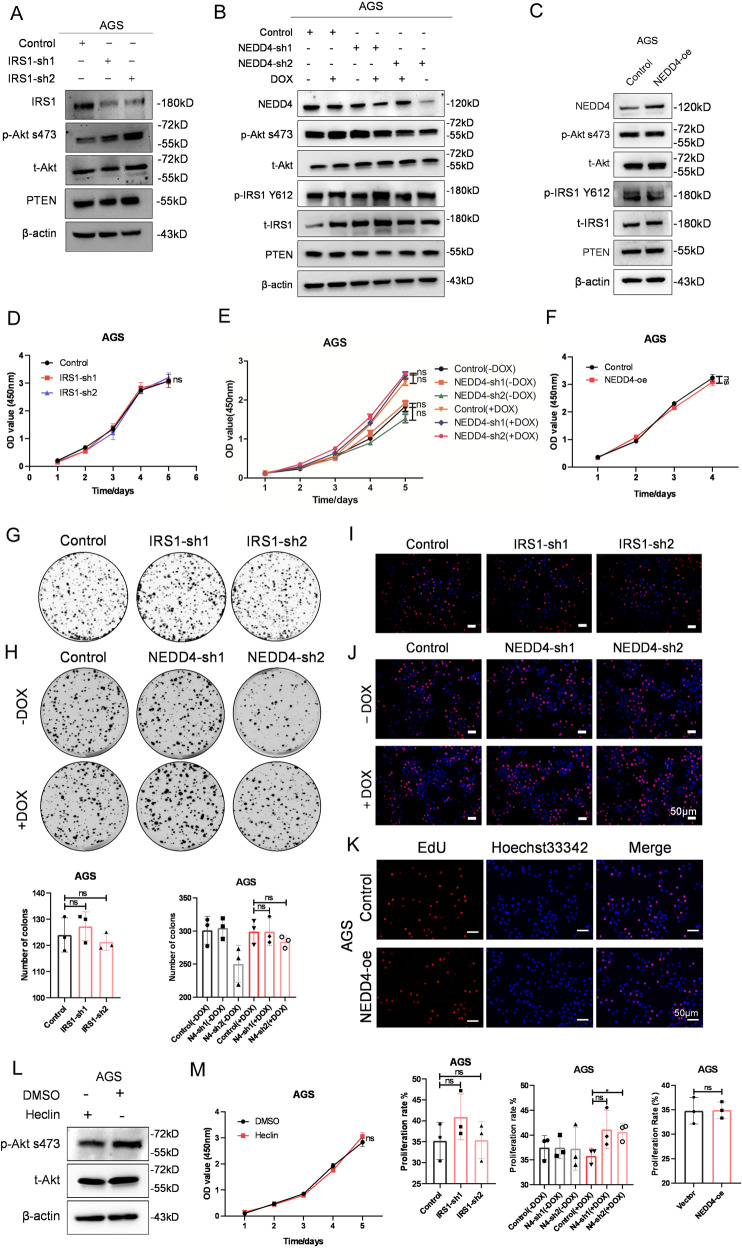
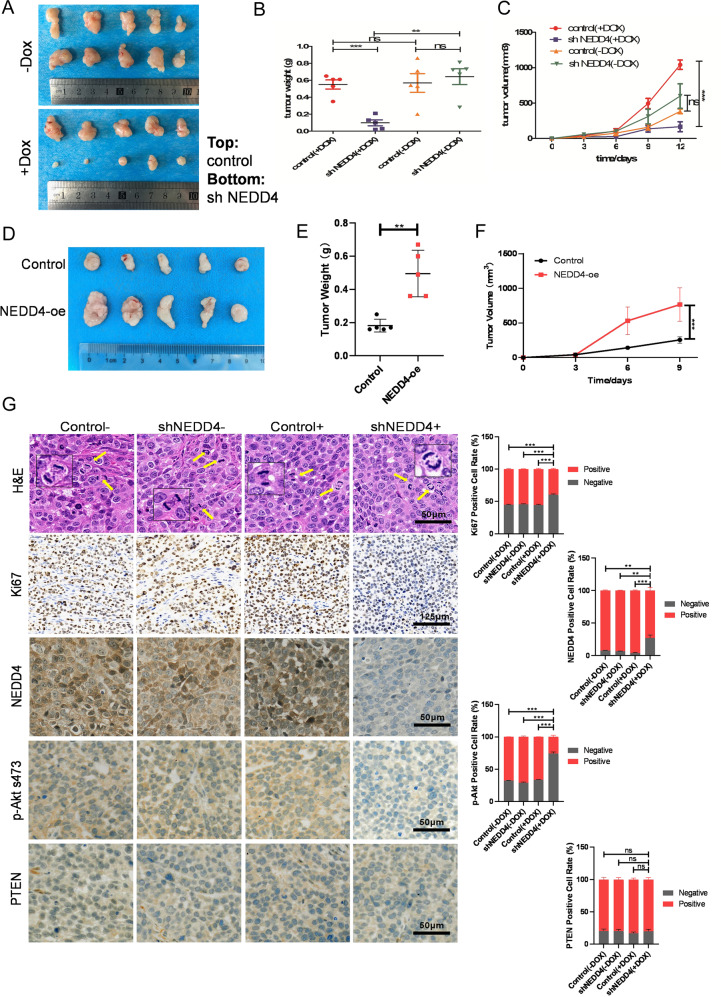
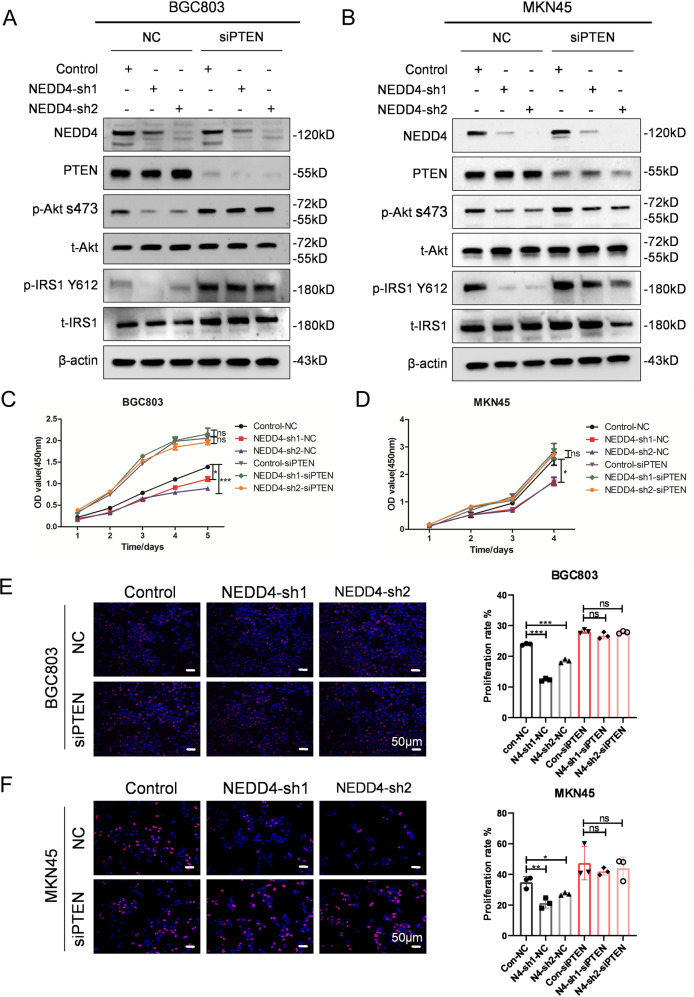
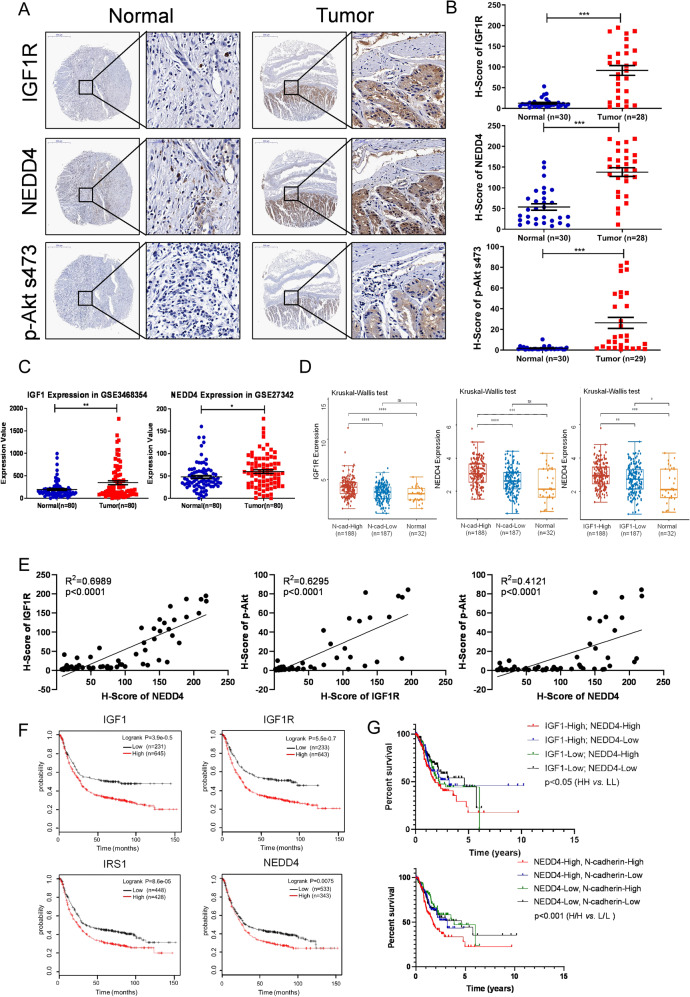
The IGF1 signal pathway is highly activated in some subtype of gastric cancer(GC) that exhibits poor survival and chemotherapy resistance. Although the results of clinical trials of anti-IGF1R monoclonal antibodies and IGF-1R inhibitors have been mostly disappointing in unselected cancer patients, some patients benefit from anti-IGF1R therapy in these failed studies. Therefore, it is necessary to characterize the complex IGF signaling in GC and help refine the strategies targeting the IGF1 pathway. We found that GC cell lines exhibit differential responses to the specific IGF1R inhibitor OSI906. According to the phosphorylation status of Akt upon the OSI906 treatment, we divided the GC cell lines into IGF1R-dependent and IGF1R-independent cells. Both in vitro and in vivo experiments indicate that Dox-induced knockdown of NEDD4 significantly suppresses tumor growth of IGF1R-dependent GC cells and NEDD4 overexpression promotes tumor growth of IGF1R-dependent GC cells. In contrast, the proliferation of IGF1R-independent GC cells is not affected by NEDD4 silencing and overexpression. The rescue experiments show that a PTEN-IRS1 axis is required for NEDD4-mediated regulation of Akt activation and tumor growth in GC cells. Clinically, NEDD4 is expressed higher in IGF1-high GC tissues compared with IGF1-low GC tissues and normal tissues, and the co-high expression of NEDD4 and IGF1 predicts a worse prognosis in GC patients. Taken together, our study demonstrated that NEDD4 specifically promotes proliferation of GC cells dependent on IGF1/IGF1R signaling by antagonizing the protein phosphatase activity of PTEN to IRS1, and targeting NEDD4 may be a promising therapeutic strategy for IGF1 signal pathway-driven gastric cancer.


Conflict of interest statement

The authors declare no competing interests.

Figures

Fig. 1
Fig. 1. GC cell lines show differential sensitivity to IGF1R specific inhibitor.
A Western blot analysis of p-Akt s473, t-Akt, PTEN, and β-actin protein levels in five GC cell lines after being treated with DMSO and OSI906 (2 μg/ml, 48 h). B Western blot analysis of the constitutive expression of IGF1R, NEDD4, PTEN, N-Cadherin, Slug, Vimentin, and Snail in five GC cell lines. Cell activity (%) detection after treatment of 2 μg/ml OSI906 for 0, 12, 24, 36, and 48 h, respectively (C) and treatment of 0, 1, 2, 4, and 8 μg/ml OSI906 for 48 h respectively (D) by Cell Counting Kit-8 (CCK-8) assay. The IC50 of SGC7901, BGC803, MKN45, and MKN28 is 5.18, 3.77, 2.69, and 9.54 μg/ml, respectively. E Representative Microscope images of five GC cell lines treated with DMSO (0 h and 48 h) and OSI906 (2 μg/ml, 0 and 48 h). F The EdU (5-Ethynyl-2′- deoxyuridine) assay showing the proliferation rate of BGC803 and MKN45 after being treated with OSI906 (2 μg/ml) for 48 h. ***p < 0.001, **p < 0.01, *p < 0.05.
Fig. 2
Fig. 2. An IRS1-PTEN axis is required for the proliferation of IGF1R-dependent GC cells.
A Western blot analysis of PTEN, p-Akt s473, t-Akt, p-IRS1 Y612, and t-IRS1 expression in BGC803 and MKN45 cells transfected with PTEN siRNAs. B Western blot analysis of IRS1, p-Akt t308, p-Akt s473, t-Akt, and PTEN expression in BGC803 and MKN45 cells infected with lentivirus expressing IRS1-specific shRNA or scramble shRNA. Cell proliferation ability detection of BGC803 and MKN45 cells after IRS1 knockdown by (C) CCK-8 assay, (D) plate clone formation assay, (E) soft agar clone formation assay, and (F) EdU assay. ***p < 0.001, **p < 0.01, *p < 0.05.
Fig. 3
Fig. 3. NEDD4 promotes proliferation of IGF1R-dependent GC cells.
A Western blot analysis of NEDD4, p-Akt s473, t-Akt, p-IRS1 Y612, t-IRS1, and PTEN protein level in BGC803 and MKN45 cells after Dox-induced silencing of NEDD4. NEDD4-con, scramble shRNA; NEDD4-sh1 and sh2, NEDD4 shRNA constructs 1 and 2. B Western blot analysis of NEDD4, p-Akt s473, t-Akt, p-IRS1 Y612, t-IRS1, and PTEN protein level in BGC803 and MKN45 cells after NEDD4 overexpression. Cell proliferation ability detection of BGC803 and MKN45 cells after NEDD4 knockdown and overexpression by (C, D) CCK-8 assay, (E) plate clone formation assay, (F) soft agar clone formation assay, and (G, H) EdU assay. I Western blot analysis of p-Akt s473 and t-Akt protein levels in BGC803 and MKN45 cells after treatment with Heclin (10 μM) for 48 h. J Cell viability detection of cells treated with Heclin (10 μM) by CCK-8 assay. ***p < 0.001, **p < 0.01, *p < 0.05, ns > 0.05.
Fig. 4
Fig. 4. Knockdown of IRS1 and NEDD4 does not affect the proliferation of IGF1R-independent GC cells.
A–C Western blot analysis of NEDD4, p-Akt s473, t-Akt, p-IRS1 Y612, t-IRS1, and PTEN protein level in AGS cells after silencing of IRS1 and NEDD4 and overexpressing NEDD4. Cell proliferation ability detection of AGS cells after IRS1 and NEDD4 knockdown and NEDD4 overexpression, respectively, by (D–F) CCK-8 assay, (G, H) plate clone formation assay, and (I–K) EdU assay. L Western blot analysis of p-Akt s473 and t-Akt in AGS cells after treatment of Heclin(10 μM) for 48 h. M Cell viability detection of AGS treated with Heclin (10 μM) by CCK-8 assay. ***p < 0.001, **p < 0.01, *p < 0.05, ns > 0.05.
Fig. 5
Fig. 5. NEDD4 promotes tumor growth of IGF1R-dependent GC cells in vivo.
A Representative images of tumors in nude mice after the injection of BGC803 cells stably expressing Dox-inducible NEDD4-shRNA and their controls (n = 5). B, C Quantification of tumor weights (B) and growth curves (C) of xenograft tumors in nude mice. D Representative images of tumors in nude mice after the injection of BGC803 cells transfected with NEDD4-expressing plasmids and negative control plasmids (n = 5). E, F Quantification of tumor weights (E) and growth curves (F) of xenograft tumors in nude mice. G, left Representative images of the hematoxylin and eosin (H&E) staining, Ki67, NEDD4, p-Akt s473, and PTEN IHC staining in tumor samples. G, right The percentages of positive cells were calculated by ImageJ IHC Profiler. ***p < 0.001, **p < 0.01, *p < 0.05, ns p > 0.05.
Fig. 6
Fig. 6. NEDD4 promotes proliferation of IGF1 signaling-dependent GC cells in a PTEN-dependent manner.
A, B Western blot analysis of NEDD4, PTEN, p-Akt s473, t-Akt, p-IRS Y612, and t-IRS1 protein level in BGC803 and MKN45 cells infected with lentivirus expressing scramble shRNA (control), shNEDD4-1 and shNEDD4-2 combined with PTEN siRNA. C, D CCK-8 assay and (E, F) EdU assay showing proliferation ability of the indicated cells. ***p < 0.001, **p < 0.01, *p < 0.05, ns p > 0.05.
Fig. 7
Fig. 7. High levels of the IGF1 pathway and NEDD4 are closely associated with poor prognosis of GC.
A Representative images of IGF1R, NEDD4, and p-Akt s473 expression in adjacent non-tumor tissues and primary GC tissues detected by IHC staining. B IHC scores of IGF1R, NEDD4, and p-Akt S473 expressions in adjacent non-tumor tissues and primary GC tissues. C Analysis of IGF1 and NEDD4 expressions in normal tissue and GC tissues from Gastric datasets (GSE3468354 and GSE27342, N, normal gastric mucosa, n = 80; T, gastric tumor, n = 80). D Analysis of IGF1R expression in GC stratified by N-cadherin expression and normal tissues, NEDD4 expression in GC stratified by N-cadherin expression and normal tissues, and NEDD4 expression in GC stratified by IGF1 expression and normal tissues in TCGA database. E Protein expression correlation of IGF1R, NEDD4, and p-Akt s473 in GC tissues. F Kaplan–Meier plots of OS among GC patients with different expressions of IGF1, IGF1R, IRS1, and NEDD4. G Overall survival rate of STAD from the TCGA database was analyzed according to the mRNA levels of IGF1 and NEDD4, NEDD4 and N-cadherin. IGF1-High/NEDD4-High (n = 103); IGF1-High/NEDD4-Low (n = 82); IGF1-Low/NEDD4-High (n = 82); IGF1-Low/NEDD4-Low (n = 103). NEDD4-High/N-cadherin-High (n = 111); NEDD4-High/N-cadherin-Low (n = 74); NEDD4-Low/N-cadherin-High (n = 74); NEDD4-Low/N-cadherin-Low (n = 111). ***p < 0.001, **p < 0.01, *p < 0.05, ns p > 0.05.

References

    1. Bray F, Ferlay J, Soerjomataram I, Siegel RL, Torre LA, Jemal A. Global cancer statistics 2018: GLOBOCAN estimates of incidence and mortality worldwide for 36 cancers in 185 countries. CA Cancer J Clin. 2018;68:394–424. doi: 10.3322/caac.21492. - DOI - PubMed
    1. Japanese Gastric Cancer Association. Japanese gastric cancer treatment guidelines 2014 (ver. 4). Gastric Cancer. 2017;20:1–19. - PMC - PubMed
    1. Smyth EC, Nilsson M, Grabsch HI, van Grieken NC, Lordick F. Gastric cancer. Lancet. 2020;396:635–48. doi: 10.1016/S0140-6736(20)31288-5. - DOI - PubMed
    1. Comprehensive molecular characterization of gastric adenocarcinoma. Nature. 2014;513:202–9. - PMC - PubMed
    1. Cristescu R, Lee J, Nebozhyn M, Kim KM, Ting JC, Wong SS, et al. Molecular analysis of gastric cancer identifies subtypes associated with distinct clinical outcomes. Nat Med. 2015;21:449–56. doi: 10.1038/nm.3850. - DOI - PubMed

Publication types

MeSH terms