. 2023 Apr;47(4):313-324.
doi: 10.1038/s41366-023-01271-y. Epub 2023 Feb 11.

Acute and long-term exercise adaptation of adipose tissue and skeletal muscle in humans: a matched transcriptomics approach after 8-week training-intervention

Affiliations

Acute and long-term exercise adaptation of adipose tissue and skeletal muscle in humans: a matched transcriptomics approach after 8-week training-intervention

Simon I Dreher et al. Int J Obes (Lond). 2023 Apr.

Abstract

Background: Exercise exerts many health benefits by directly inducing molecular alterations in physically utilized skeletal muscle. Molecular adaptations of subcutaneous adipose tissue (SCAT) might also contribute to the prevention of metabolic diseases.

Aim: To characterize the response of human SCAT based on changes in transcripts and mitochondrial respiration to acute and repeated bouts of exercise in comparison to skeletal muscle.

Methods: Sedentary participants (27 ± 4 yrs) with overweight or obesity underwent 8-week supervised endurance exercise 3×1h/week at 80% VO2peak. Before, 60 min after the first and last exercise bout and 5 days post intervention, biopsies were taken for transcriptomic analyses and high-resolution respirometry (n = 14, 8 female/6 male).

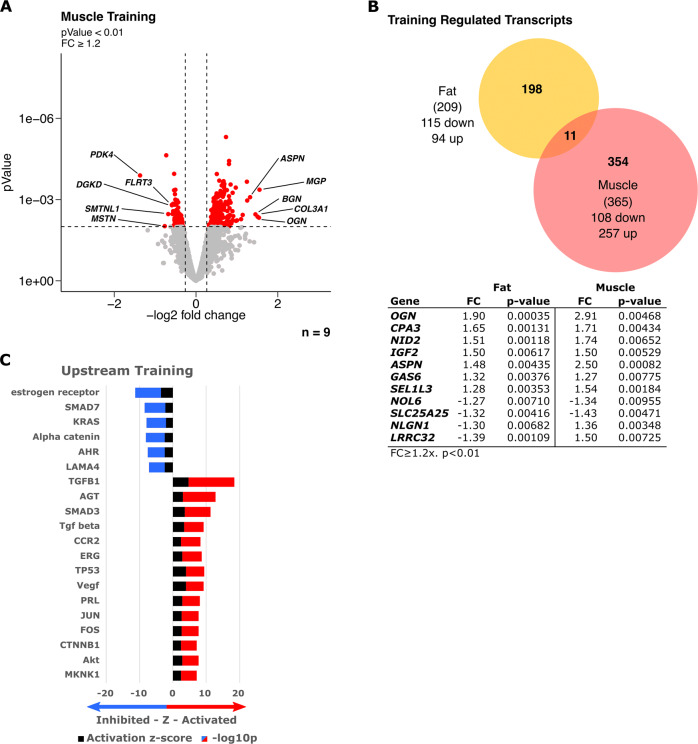
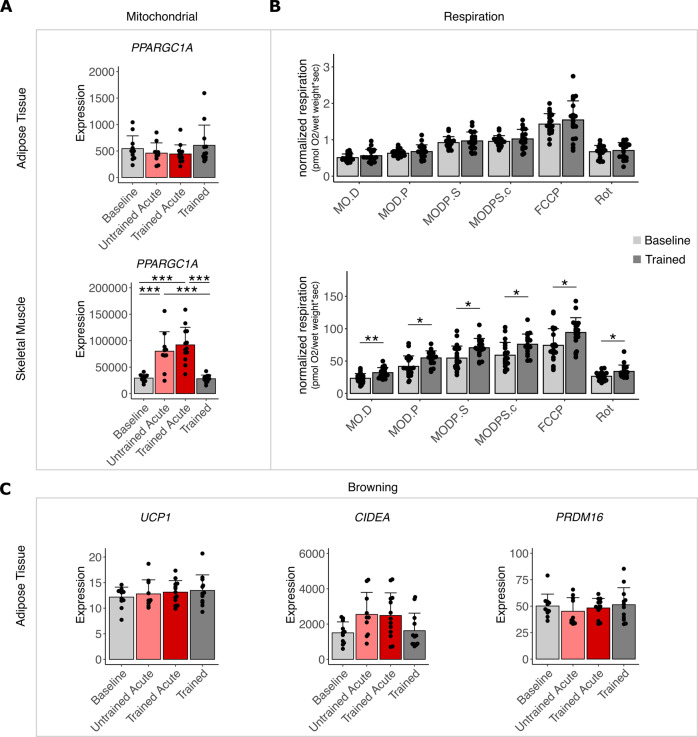
Results: In SCAT, we found 37 acutely regulated transcripts (FC > 1.2, FDR < 10%) after the first exercise bout compared to 394, respectively, in skeletal muscle. Regulation of only 5 transcripts overlapped between tissues highlighting their differential response. Upstream and enrichment analyses revealed reduced transcripts of lipid uptake, storage and lipogenesis directly after exercise in SCAT and point to β-adrenergic regulation as potential major driver. The data also suggest an exercise-induced modulation of the circadian clock in SCAT. Neither term was associated with transcriptomic changes in skeletal muscle. No evidence for beigeing/browning was found in SCAT along with unchanged respiration.

Conclusions: Adipose tissue responds completely distinct from adaptations of skeletal muscle to exercise. The acute and repeated reduction in transcripts of lipid storage and lipogenesis, interconnected with a modulated circadian rhythm, can counteract metabolic syndrome progression toward diabetes.


Conflict of interest statement

The authors declare no competing interests.

Figures

Fig. 1
Fig. 1. Acute transcriptomic exercise response in subcutaneous adipose tissue (Fat) biopsies of participants that underwent an 8-week training intervention program.
Transcriptomic changes were calculated to assess the acute exercise effects (n = 8) and the long-term training (n = 9) effects as compared to the baseline untrained state. A Volcano plot depicting up- and down-regulated transcripts in fat after acute exercise in an untrained state. Transcripts with FC ≥ 1.2 and limma t-test with BH correction at FDR < 10% were considered significantly regulated (red). Top 5 regulated transcripts based on FC were labeled. B Enrichment analysis of significantly regulated transcripts in fat after acute exercise in an untrained state (FC ≥ 1.2 and limma t-test p < 0.01). C Volcano plot depicting up- and down-regulated transcripts in fat after 8 weeks of training in a rested state FC ≥ 1.2 and limma t-test p < 0.01. D Enrichment analysis of significantly regulated transcripts in fat after training (FC ≥ 1.2 and limma t-test p < 0.01). Shown are significantly enriched terms.
Fig. 2
Fig. 2. Regulation of genes related to lipid storage and lipogenesis and analysis of predicted upstream regulators.
Subcutaneous adipose tissue biopsies of participants that underwent an 8-week training intervention program were analyzed. Biopsies were taken before (Baseline n = 11) and after the intervention (Trained n = 12) as well as 60 min after the first (Untrained Acute n = 10) and last acute exercise bout (Trained Acute n = 13). Transcript level of (A) AACS, (B) ACACA, (C) GPAM, (D) INSIG1, (E) IRS1, (F) LDLR, (G) MID1IP1, (H) PNPLA3, (I) PPARG, (J) SREBF1, (K) ELOVL6, (L) FASN, (M) ANGPTL4, (N) ANGPTL8 was compared between each timepoint. Bars represent mean ± SD, individual data points are depicted. Significant differences were assessed using one-way ANOVA with Tukey correction, *p < 0.05, **p < 0.01, ***p < 0.001, n = 10–13 with n = 6 represented in all timepoints. Ingenuity Pathway Analysis software was used to predict the activation (z-score > 2) or inhibition (z-score < −2) of upstream regulators based on transcriptomic changes (FC ≥ 1.2 and limma t-test p < 0.01) after (O) acute untrained exercise (n = 8) and (P) long-term training (n = 9). Stacked bars represent activation z-score and −log10p values. Direction is based on a positive or negative z-sore indicating activated (red) or inhibited (blue) signaling of upstream regulators. Top 20 upstream regulators based on significant p values (p < 0.05) were plotted.
Fig. 3
Fig. 3. Circadian rhythm in adipose tissue.
Subcutaneous adipose tissue biopsies of participants that underwent an 8-week training intervention program were analyzed. All biopsies were taken at 11:00 am ± 30 min, before (Baseline, light gray n = 11) and after the intervention (Trained, dark gray n = 12) as well as 60 min after the first (Untrained Acute, light red n = 10) and last acute exercise bout (Trained Acute, dark red n = 13). Transcript levels of (A) CLOCK, (B) ARNTL/BMAL1, (C) PER1, (D) PER2, (E) CRY2, (F) AACS, (G) SREBF1, (H) PDK4 were integrated with the extrapolated circadian expression [31] of the respective genes in resting humans from samples assessed in [30] and shown in Table S2. The gray line represents extrapolated circadian expression pattern based on peak time data (y-axis depicts time of day). Bars represent mean ± SD, individual datapoints are depicted. Significant differences were assessed using one-way ANOVA with Tukey correction, *p < 0.05, **p < 0.01, ***p < 0.001, n = 10–13 with n = 6 represented in all timepoints.
Fig. 4
Fig. 4. Acute transcriptomic exercise response in skeletal muscle vs adipose tissue.
Transcriptomic changes were calculated in matched samples of subjects (Fat and Muscle) to assess the acute exercise effects (n = 8). A Volcano-Plots depicting up- and down-regulated transcripts in muscle after acute exercise in an untrained state. Transcripts with FC ≥ 1.2 and FDR < 10% were considered significantly regulated (red) and top 5 regulated transcripts based on FC were labeled. B Venn-Diagram representing the overlap of significantly regulated transcripts between fat (yellow) and muscle (red) after acute exercise in an untrained state. Significantly regulated transcripts overlapping between fat and muscle are listed in the tables with respective FC and adjusted p value (p.adj). C Upstream analysis based on transcriptomic changes in muscle (FC ≥ 1.2 and t-test p < 0.01) to identify significantly altered upstream regulator signaling (z-score > 2, p < 0.05) as untrained acute response. Stacked bars represent activation z-score and −log10p values. Direction is based on a positive or negative z-sore indicating activated (red) or inhibited (blue) signaling of upstream regulators. Top 20 upstream regulators based on p value are plotted.
Fig. 5
Fig. 5. Training adaptation of skeletal muscle vs adipose tissue transcriptome.
Skeletal muscle (Muscle) and subcutaneous adipose tissue (Fat) biopsies of participants that underwent an 8-week training intervention program were analyzed. Transcriptomic changes were calculated in matched samples of subjects (fat and muscle) to assess the long-term training (n = 9) effects. A Volcano plot depicting up- and down-regulated transcripts in muscle after 8 weeks of training in a rested state with FC ≥ 1.2 and limma t-test p < 0.01. Significantly regulated transcripts are depicted in red and top 5 based on FC were labeled. B Venn-Diagram representing the overlap of significantly regulated transcripts between fat (yellow) and muscle (red) after training. Significantly regulated and overlapping transcripts are listed in the table with respective FC and adjusted p value (p.adj). C Upstream regulator analysis based on transcriptomic changes in muscle (FC ≥ 1.2 and p < 0.01) to identify significantly altered upstream regulator activity (z-score > 2 or < −2, p < 0.05) as long-term training response. Stacked bars represent activation z-score and −log10p values. Direction is based on a positive or negative z-sore indicating activated (red) or inhibited (blue) signaling of upstream regulators. Top 20 upstream regulators based on p value are plotted.
Fig. 6
Fig. 6. Mitochondrial respiration and beigeing/browning.
Skeletal muscle and subcutaneous adipose tissue (biopsies of participants that underwent an 8-week training intervention program were analyzed. Biopsies were taken before (Baseline n = 11) and after the intervention (Trained n = 12) as well as 60 min after the first (Untrained Acute n = 10) and last acute exercise bout (Trained Acute n = 13). A Transcript level of PPARGC1A was compared between each timepoint in fat (top) and muscle (bottom) (n = 10–13 with n = 6 represented in all timepoints). B Respiration of fat (top) and muscle (bottom) was measured in response to indicated substrates before (Baseline) and after (Trained) 8 weeks of training (n = 14, results are subset of recently published data [26]). M = malate, O = octanoylcarnitine, D = adenosine diphosphate (ADP), P = pyruvate, S = succinate, c = cytochrome c, FCCP = carbonyl cyanide-p-trifluoromethoxyphenyl-hydrazone Rot = rotenone. C Transcript level of UCP1, CIDEA, PRDM16 in fat was compared between each timepoint (n = 10–13 with n = 6 represented in all timepoints). Bars represent mean ± SD, individual datapoints are depicted. Significant differences were assessed using one-way ANOVA with Tukey correction (A and C) or Fisher’s LSD post hoc test (B), *p < 0.05, **p < 0.01, ***p < 0.001.

Similar articles

Cited by

References

    1. Lam DW, LeRoith D. The worldwide diabetes epidemic. Curr Opin Endocrinol Diabetes Obes. 2012;19:93–6. doi: 10.1097/MED.0b013e328350583a. - DOI - PubMed
    1. Unnikrishnan R, Pradeepa R, Joshi SR, Mohan V. Type 2 Diabetes: Demystifying the Global Epidemic. Diabetes. 2017;66:1432–42. doi: 10.2337/db16-0766. - DOI - PubMed
    1. Praet SF, van Loon LJ. Exercise: the brittle cornerstone of type 2 diabetes treatment. Diabetologia. 2008;51:398–401. doi: 10.1007/s00125-007-0910-y. - DOI - PMC - PubMed
    1. Pedersen BK, Saltin B. Exercise as medicine - evidence for prescribing exercise as therapy in 26 different chronic diseases. Scand J Med Sci Sports. 2015;25:1–72. doi: 10.1111/sms.12581. - DOI - PubMed
    1. Boule NG, Weisnagel SJ, Lakka TA, Tremblay A, Bergman RN, Rankinen T, et al. Effects of exercise training on glucose homeostasis: the HERITAGE Family Study. Diabetes Care. 2005;28:108–14. doi: 10.2337/diacare.28.1.108. - DOI - PubMed

Publication types