. 2023 Feb 11;21(1):116.
doi: 10.1186/s12967-023-03901-5.

Low muscle mass in lung cancer is associated with an inflammatory and immunosuppressive tumor microenvironment

Affiliations

Low muscle mass in lung cancer is associated with an inflammatory and immunosuppressive tumor microenvironment

Sarah Santiloni Cury et al. J Transl Med. .

Abstract

Background: Computed tomographies (CT) are useful for identifying muscle loss in non-small lung cancer (NSCLC) cachectic patients. However, we lack consensus on the best cutoff point for pectoralis muscle loss. We aimed to characterize NSCLC patients based on muscularity, clinical data, and the transcriptional profile from the tumor microenvironment to build a cachexia classification model.

Methods: We used machine learning to generate a muscle loss prediction model, and the tumor's cellular and transcriptional profile was characterized in patients with low muscularity. First, we measured the pectoralis muscle area (PMA) of 211 treatment-naive NSCLC patients using CT available in The Cancer Imaging Archive. The cutoffs were established using machine learning algorithms (CART and Cutoff Finder) on PMA, clinical, and survival data. We evaluated the prediction model in a validation set (36 NSCLC). Tumor RNA-Seq (GSE103584) was used to profile the transcriptome and cellular composition based on digital cytometry.

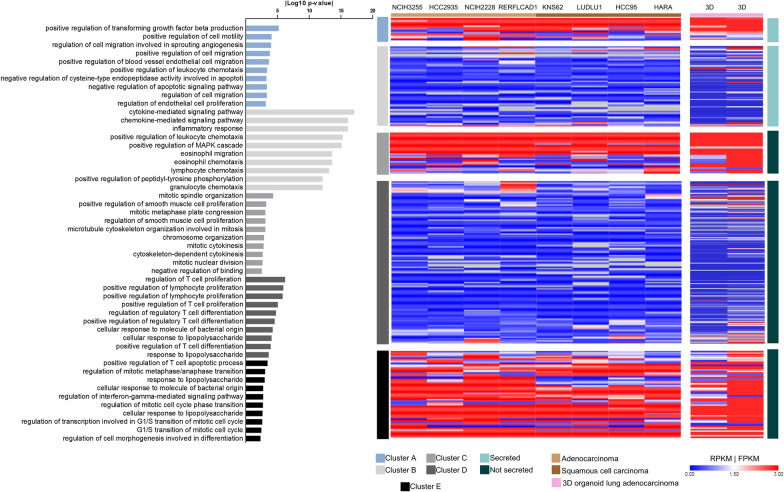
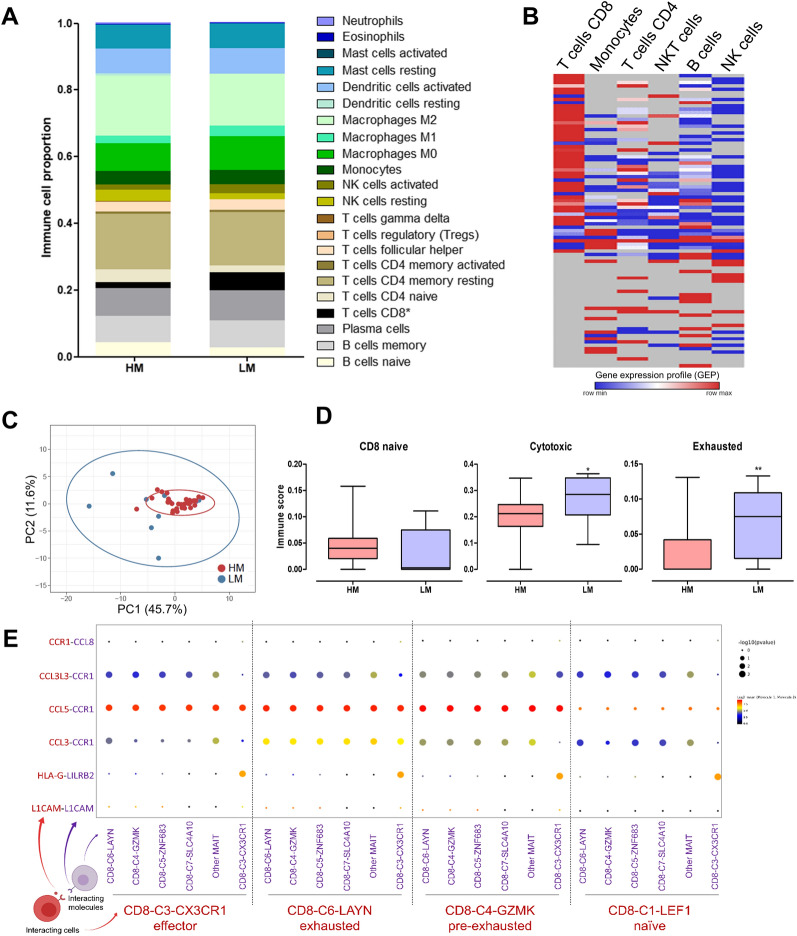
Results: CART demonstrated that a lower PMA was associated with a high risk of death (HR = 1.99). Cutoff Finder selected PMA cutoffs separating low-muscularity (LM) patients based on the risk of death (P-value = 0.003; discovery set). The cutoff presented 84% of success in classifying low muscle mass. The high risk of LM patients was also found in the validation set. Tumor RNA-Seq revealed 90 upregulated secretory genes in LM that potentially interact with muscle cell receptors. The LM upregulated genes enriched inflammatory biological processes. Digital cytometry revealed that LM patients presented high proportions of cytotoxic and exhausted CD8+ T cells.

Conclusions: Our prediction model identified cutoffs that distinguished patients with lower PMA and survival with an inflammatory and immunosuppressive TME enriched with inflammatory factors and CD8+ T cells.

Keywords: CD8+ T cells; Computed tomography; Machine learning; Non-small cell lung cancer; Transcriptomics.


Conflict of interest statement

The authors declare that they have no competing interests.

Figures

Fig. 1
Fig. 1
Cachexia classification models. A Decision tree generated using Classification And Regression Trees (CART). The bottom boxes indicate hazard ratios, the number of patients at risk in each leaf, and the percentage of patients in each leaf. This analysis was performed using the discovery set samples. B Kaplan–Meier survival curve generated by Cutoff Finder tool (red-curve: PMA > 0.71 and low-risk group; black-curve: PMA < 0.71 and high-risk group) using samples from the discovery set. C AUC-ROC curve demonstrating the specificity and sensitivity of PMA cutoffs in indicating low muscle mass (determined by third lumbar skeletal muscle index cutoffs [4]) in the discovery set. D Kaplan–Meier survival curve comparing LM (low-muscularity patients) and HM (high-muscularity patients) using samples from the validation set. Red-curve: PMA > 0.71 and low-risk group; Black-curve: PMA < 0.71 and high-risk group The resulting P-values for the log-rank test are shown. E Kaplan–Meier survival curve comparing low- and high-muscularity (LM and HM, respectively) patients by combining the discovery and validation datasets. Red-curve: PMA > 0.71 and low-risk group; Black-curve: PMA < 0.71 and high-risk group. The resulting P-values for the log-rank test are shown. HR: hazard ratio; CI: 95% confidence interval
Fig. 2
Fig. 2
Tumors from low-muscularity (LM) patients present a pro-inflammatory profile enriched with cachexia-inducing factors and mediators. A Principal component analysis (PCA) demonstrating similar expression profiles between high-muscularity (HM) and LM patients. B Volcano-plot demonstrating differentially expressed genes in LM (fold change > 1.5 and P-value < 0.05). C Enrichment analysis of top 10 terms related to biological processes from 332 up (red) and 350 downregulated (blue) genes in LM. Bar graphs represent ranked − log10 P-values (Fisher exact test), from the least to the most significant according to EnrichR analysis. D Protein–protein interaction networks of the ninety upregulated genes predicted to encode secreted proteins in LM patients. The larger the circles, the higher the betweenness centrality value of the node. Red intensities represent the gene expression fold change (logFC). Larger letter sizes indicate previously described cachexia-inducing factors in pan-cancer [10] and lung cancer [9]. Gray lines highlight the interactions. Interactions were visualized using Cytoscape v3.7.2. E Scatterplot comparing abundance (log10 FPKMs, y-axis) and degree of expression (log2-fold change, x-axis) of upregulated genes in LM. FPKM: Fragments Per Kilobase Million
Fig. 3
Fig. 3
Tumor-derived factors and skeletal muscle connectome. Left: alluvial diagram connecting the ligands from the upregulated genes in LM into its matched skeletal muscle receptors. Right: Heatmap of the expression levels of predicted receptors in human primary cell lineages, previously described by Ramilowski et al. [16] (red: Transcripts Per Million—TPM), four skeletal muscle tissues from BioGPS (gray: median gcRMA), and 491 skeletal muscle samples from the Genotype-Tissue Expression (GTEx) project (green: Trimmed Mean of M-values—TMM)
Fig. 4
Fig. 4
Tumor secretome derived from non-malignant NSCLC cells. Left: Enrichment analysis of the top 10 terms related to biological processes of each cluster according to EnrichR analysis. Right: Heatmap of gene abundance from cell lines (Reads Per Kilobase Million—RPKM) and lung adenocarcinoma derived-organoid duplicates (Fragment Per Kilobase Million—FPKM) in five clusters generated using k-means clustering analysis of secreted and non-secreted encoding genes. Global expression profiles of eight CCLE cell lines (Cancer Cell Line Encyclopedia) derived from adenocarcinoma (N = 4) and squamous cell carcinomas (N = 4) were evaluated. Global gene expression profiles of 3D organoids were collected from a single patient available in the HCMI catalog (Human Cancer Model Initiative)
Fig. 5
Fig. 5
Digital cytometry based on the gene expression profile revealed that LM patients presented high proportions of CD8+ T cells. A Bar graph representing 22 immune cell scores in patients with LM and HM calculated using CIBERSORTx. *P-value = 0.037 (Mann–Whitney). B Gene expression profiles (GEP) of secretome genes found upregulated in tumor tissue of LM patients analyzed in single-cell RNA-Seq in peripheral blood mononuclear cells (PBMCs) of NSCLC patients. GEP represents the estimated expression values (log2) calculated by CIBERSORTx using the group mode function. C Principal component analysis (PCA) demonstrating HM and LM clusters generated using the CD8+ T cells enriched expression profile. D Box-plots of CD8 naive, cytotoxic, and exhausted cell scores between LM and HM patients determined using ImmuCellAI. *P-value < 0.05. E Cell–cell communications between T cell subsets from NSCLC using the upregulated genes list enriched in LM patients (single-cell data of NSCLC T cell population from GSE99254). P-values are indicated by circle size. The average expression level of interacting molecule 1 in CD8 subset red and interacting molecule 2 in CD8 subset purple is indicated by color. Analysis was performed using CellPhoneDB. LM: low-muscularity; HM: high-muscularity

References

    1. Baracos VE, Martin L, Korc M, Guttridge DC, Fearon KCH. Cancer-associated cachexia. Nat Rev Dis Primer. 2018;4:17105. doi: 10.1038/nrdp.2017.105. - DOI - PubMed
    1. Kimura M, Naito T, Kenmotsu H, Taira T, Wakuda K, Oyakawa T, et al. Prognostic impact of cancer cachexia in patients with advanced non-small cell lung cancer. Support Care Cancer. 2015;23:1699–1708. doi: 10.1007/s00520-014-2534-3. - DOI - PubMed
    1. Herbst RS, Morgensztern D, Boshoff C. The biology and management of non-small cell lung cancer. Nature. 2018;553:446–454. doi: 10.1038/nature25183. - DOI - PubMed
    1. Fearon K, Strasser F, Anker SD, Bosaeus I, Bruera E, Fainsinger RL, et al. Definition and classification of cancer cachexia: an international consensus. Lancet Oncol. 2011;12:489–495. doi: 10.1016/S1470-2045(10)70218-7. - DOI - PubMed
    1. Buckinx F, Landi F, Cesari M, Fielding RA, Visser M, Engelke K, et al. Pitfalls in the measurement of muscle mass: a need for a reference standard: measurement of muscle mass. J Cachexia Sarcopenia Muscle. 2018;9:269–278. doi: 10.1002/jcsm.12268. - DOI - PMC - PubMed

Publication types

MeSH terms