

Diagnostic efficiency on ultrasound shear wave elastography in evaluation of steatosis severity for non-alcoholic fatty liver disease: a rat model
- PMID: 36774529
- PMCID: PMC9921353
- DOI: 10.1186/s40001-023-01042-5
Diagnostic efficiency on ultrasound shear wave elastography in evaluation of steatosis severity for non-alcoholic fatty liver disease: a rat model
Abstract
Background: The pathological feature of steatosis affects the elasticity values measured by shear wave elastography (SWE) is still controversial in non-alcoholic fatty liver disease (NAFLD). The aim of this study is to demonstrate the influence of steatosis on liver stiffness measured by SWE on a rat model with NAFLD and analyze feasibility of SWE for grading steatosis in absence of fibrosis.
Methods: Sixty-six rats were fed with methionine choline deficient diet or standard diet to produce various stages of steatosis; 48 rats were available for final analysis. Rats underwent abdominal ultrasound SWE examination and pathological assessment. Liver histopathology was analyzed to assess the degree of steatosis, inflammation, ballooning, and fibrosis according to the non-alcoholic fatty liver disease activity score. The diagnostic performance of SWE for differentiating steatosis stages was estimated according to the receiver operating characteristic (ROC) curve. Decision curve analysis (DCA) was conducted to determine clinical usefulness and the areas under DCA (AUDCAs) calculated.
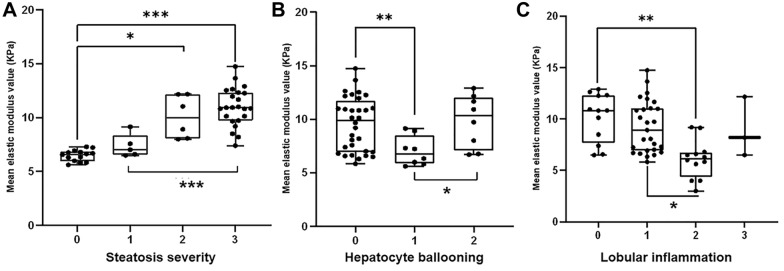
Results: In multivariate analysis, steatosis was an independent factor affecting the mean elastic modules (B = 1.558, P < 0.001), but not inflammation (B = - 0.031, P = 0.920) and ballooning (B = 0.216, P = 0.458). After adjusting for inflammation and ballooning, the AUROC of the mean elasticity for identifying S ≥ S1 was 0.956 (95%CI: 0.872-0.998) and the AUDCA, 0.621. The AUROC for distinguishing S ≥ S2 and S = S3 was 0.987 (95%CI: 0.951-1.000) and 0.920 (95%CI: 0.816-0.986) and the AUDCA was 0.506 and 0.256, respectively.
Conclusions: Steatosis is associated with liver stiffness and SWE may have the feasibility to be introduced as an assistive technology in grading steatosis for patients with NAFLD in absence of fibrosis.
Keywords: Fat quantification; Hepatic steatosis; Methionine choline deficiency; Non-alcoholic fatty liver disease; Shear wave elastography.
© 2023. The Author(s).
Conflict of interest statement
The authors declare that they have no competing interests.
Figures


Similar articles
-
Relationship between liver tissue stiffness and histopathological findings analyzed by shear wave elastography and compression testing in rats with non-alcoholic steatohepatitis.J Med Ultrason (2001). 2016 Jul;43(3):355-60. doi: 10.1007/s10396-016-0698-9. Epub 2016 Jan 28. J Med Ultrason (2001). 2016. PMID: 26821176
-
Viscoelasticity measured by shear wave elastography in a rat model of nonalcoholic fatty liver disease: comparison with dynamic mechanical analysis.Biomed Eng Online. 2021 May 3;20(1):45. doi: 10.1186/s12938-021-00879-3. Biomed Eng Online. 2021. PMID: 33941179 Free PMC article.
-
Liver fibrosis: noninvasive assessment using supersonic shear imaging and FIB4 index in patients with non-alcoholic fatty liver disease.J Med Ultrason (2001). 2018 Apr;45(2):243-249. doi: 10.1007/s10396-017-0840-3. Epub 2017 Nov 11. J Med Ultrason (2001). 2018. PMID: 29128938
-
Comparison of laboratory tests, ultrasound, or magnetic resonance elastography to detect fibrosis in patients with nonalcoholic fatty liver disease: A meta-analysis.Hepatology. 2017 Nov;66(5):1486-1501. doi: 10.1002/hep.29302. Epub 2017 Sep 26. Hepatology. 2017. PMID: 28586172 Review.
-
Transient Elastography in Alcoholic Liver Disease and Nonalcoholic Fatty Liver Disease: A Systemic Review and Meta-Analysis.Can J Gastroenterol Hepatol. 2021 Jan 20;2021:8859338. doi: 10.1155/2021/8859338. eCollection 2021. Can J Gastroenterol Hepatol. 2021. PMID: 33542909 Free PMC article.
Cited by
-
NO-IL-6/10-IL-1β axis: a new pathway in steatotic and non-steatotic liver grafts from brain-dead donor rats.Front Immunol. 2023 Aug 1;14:1178909. doi: 10.3389/fimmu.2023.1178909. eCollection 2023. Front Immunol. 2023. PMID: 37593740 Free PMC article.
-
Feasibility of shear wave elastography for assessing steatosis in early-stage non-alcoholic fatty liver disease.PLoS One. 2025 May 29;20(5):e0324637. doi: 10.1371/journal.pone.0324637. eCollection 2025. PLoS One. 2025. PMID: 40440252 Free PMC article.
References
MeSH terms
Grants and funding
LinkOut - more resources
Full Text Sources
Medical
