. 2023 Feb 28;42(2):112118.
doi: 10.1016/j.celrep.2023.112118. Epub 2023 Feb 13.

Regional and cell-type-specific afferent and efferent projections of the mouse claustrum

Affiliations

Regional and cell-type-specific afferent and efferent projections of the mouse claustrum

Quanxin Wang et al. Cell Rep. .

Abstract

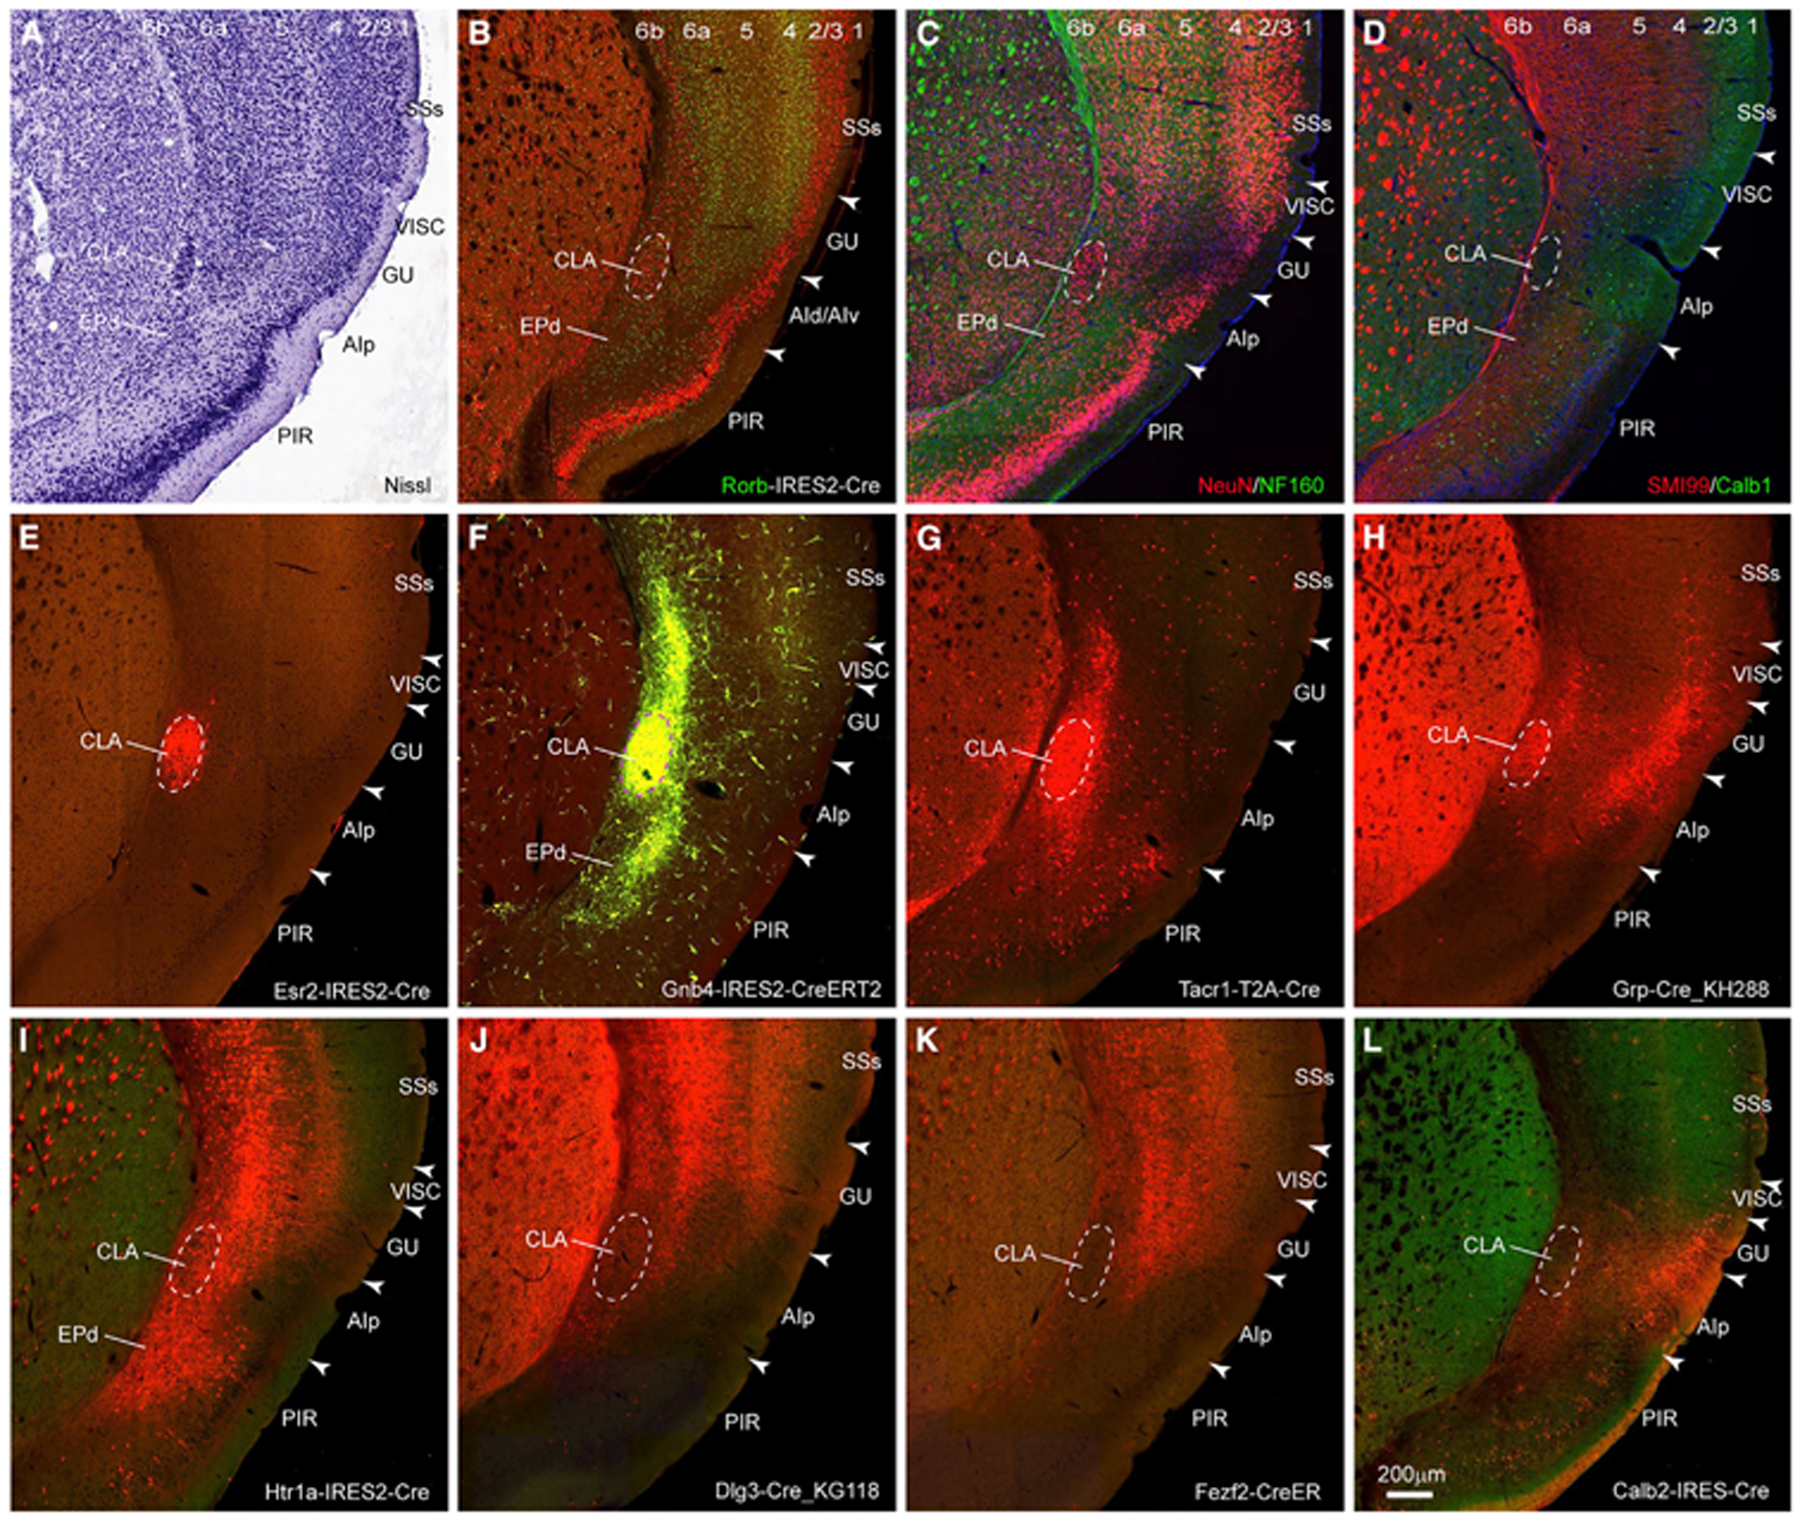
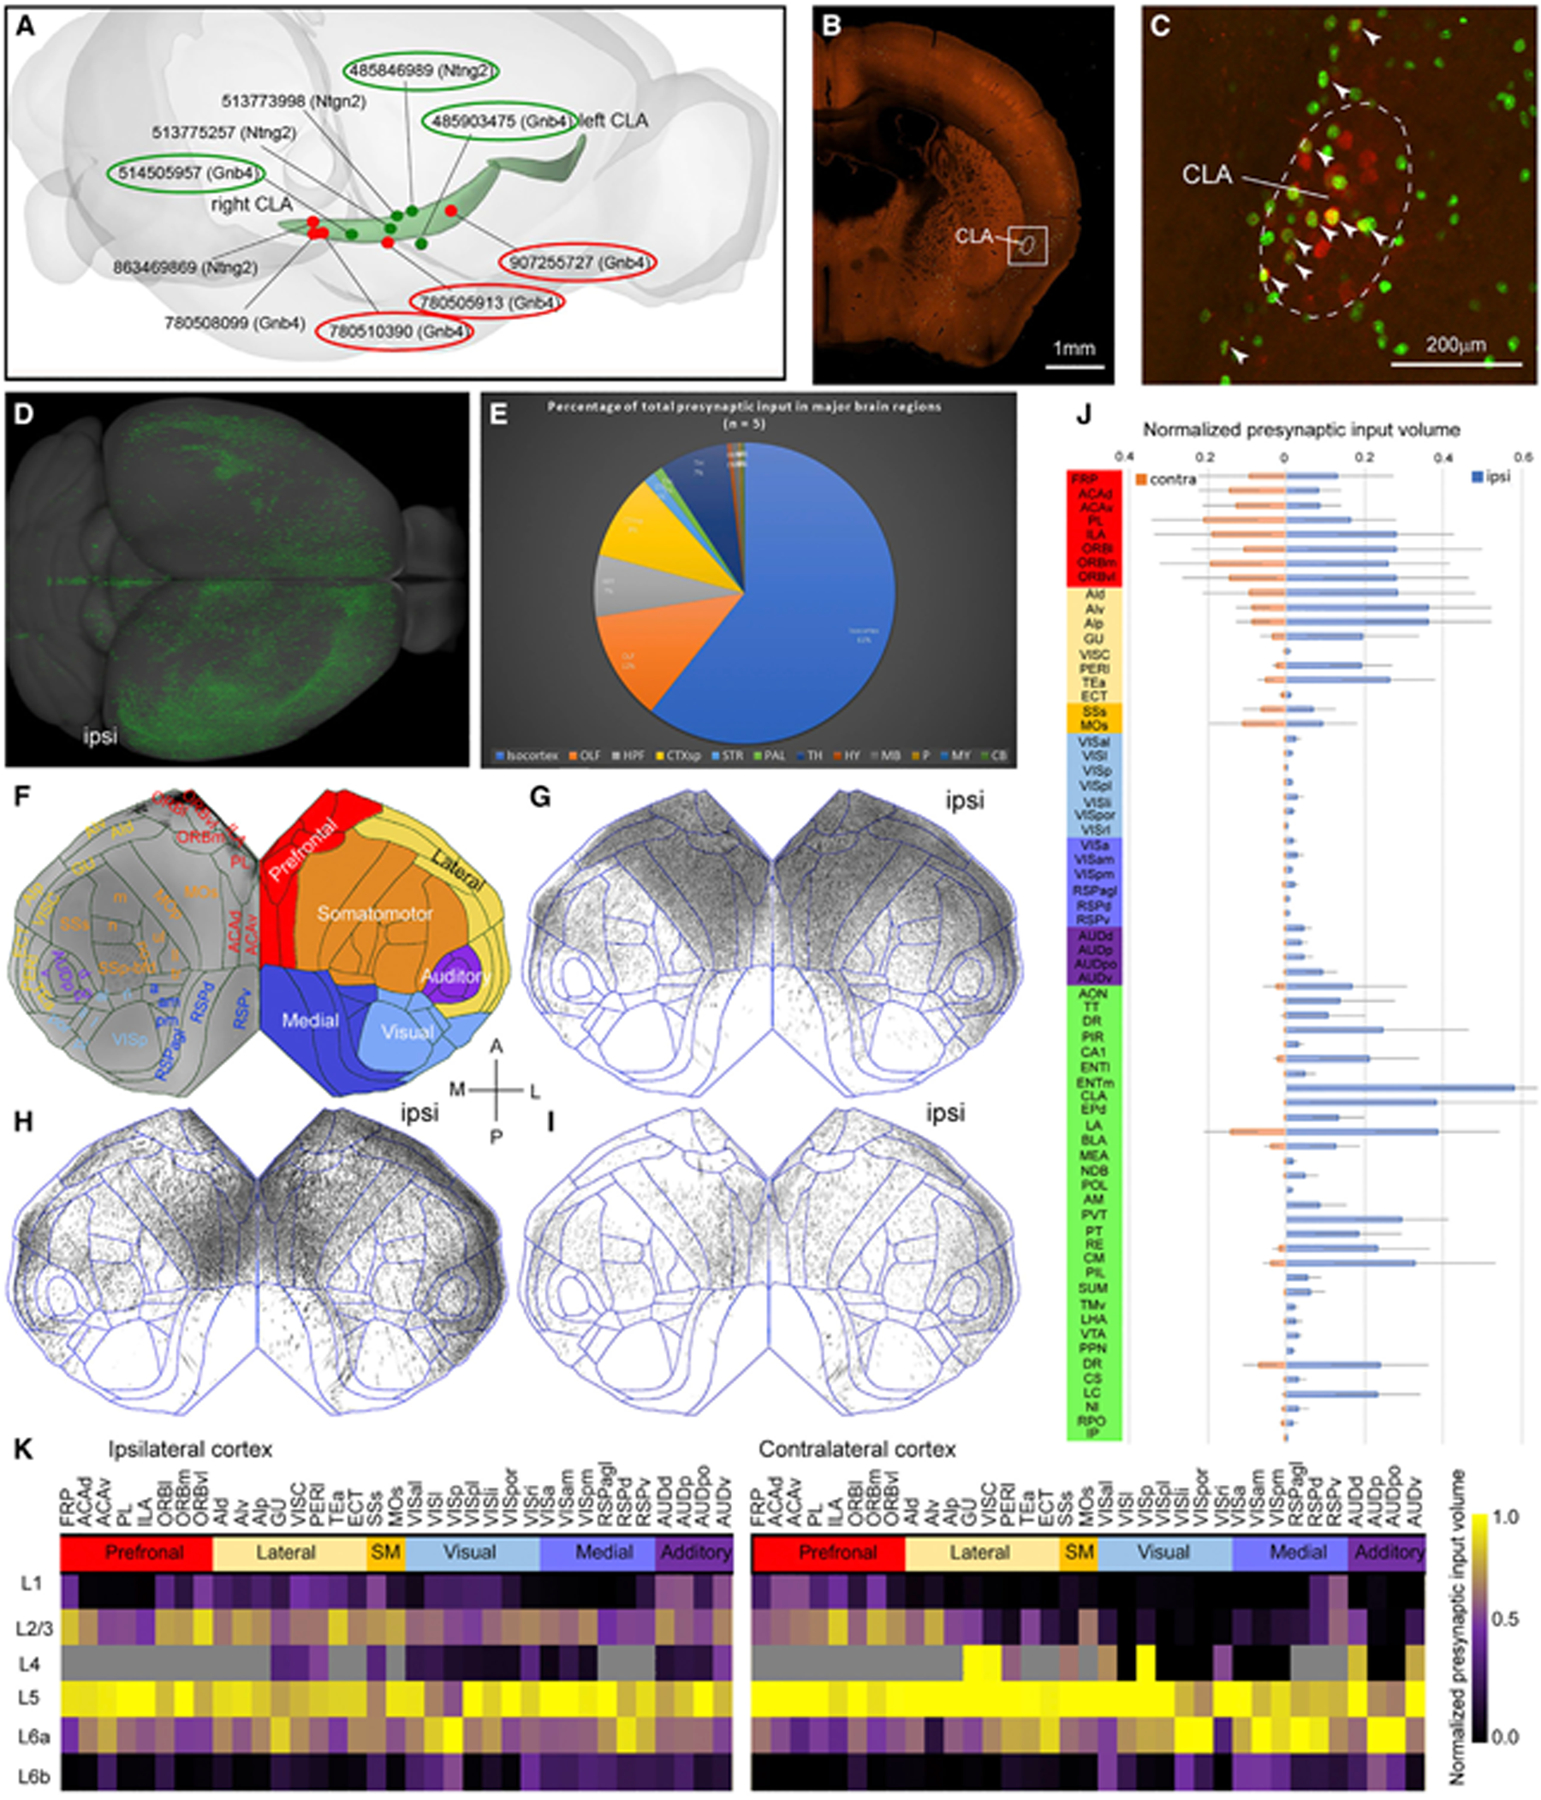
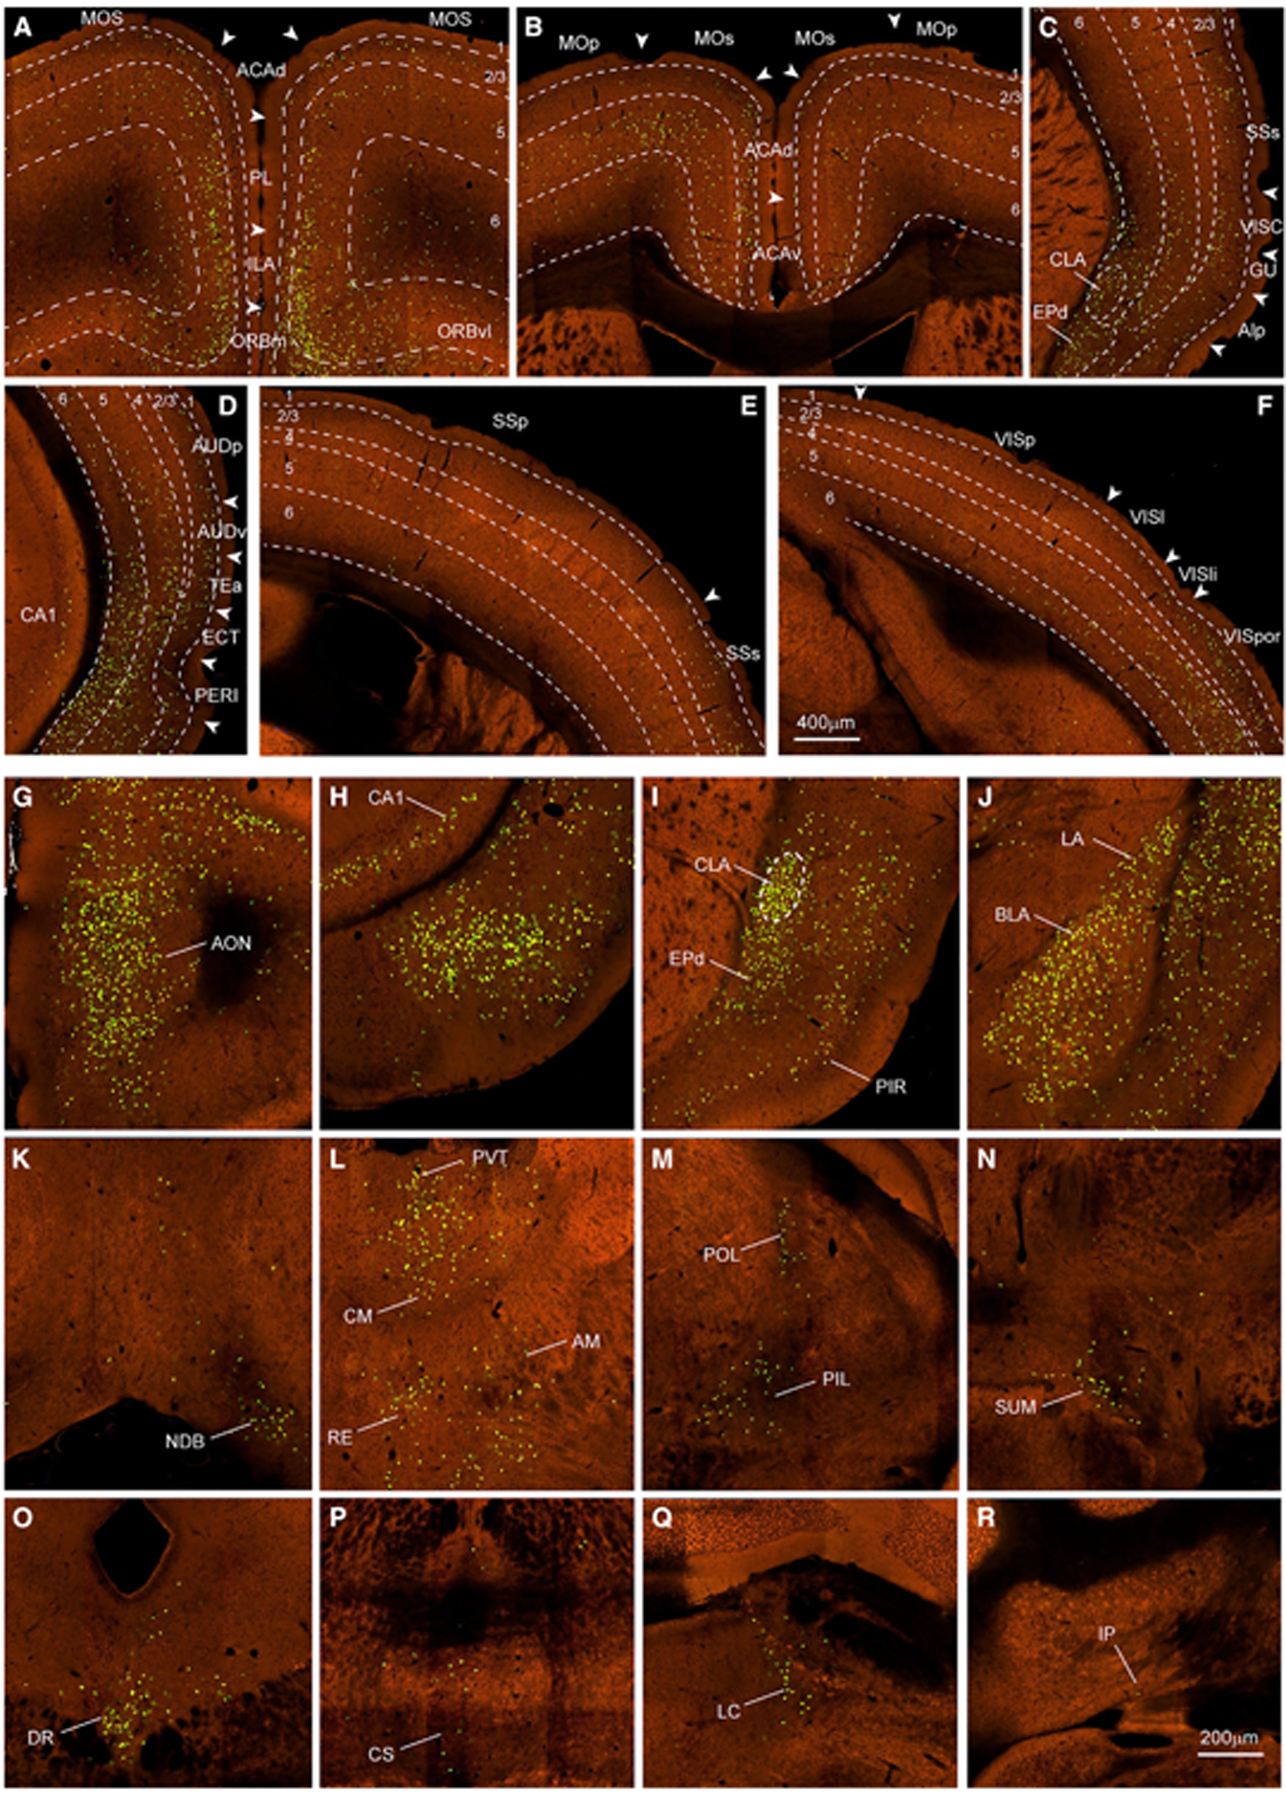
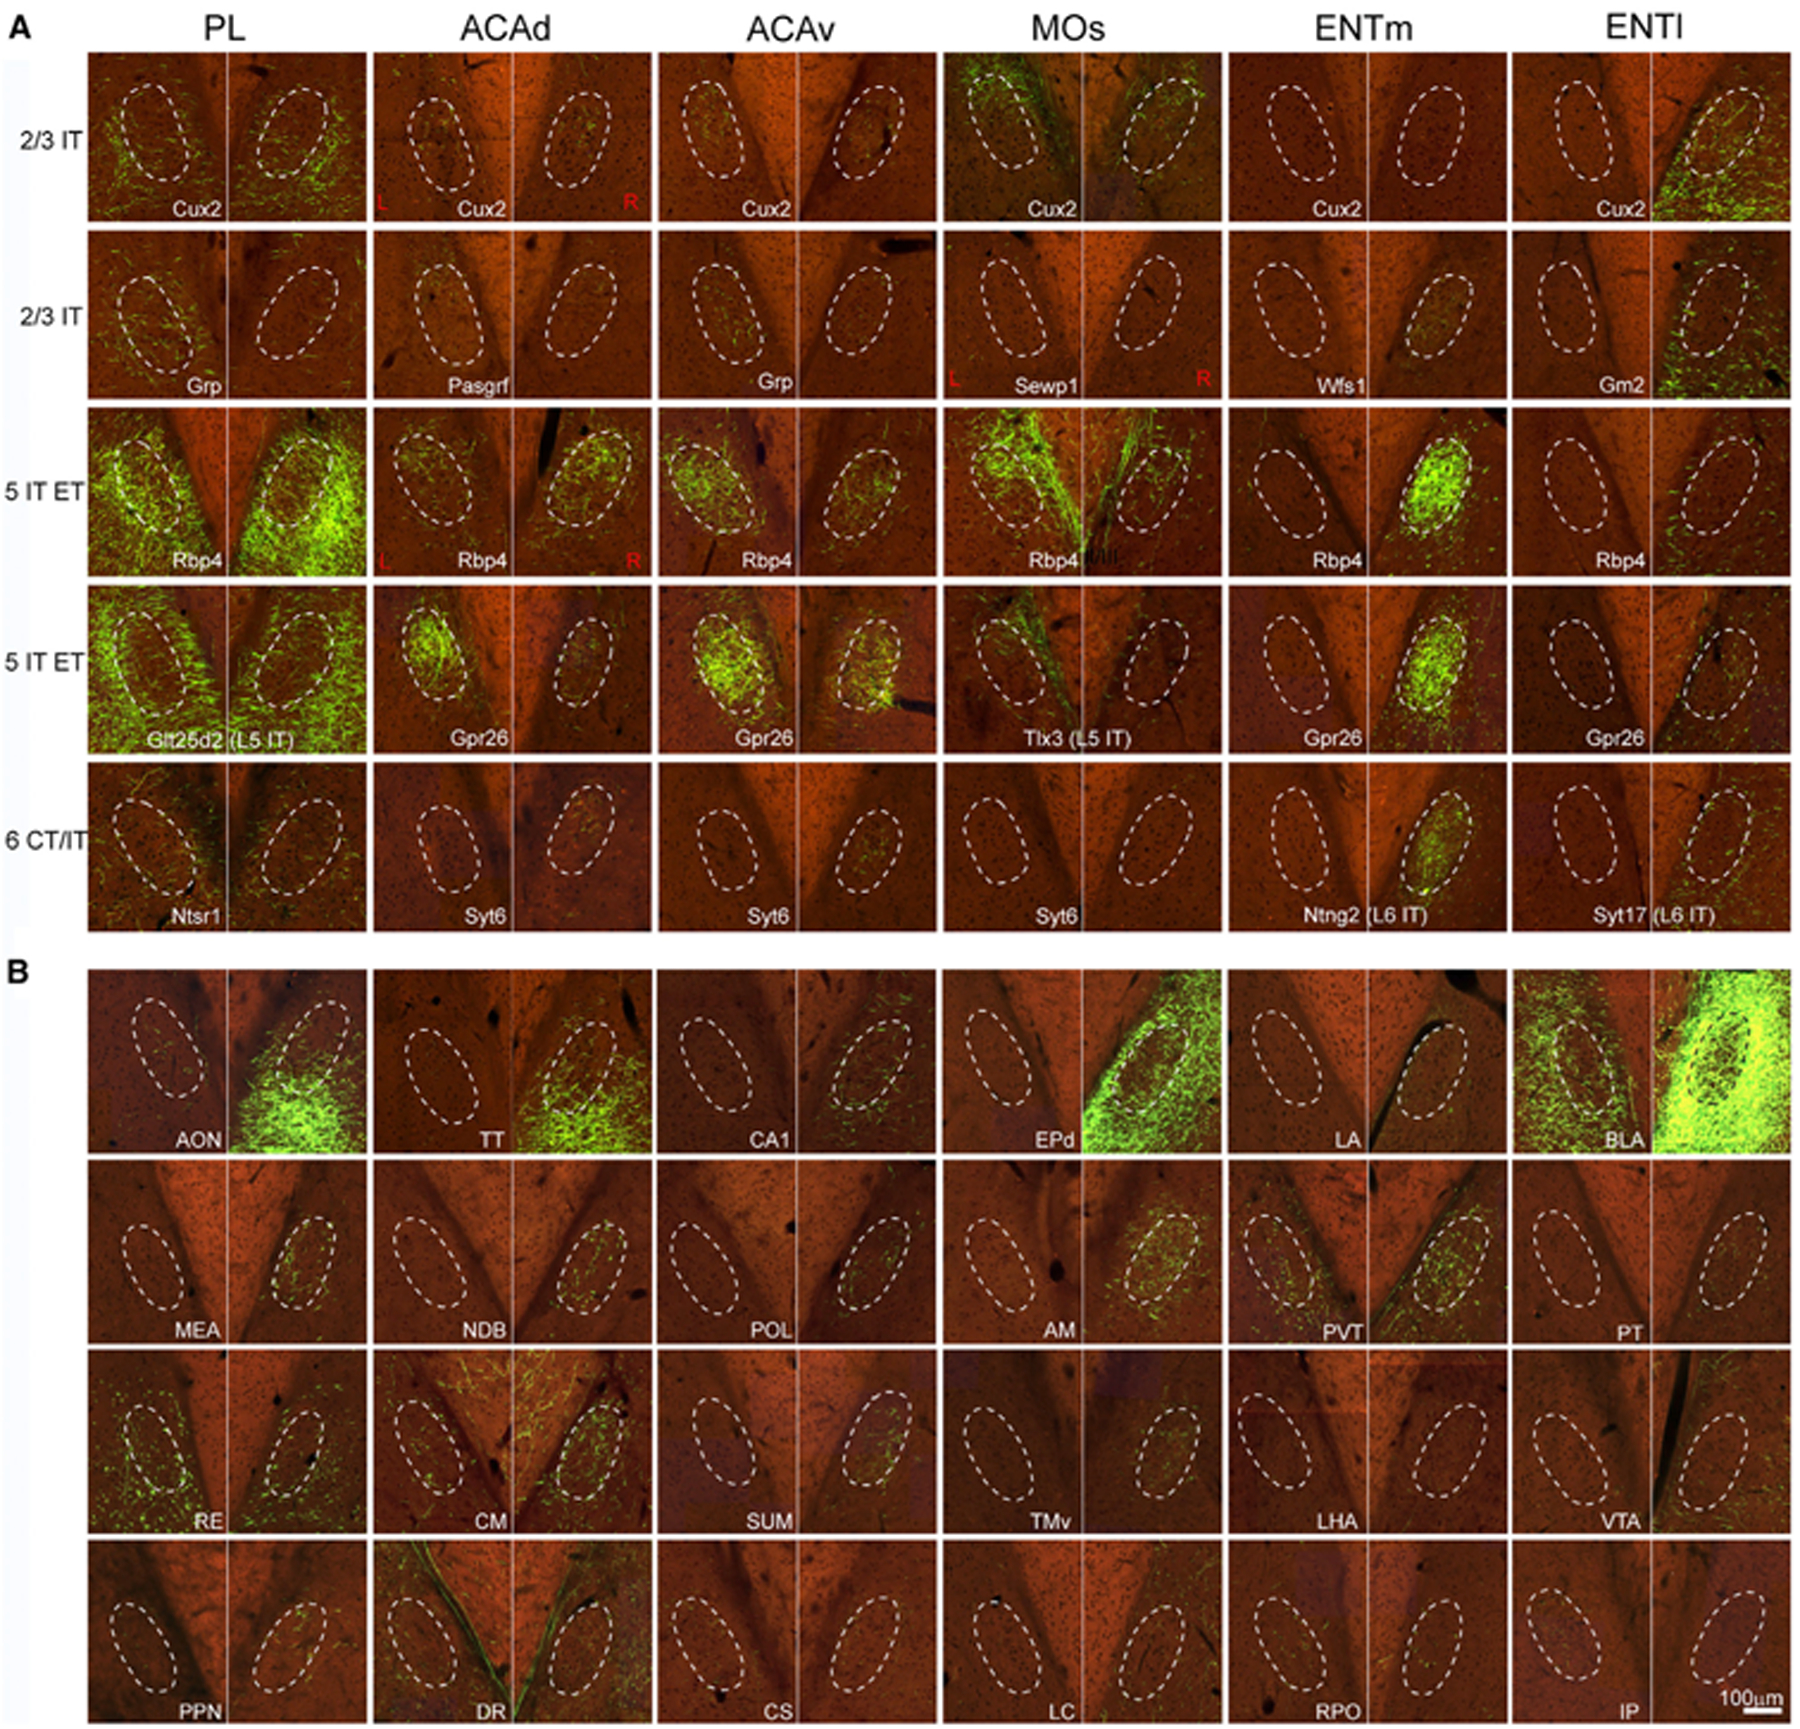
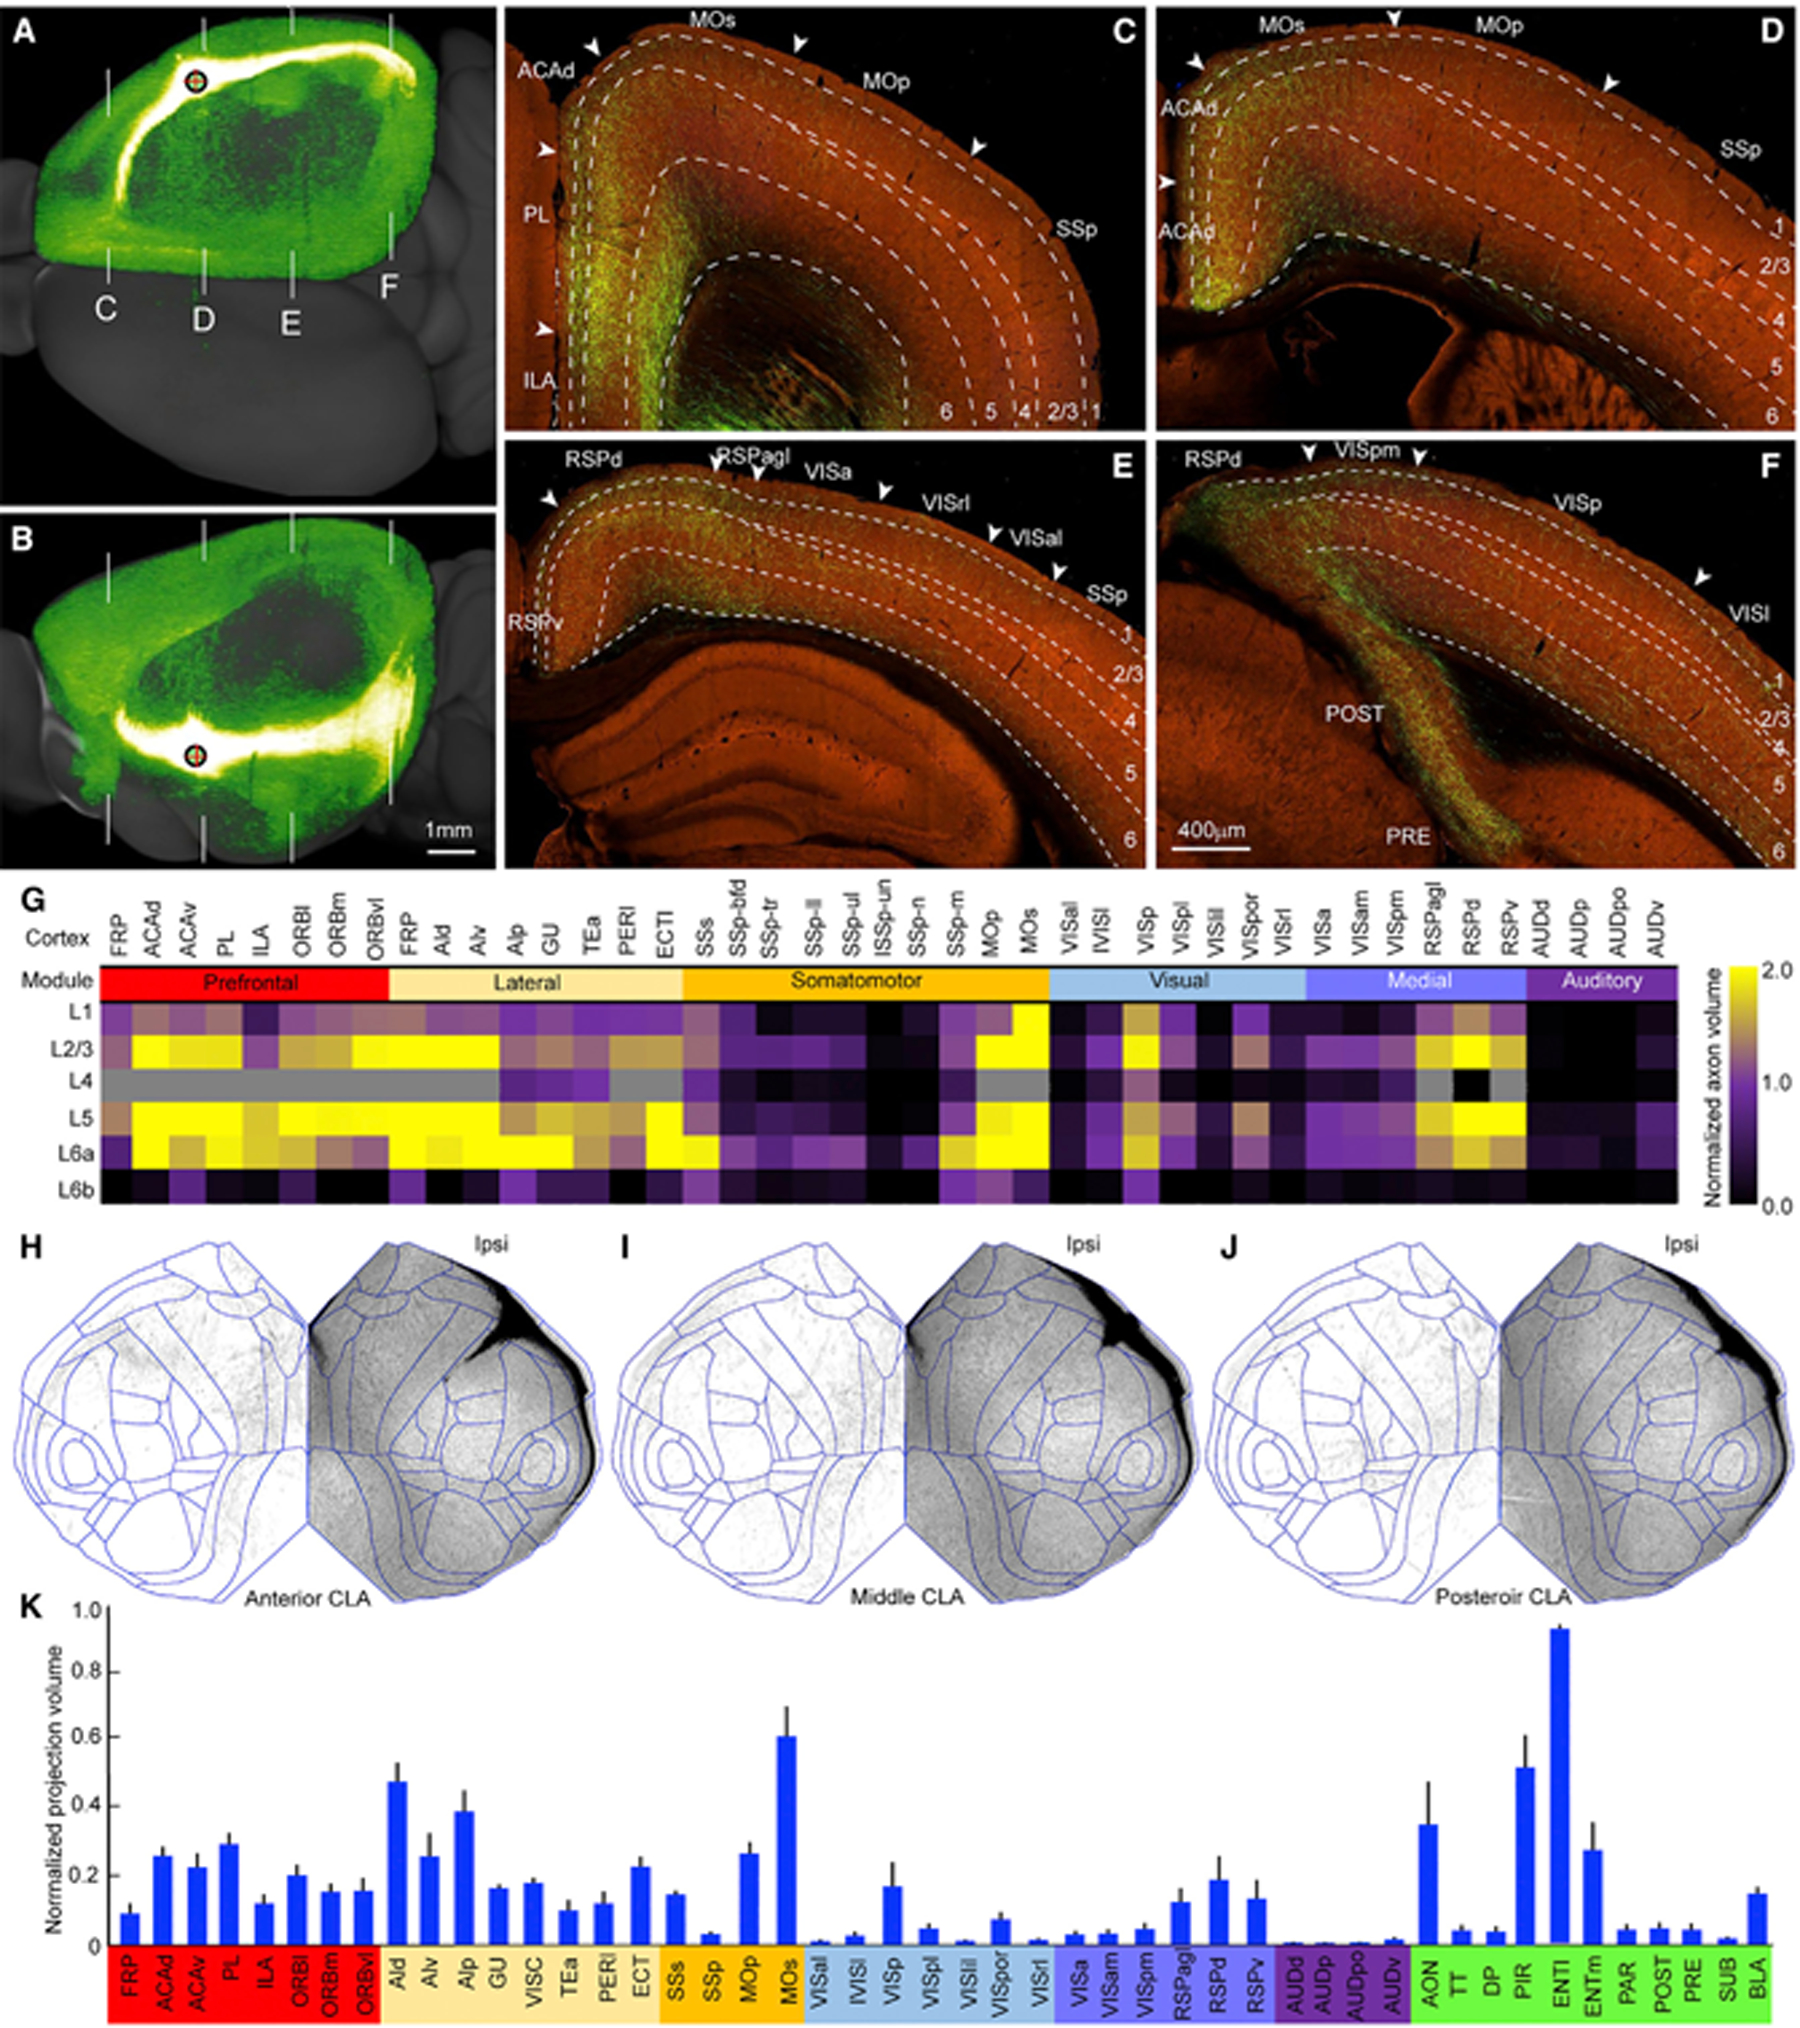
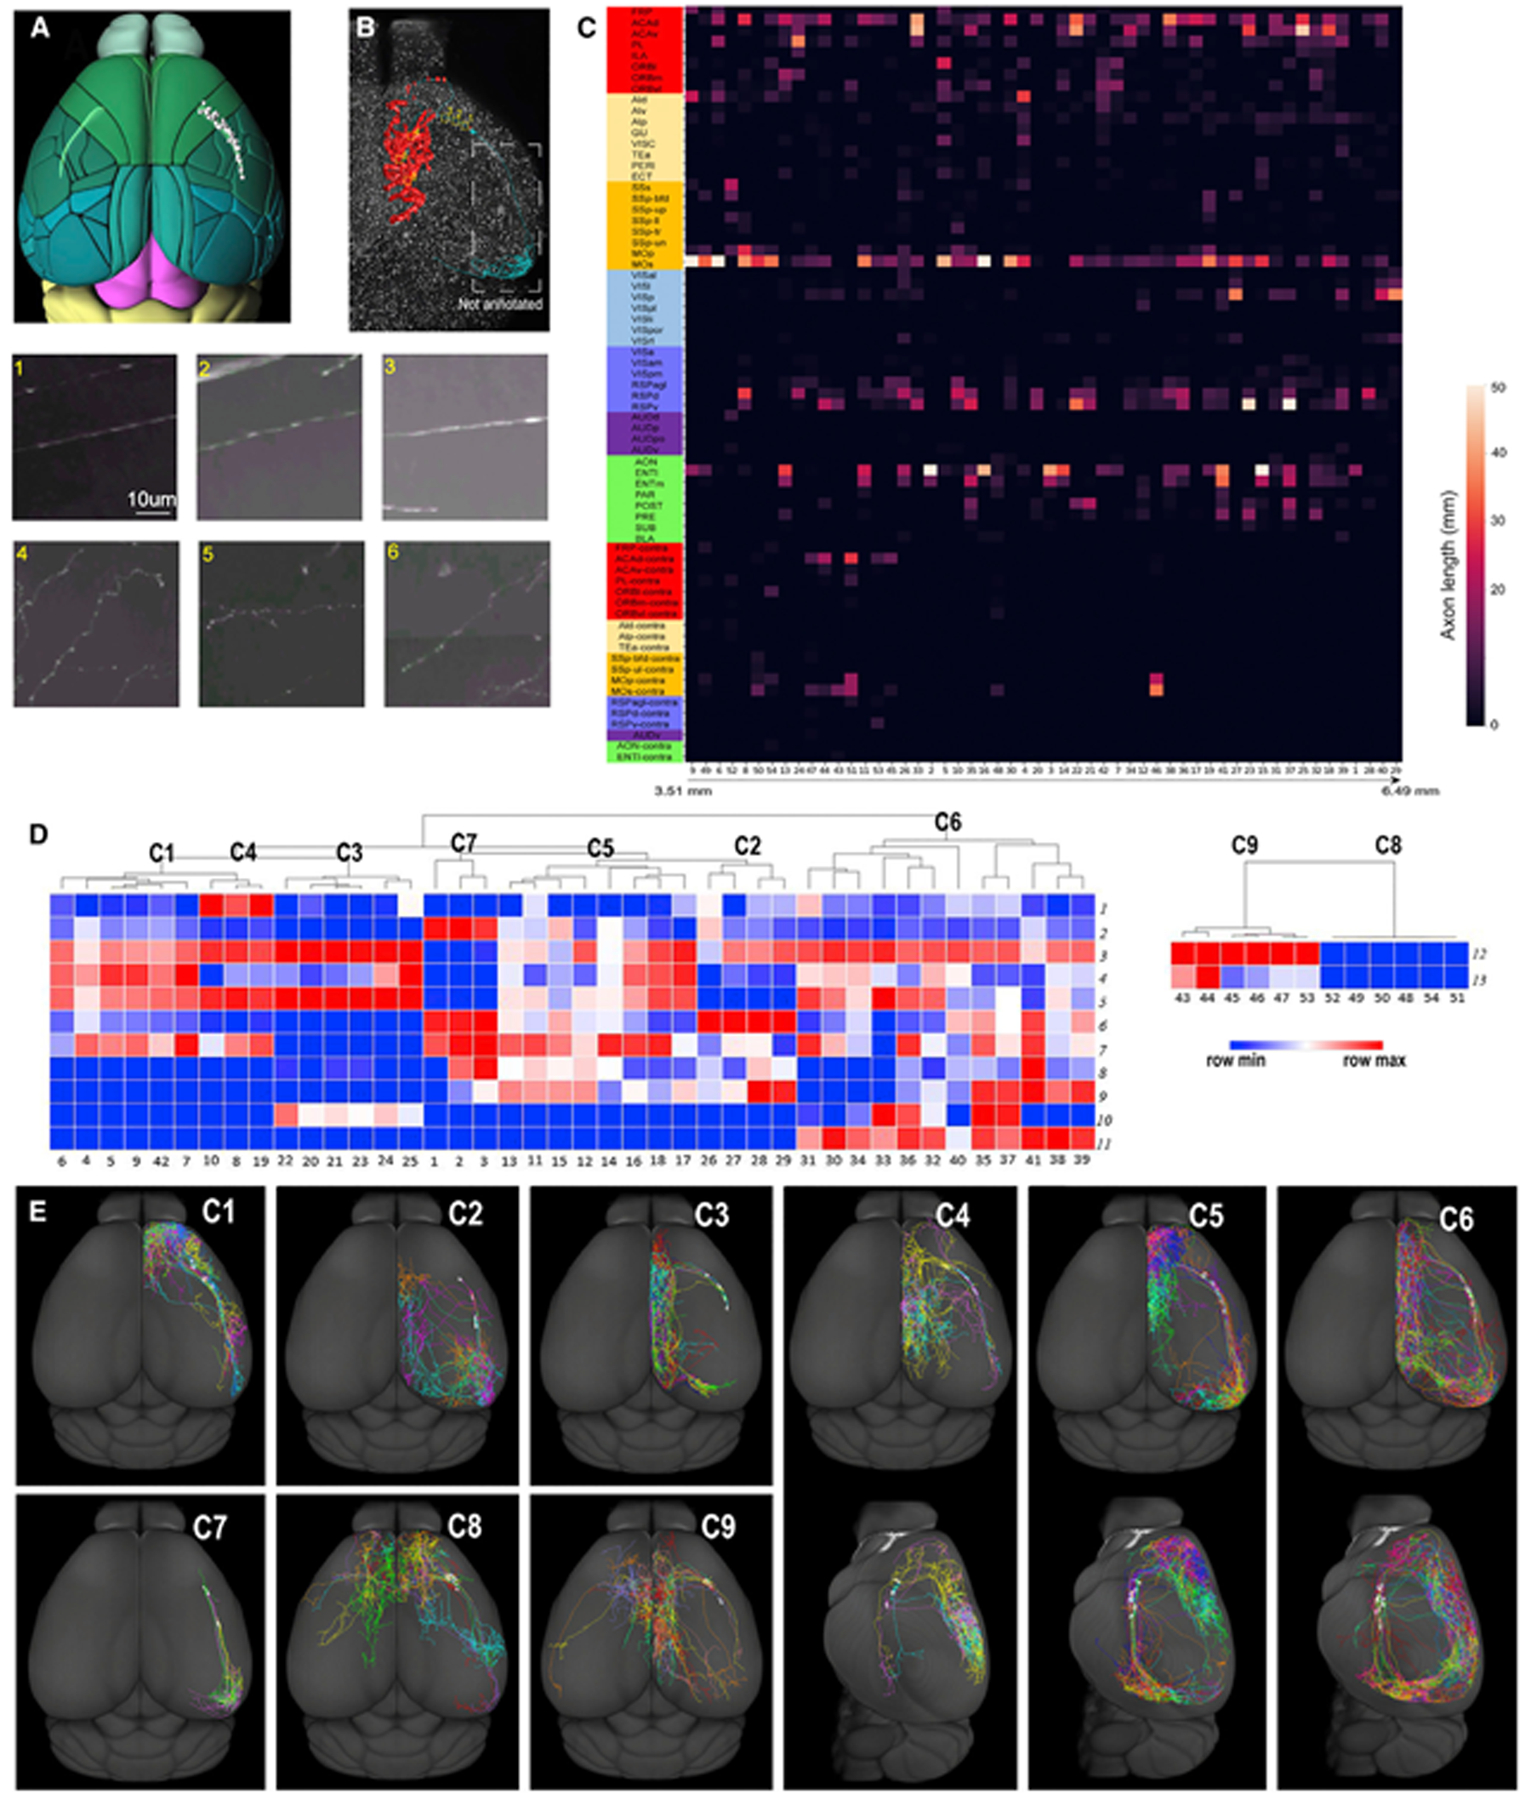
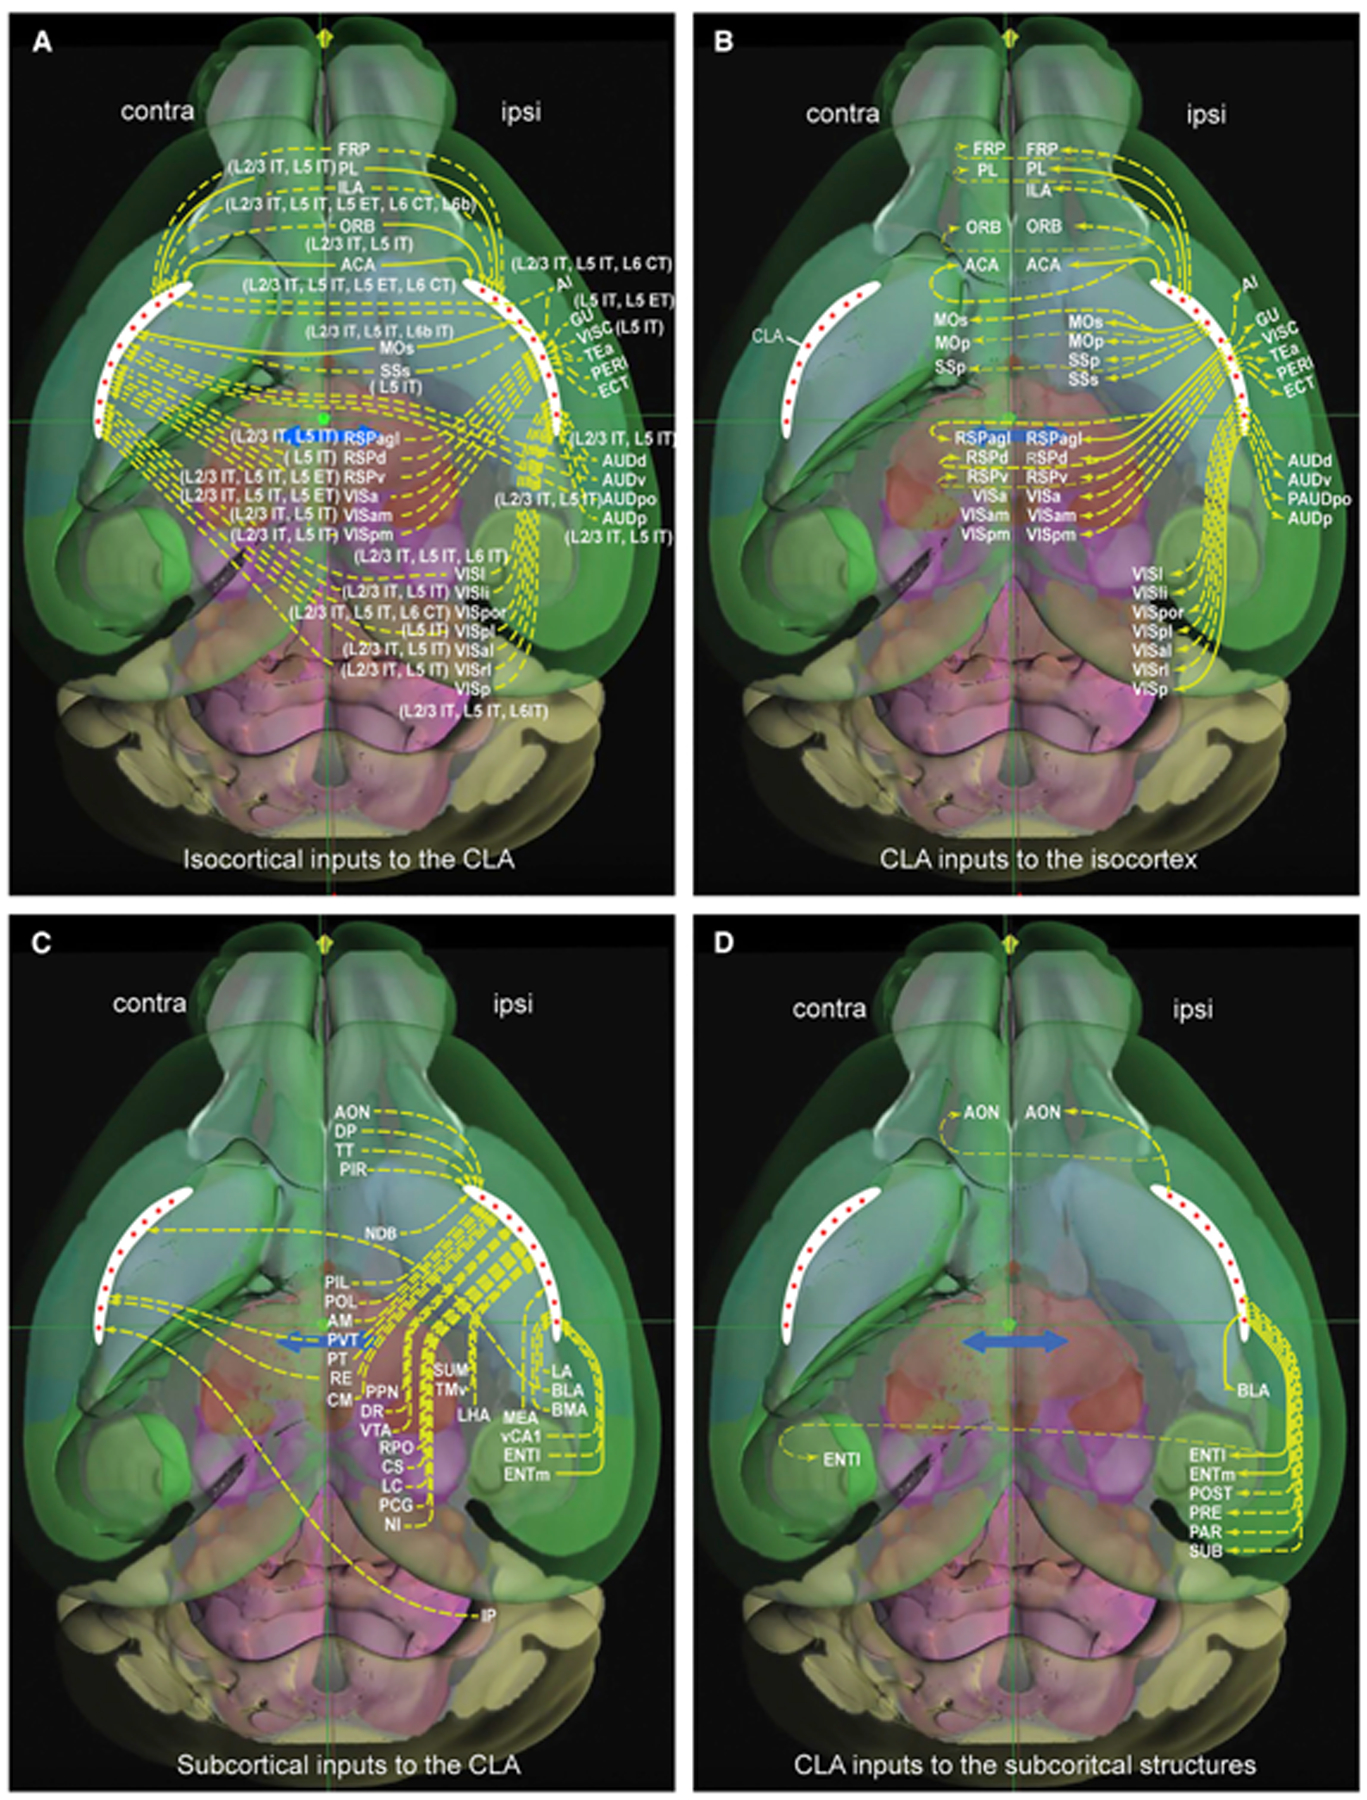
The claustrum (CLA) is a conspicuous subcortical structure interconnected with cortical and subcortical regions. Its regional anatomy and cell-type-specific connections in the mouse remain not fully determined. Using multimodal reference datasets, we confirmed the delineation of the mouse CLA as a single group of neurons embedded in the agranular insular cortex. We quantitatively investigated brain-wide inputs and outputs of CLA using bulk anterograde and retrograde viral tracing data and single neuron tracing data. We found that the prefrontal module has more cell types projecting to the CLA than other cortical modules, with layer 5 IT neurons predominating. We found nine morphological types of CLA principal neurons that topographically innervate functionally linked cortical targets, preferentially the midline cortical areas, secondary motor area, and entorhinal area. Together, this study provides a detailed wiring diagram of the cell-type-specific connections of the mouse CLA, laying a foundation for studying its functions at the cellular level.

Keywords: AAV; CP: Neuroscience; anterograde tracing; cell type; claustrum; isocortex; mouse; rabies virus; retrograde tracing; single neuron reconstruction.


Conflict of interest statement

Declaration of interests The authors declare no competing interests.

Figures

Figure 1.
Figure 1.. Delineation of the boundary of the mouse CLA
(A) The CLA is a densely packed group of neurons with heavy Nissl stain. (B) The CLA is a densely packed group of neurons (in red) in Rorb-IRES2-Cre mouse.. (C) The CLA is a densely packed group of neurons immunostained with antibody against NeuN (in red) and is surrounded by myelin fibers immunostained with antibody against NF-160 (in green). (D) The CLA is surrounded by myelin fibers immunostained with antibody against SMI-99 (in red). A subset of GABAergic neurons (in green) is labeled with immunostaining against calcium-binding protein calbindin (Calb1). (E–H) Four transgenic lines, Esr2-IRES2-Cre. (E), Gnb4-IRES2-CreERT2 (F), Tacr1-T2A-Cre (G), and Grp-Cre (H), have enriched gene expression in the CLA. (I–L) Four transgenic lines, Htr1a-IRES2-Cre (I), Dig-Cre_KG118 (J), Fezf2-CreER (K), and Calb2-IRES-Cre (L), have enriched gene expression in GU, AI, and EPd. Scale bars, 200 μm. Dashed line indicates the boundary of CLA in (A)–(L). Arrowhead indicates the border between cortical areas in (A)–(L). Numbers represent cortical layers in (A)–(D). For abbreviations, see Table S1. See also Figures S1 and S2.
Figure 2.
Figure 2.. Whole-brain presynaptic inputs to the CLA revealed with retrograde rabies tracing
(A) Red and dark green dots indicate Cre-dependent retrograde rabies and anterograde AAV injection sites, respectively. The curved light green objects represent CLA in the left and right hemispheres. The numbers are experiment IDs. The circled injections are shown as examples in (G)–(I) and Figure 5H–5J. (B) One representative example of retrograde rabies injection sites in coronal view at low magnification. Scale bar, 1 mm. (C) An enlargement of the boxed area in (B). Neurons were infected with the AAV helper virus (in red) and with rabies virus (in green). Arrowheads indicate starter cells (in yellow). The dashed line indicates the border of CLA. Scale bar, 200 μm. (D) Presynaptic neurons (in green) to the CLA in the dorsal view. “Ipsi,” ipsilateral to the injection site (same in G–I). (E) A fraction of whole-brain presynaptic input to the CLA from 12 major brain divisions (n = 5). (F) Flatmap showing all isocortical areas on the left side and six cortical modules color-coded differently on the right. A, anterior; P, posterior; M, medial; L, lateral. (G–I) Flatmaps reveal similar presynaptic labeling patterns across 3 CLA injections, arranged from anterior (G), middle (H), to posterior (I). Each black dot in the flatmap represents a presynaptic neuron. (J) Bar graph showing a fraction of total presynaptic labeling for each of the brain structures normalized by starter cells and structural volume. Blue and pink bars represent presynaptic labeling in the ipsilateral and contralateral hemispheres, respectively. Data are represented as mean ± SD (n = 5). (K) Quantitative analysis shows the laminar origin of cortical presynaptic neurons to the CLA (n = 5). Six cortical modules are color-coded differently. Cortical areas that do not have L4 in CCFv3 are color-coded in gray in the matrix. The color scale bar presents the range between 0 and 1. For abbreviations see Table S1. See also Table S2.
Figure 3.
Figure 3.. Cortical and subcortical presynaptic inputs to the CLA
(A–F) Examples of presynaptic neurons in prefrontal (A and B), lateral (C and D), parietal (E), and occipital (F) cortices. Green dots are nuclear EGFP-labeled presynaptic neurons. Dashed lines indicate the borders of cortical layers and CLA. Arrowheads indicate the borders between cortical areas. Scale bar, 400 μm. (G–R) Examples of presynaptic neurons labeled in other main brain regions outside isocortex are shown at high magnification, including AON (G) of the olfactory areas; ventral CA1 (H) of the hippocampal formation; CLA and EPd (I) and LA and BLA (J) of the cortical subplate; NDB (K) of the pallidum; PVT, CM, RE, and AM (L) and POL and PIL (M) of the thalamus; SUM (N) of the hypothalamus; DR (O) and CS (P) of the midbrain; LC (Q) of the pons; and IP (R) of the cerebellum. Scale bar, 200 μm. For abbreviations, see Table S1.
Figure 4.
Figure 4.. Anterograde AAV tracing reveals inputs to the CLA from cortex and subcortex
(A) Examples showing axons in the CLA and its adjacent structures from injections into cell-type-specific transgenic lines for L2/3 IT, L5 IT, L5 IT ET, L6 IT, and L6 CT of cortical areas PL, ACAd, ACAv, MOs, ENTm, and ENTl. Dashed line represents the border of the CLA (same in B). Red L (left) and R (right) indicate injection sites on the left side of the brain and the rest of these injections are on the right side. Scale bar, 100 μm. (B) Examples showing axons in the CLA and its adjacent structures with anterograde injections into 24 subcortical structures. Scale bar, 100 μm. For abbreviations, see Table S1. See also Figures S3 and S4 and Table S3.
Figure 5.
Figure 5.. Efferent projections of the CLA revealed with bulk anterograde Cre-dependent AAV tracing
(A and B) A representative example of bulk anterograde Cre-dependent AAV injections into the CLA showing strong projections to the midline and association cortical areas in the dorsal (A) and lateral (B) views. Red cross inside a black circle represents injection site. White lines in (A) and (B) indicate coronal section levels shown in (C)–(F). Scale bar, 1 mm. (C–F) High-power images showing axons in different cortical areas at the frontal (C), parietal (D and E), and occipital (F) levels. Arrowhead indicates the border between cortical areas. Dashed lines indicate the borders of cortical layers. For abbreviations see Table S1. Scale bar, 400 μm. (G) Quantitative analysis of normalized axon volumes showing laminar distributions of claustro-cortical projections in different ipsilateral cortical areas on the basis of five injections. The color scale bar shows the range (0–2) of averaged axon projection volumes. (H–J) Flatmaps of the isocortex showing similar claustro-cortical projection patterns from three anterograde Cre-dependent AAV injections. “Ipsi,” ipsilateral to the injection site. (K) Bar graph showing the normalized axon volumes in the ipsilateral isocortical and subcortical structures by injection sites (n = 5 injections). Data are represented as mean ± SD. For abbreviations, see Table S1. See also Table S3.
Figure 6.
Figure 6.. Diverse cell types of CLA principal neurons revealed by single neuron reconstruction
(A) Soma locations of individual principal neurons (gray balls) within the CLA (in light green) shown in the dorsal view. (B) A representative example of synaptic bouton distribution of individual principal neurons shown in the dorsal view. Manually plotted synaptic boutons are marked (in red) in the midline cortical areas, but they are not plotted in the entorhinal cortex (in cyan). The insets (1–6) in (B) are enlarged under (A) and (B). Insets 1, 2, and 3 show axon shafts without bouton-like enlargements within the CLA, and insets 4, 5, and 6 show axonal arbors bearing synaptic bouton-like enlargements in the targets. Scale bar, 10 μm. (C) Matrix showing the total lengths of axons of individual principal neurons in their targets. Along the x axis, the reconstructed neurons are arranged on the basis of their soma locations from rostral (3.51 mm measured from the very front of the main olfactory bulb (MOB) to caudal (6.49 mm from MOB). The y axis shows projections in target regions. For abbreviations, see Table S1. (D) Seven clusters of ipsilaterally projecting neurons in the dendrogram on the left and 2 clusters of the bilaterally projecting neurons on the right. The numbers on the x axis are the IDs of individual neurons. The numbers on the y axis represent the morphological features. (E) CLA neuron projections in C1–C3 and C7–C9 shown in the dorsal view and in C4–C6 shown in the dorsal and lateral views. Individual CLA principal neurons in each cluster are color-coded differently. See also Figure S6 and Table S4.
Figure 7.
Figure 7.. A wiring diagram of cell-type-specific input and output connections of the mouse CLA
(A and B) Cortical cell-type-specific inputs to the CLA (A) and CLA outputs to isocortex (B). The CLA (in white) is an anteroposterior elongated and curved strip in each hemisphere. Red stars in the CLA represent principal neurons. These are the same in (C) and (D). Solid and dashed arrows represent strong and weak projections, respectively. Major brain divisions seen through the transparent cortex are represented by different background colors. (C and D) Subcortical structures send inputs to bilateral, ipsilateral, or contralateral CLA (C), and the CLA sends outputs to some structures ipsilaterally or bilaterally (D).

Similar articles

Cited by

References

    1. Bruguier H, Suarez R, Manger P, Hoerder-Suabedissen A, Shelton AM, Oliver DK, Packer AM, Ferran JL, García-Moreno F, Puelles L, and Molnár Z (2020). In search of common developmental and evolutionary origin of the claustrum and subplate. J. Comp. Neurol. 528, 2956–2977. 10.1002/cne.24922. - DOI - PubMed
    1. Norimoto H, Fenk LA, Li HH, Tosches MA, Gallego-Flores T, Hain D, Reiter S, Kobayashi R, Macias A, Arends A, et al. (2020). A claustrum in reptiles and its role in slow-wave sleep. Nature 578, 413–418. 10.1038/s41586-020-1993-6. - DOI - PubMed
    1. Hain D, Gallego-Flores T, Klinkmann M, Macias A, Ciirdaeva E, Arends A, Thum C, Tushev G, Kretschmer F, Tosches MA, and Laurent G (2022). Molecular diversity and evolution of neuron types in the amniote brain. Science 377, eabp8202. 10.1126/science.abp8202. - DOI - PubMed
    1. Torgerson CM, Irimia A, Goh SYM, and Van Horn JD (2015). The DTI connectivity of the human claustrum. Hum. Brain Mapp. 36, 827–838. 10.1002/hbm.22667. - DOI - PMC - PubMed
    1. Wang Q, Ng L, Harris JA, Feng D, Li Y, Royall JJ, Oh SW, Bernard A, Sunkin SM, Koch C, and Zeng H (2017). Organization of the connections between claustrum and cortex in the mouse. J. Comp. Neurol. 525, 1317–1346. 10.1002/cne.24047. - DOI - PMC - PubMed

Publication types

LinkOut - more resources