. 2023 Apr:60:102628.
doi: 10.1016/j.redox.2023.102628. Epub 2023 Feb 6.

MARS2 drives metabolic switch of non-small-cell lung cancer cells via interaction with MCU

Affiliations

MARS2 drives metabolic switch of non-small-cell lung cancer cells via interaction with MCU

Juhyeon Son et al. Redox Biol. 2023 Apr.

Abstract

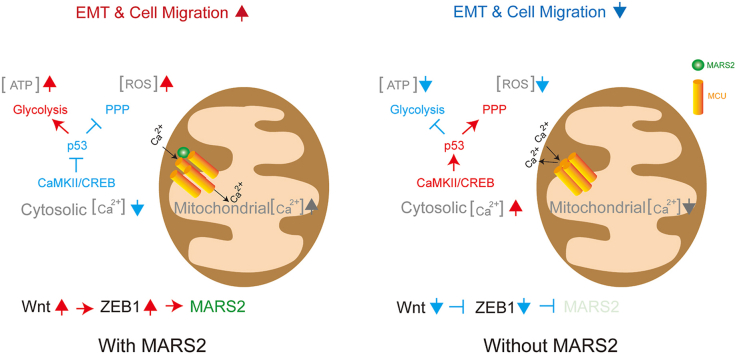
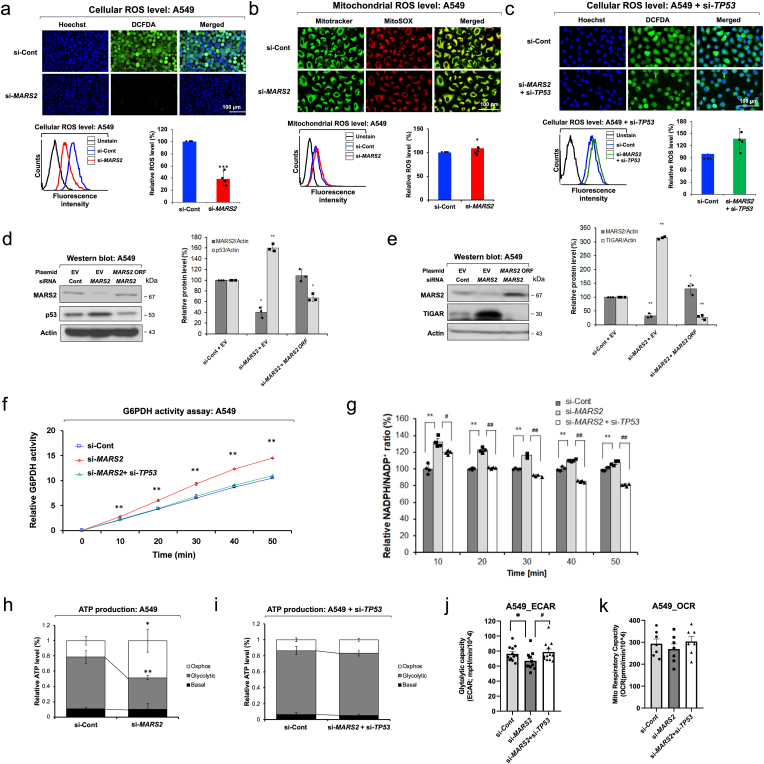
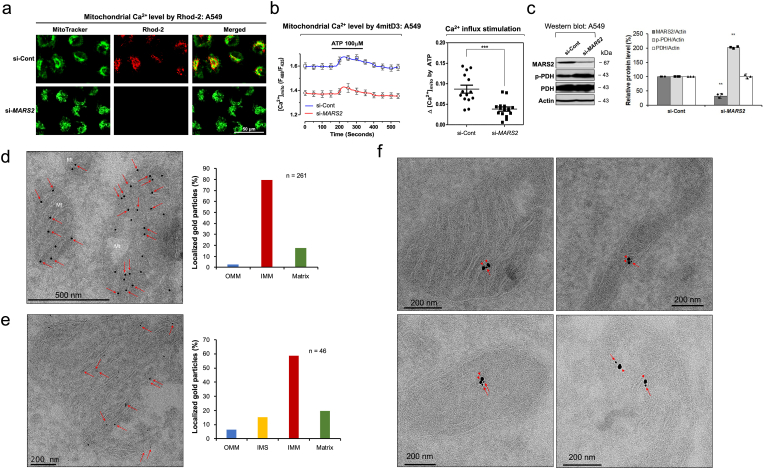
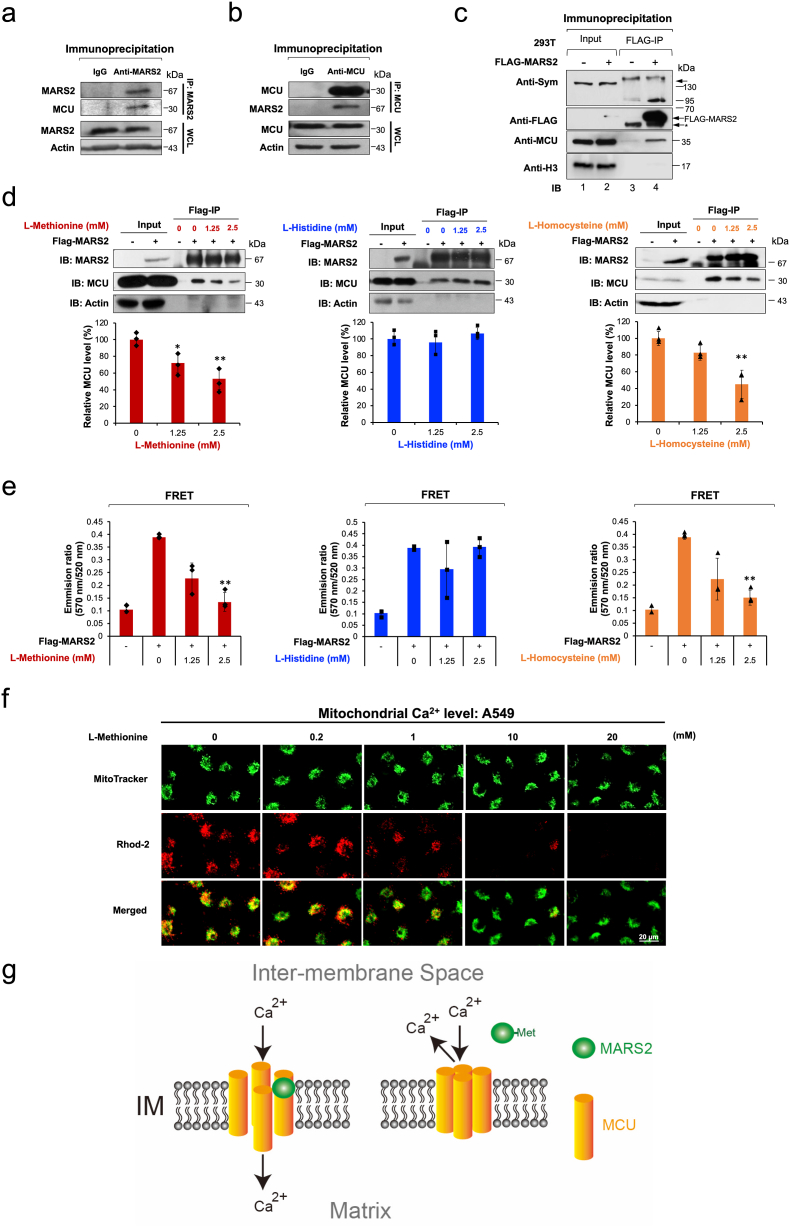
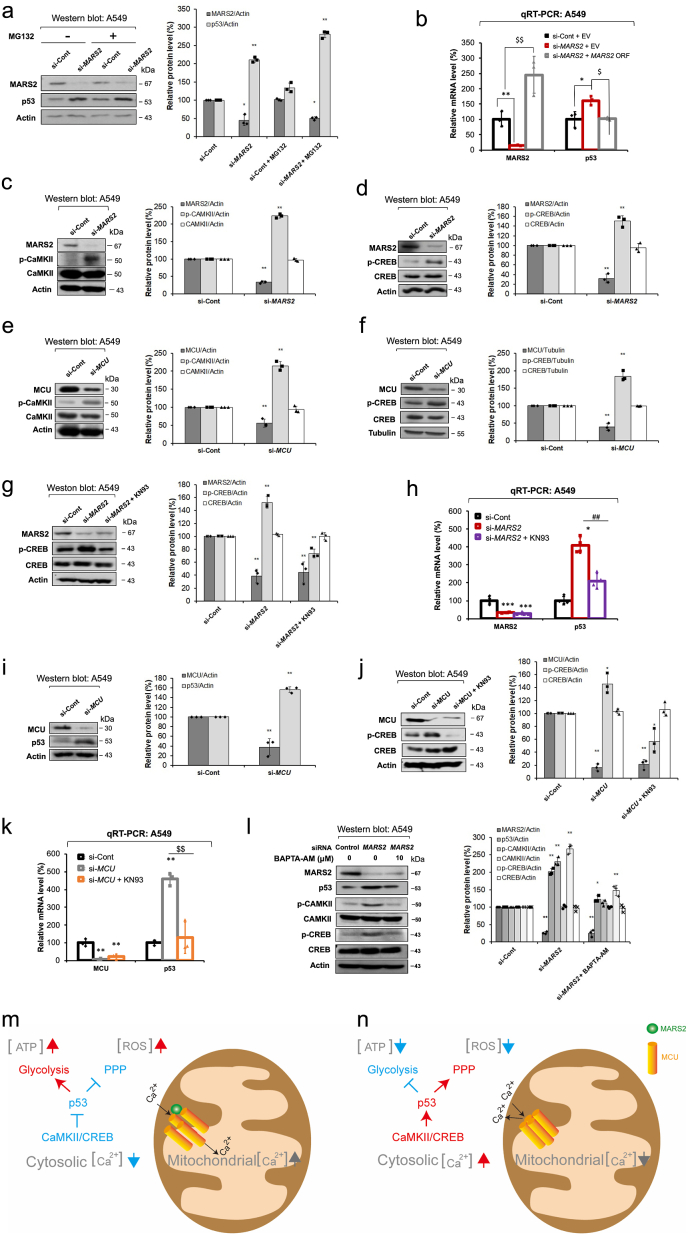
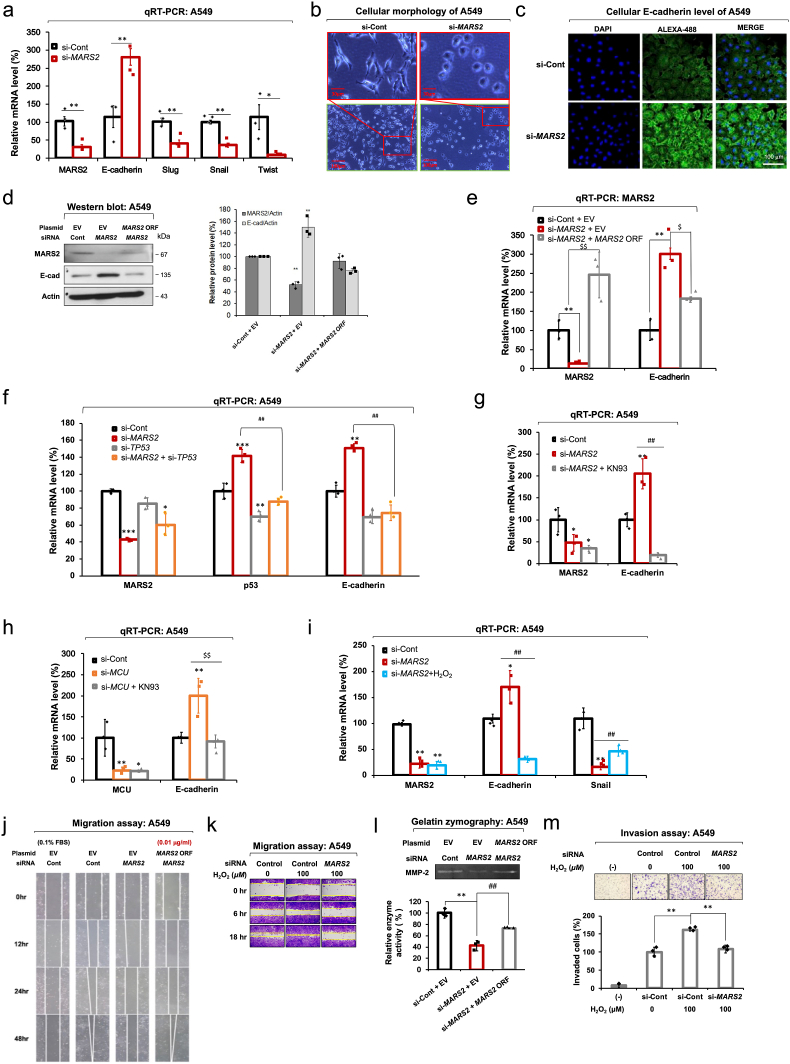
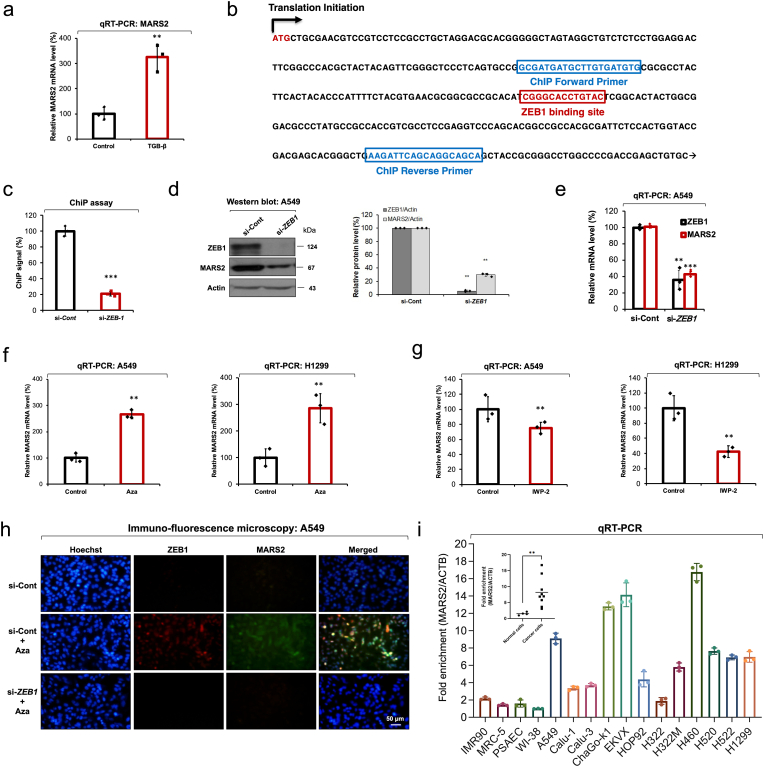
Mitochondrial methionyl-tRNA synthetase (MARS2) canonically mediates the formation of fMet-tRNAifMet for mitochondrial translation initiation. Mitochondrial calcium uniporter (MCU) is a major gate of Ca2+ flux from cytosol into the mitochondrial matrix. We found that MARS2 interacts with MCU and stimulates mitochondrial Ca2+ influx. Methionine binding to MARS2 would act as a molecular switch that regulates MARS2-MCU interaction. Endogenous knockdown of MARS2 attenuates mitochondrial Ca2+ influx and induces p53 upregulation through the Ca2+-dependent CaMKII/CREB signaling. Subsequently, metabolic rewiring from glycolysis into pentose phosphate pathway is triggered and cellular reactive oxygen species level decreases. This metabolic switch induces inhibition of epithelial-mesenchymal transition (EMT) via cellular redox regulation. Expression of MARS2 is regulated by ZEB1 transcription factor in response to Wnt signaling. Our results suggest the mechanisms of mitochondrial Ca2+ uptake and metabolic control of cancer that are exerted by the key factors of the mitochondrial translational machinery and Ca2+ homeostasis.

Keywords: Cancer metabolism; Epithelial-mesenchymal transition; Mitochondrial calcium uniporter; Mitochondrial methionyl-tRNA synthetase; Reactive oxygen species; p53.


Conflict of interest statement

Declaration of competing interest The authors declare no conflict of interest.

Figures

Image 1
Graphical abstract
Fig. 1
Fig. 1
MARS2 regulates cellular redox state via p53. a. Cellular ROS level was analyzed by DCF-DA confocal microscopy and flow cytometry assay upon MARS2 knockdown in A549 non-small cell lung cancer (NSCLC) cells (n = 5). si-Cont indicates si-control RNA. b. Mitochondrial ROS level was analyzed by MitoSox confocal microscopy and flow cytometry assay upon MARS2 knockdown in A549 cells (n = 5). c. Cellular ROS level was analyzed by DCF-DA confocal microscopy and flow cytometry assay of A549 cells upon MARS2 knockdown and TP53 double knockdowns (n = 5). d. Western blot analysis of p53 protein level upon MARS2 knockdown and a rescue assay with exogenous MARS2 expression in A549 cells (n = 3). e. Western blot analysis of TIGAR protein level upon MARS2 knockdown and a rescue assay with exogenous MARS2 expression in A549 cells (n = 3). f. G6PDH activity assay of A549 cells upon MARS2 knockdown and double knockdowns of MARS2 and TP53 (n = 3). g. NADPH assay of A549 cells upon MARS2 knockdown and double knockdowns of MARS2 and TP53 (n = 4). h. ATP production profile of A549 NSCLC cells upon MARS2 knockdown was indicated by the ratio of glycolytic ATP production level, mitochondrial ATP production level (OXPHOS) and basal level (n = 5). i. ATP production profile of A549 NSCLC cells upon MARS2 and TP53 double knockdowns was indicated by the ratio of glycolytic ATP production level, mitochondrial ATP production level (OXPHOS) and basal level (n = 5). j. Extracellular acidification rate (ECAR) with MARS2 knockdown and double knockdowns of MARS2 + TP53 in A549 cells (n = 10). k. Oxygen consumption rate (OCR) with MARS2 knockdown and MARS2 + TP53 double knockdowns in A549 cells (n = 7). All the quantitative data in graphs are marked as the mean ± S.D from at least three independent samples. Statistical analyses of results were performed with Student's t-test or ANOVA followed by Tukey's test (*, P < 0.05, **, P < 0.01, ***, P < 0.001, #, P < 0.05 versus si-MARS2, ##, P < 0.01 versus si-MARS2).
Fig. 2
Fig. 2
MARS2 regulates mitochondrial Ca2+influx and co-localizes with MCU. a. Mitochondrial Ca2+ level was visualized by confocal microscopy using Rhod-2 upon MARS2 knockdown in A549 cells (n = 5). si-Cont indicates si-control RNA. b. Mitochondrial matrix Ca2+ level was measured using FRET-based cameleon protein probe 4mitD3, which allows ratiometric recording of emitted fluorescence from YFP (540 nm) and CFP (490 nm), in A549 cells upon MARS2 knockdown (left) (n = 15). Stimulation of mitochondrial Ca2+ uptake induced by ATP (100 μM) was measured upon MARS2 knockdown in A549 cells (right) (n = 15). c. Western blot analysis of PDH activation (p-PDH: inactive form of PDH), which indicates Ca2+ level in mitochondrial matrix, in A549 cells upon MARS2 knockdown (n = 3). d. Cryo-immunogold electron microscopy of A549 cells was performed. Arrows indicate the gold particles (Diameter = 10 nm) which represent the localizations of MARS2 at inner-mitochondrial membrane (IMM) (left). Localization of each mitochondrial gold particle (n = 261) was determined and plotted its respective localization (OMM: outer mitochondrial membrane) (right). Dots indicate the gold particles which represent the localizations of MARS2. Arrows indicate the MARS2s at IMM. e. Cryo-immunogold electron microscopy of A549 cells was performed using smaller gold particles (Diameter = 1.4 nm). Arrows indicate the MARS2s at IMM (left). Localization of each mitochondrial gold particle (n = 46) was determined and plotted its respective localization (IMS: inter-membrane space) (right). f. Cryo-immunogold microscopy with double labeling using two distinct gold particles of 1.4 nm (Arrow for MARS2) and 10 nm (Arrowhead for MCU) of diameters (n = 19). All the quantitative data in graphs are marked as the mean ± S.D from at least three independent samples. Statistical analysis of results was performed with Student's t-test (***, P < 0.001).
Fig. 3
Fig. 3
MARS2 binds to MCU. a. MARS2-MCU interaction was analyzed by endogenous IP assay using anti-MARS2 antibody in A549 cells (n = 3). b. MARS2-MCU interaction was analyzed by endogenous IP assay using anti-MCU antibody in A549 cells (n = 3). c. Exogenous IP assay was performed to evaluate MARS2-MCU interaction on HEK293 cells expressing FLAG-MARS2 fusion protein (n = 3). Western blot was performed with anti-MCU antibody. d. MARS2-MCU interaction was evaluated by exogenous IP analysis on HEK293 cells expressing FLAG-MARS2 fusion protein in the presence of increasing amount of l-Methionine, l-histidine, and l-homocysteine (0, 1.25 and 2.5 mM), respectively (left, middle and right). Western blot analyses were performed with anti-MCU antibody and the band intensities of MCU were quantitated and presented in graph (n = 3). e. MARS2-MCU interaction were evaluated by exogenous IP analysis on HEK293 cells expressing FLAG-MARS2 fusion protein in the presence of increasing amount of l-Methionine, l-Histidine, and l-Homocysteine (0, 1.25 and 2.5 mM), respectively (left, middle and right). FRET between MARS2-Alexa Fluor 488 and MCU-Alexa Fluor 555 was measured and presented in graph (n = 3). f. Mitochondrial Ca2+ level was visualized by confocal microscopy using Rhod-2 with the treatment of increasing dosages of l-Methionine (0, 0.2, 1, 2, 10 and 20 mM) in A549 cells (n = 6). g. Model for the mitochondrial Ca2+ influx control. Without methionine, MARS2 binds to MCU with allowing Ca2+ influx into mitochondrial matrix. Methionine-MARS2 binding induces dissociation of MARS2 from MCU blocks calcium influx into mitochondrial matrix. All the quantitative data in graphs are marked as the mean ± S.D from at least three independent samples. Statistical analyses of results were performed with ANOVA followed by Tukey's test. (*, P < 0.05, **, P < 0.01).
Fig. 4
Fig. 4
MARS2 regulates p53 via CaMKII/CREB signaling. a. Western blot analysis of p53 protein level in A549 cells upon MARS2 knockdown with or without MG132 proteasome inhibitor (10 μM for 2 h) (n = 3). si-Cont indicates si-control RNA. b. Transcriptional expression level of p53 was evaluated by qRT-PCR with MARS2 knockdown and a rescue assay was performed with exogenous MARS2 expression in A549 cells (n = 9). c. Western blot analysis of CaMKII activation (p-CaMKII: active form of CaMKII) in A549 cells upon MARS2 knockdown (n = 3). d. Western blot analysis of CREB activation (p-CREB: active form of CREB) in A549 cells upon MARS2 knockdown (n = 3). e. Western blot analysis of CaMKII activation in A549 cells upon MCU knockdown (n = 3). f. Western blot analysis of CREB activation in A549 cells upon MCU knockdown (n = 3). g. Western blot analysis of CREB activation of A549 cells upon MARS2 knockdown and MARS2 knockdown + CaMKII inhibitor KN93 (10 μM for 6 h) (n = 3). h. qRT-PCR analysis of transcriptional expressions of p53 in A549 cells upon MARS2 knockdown and MARS2 knockdown + KN93 (n = 9). i. Western blot analysis of p53 level in A549 cells upon MCU knockdown (n = 3). j. Western blot analysis of CREB activation of A549 cells upon MCU knockdown and MCU knockdown + CaMKII inhibitor KN93 (10 μM for 6 h) (n = 3). k. qRT-PCR analysis of transcriptional expressions of p53 in A549 cells upon MCU knockdown and MARS2 knockdown + KN93 (n = 9). l. Effect of cytosolic Ca2+ downregulation using Ca2+ chelator BAPTA-AM (10 μM for 4 h) on CaMKII/CREB activation and p53 level was investigated by western blot analysis (n = 3). m. Model for the metabolic switch induced via CaMKII/CREB/p53 cascade by mitochondrial Ca2+ control of MARS2-MCU interaction. When MARS2 binds to MCU, MCU Ca2+ channel is activated to allow Ca2+ flux from cytosol into mitochondrial matrix. As a result, mitochondrial Ca2+ level increases and cytosolic Ca2+ decreases. Subsequently, p53 level decreases via CaMKII/CREB inactivation. Finally, metabolic switch from PPP into glycolysis inhibits PPP leading to ROS upregulation and promotes glycolytic ATP production. n. Without MARS2, MCU Ca2+ channel is inactivated to block Ca2+ flux from cytosol into mitochondrial matrix. As a result, mitochondrial Ca2+ level decreases and cytosolic Ca2+ increases. Subsequently, p53 level increases via CaMKII/CREB activation. Finally, metabolic switch from glycolysis into PPP inhibits glycolytic ATP production and promotes PPP leading to ROS downregulation. All the quantitative data in graphs are marked as the mean ± S.D from at least three independent samples. Statistical analyses of results were performed with ANOVA followed by Tukey's test. (*, P < 0.05, **, P < 0.01, ***, P < 0.001, ##, P < 0.01 versus si-MARS2, $$, P < 0.01 versus si-MCU).
Fig. 5
Fig. 5
MARS2 regulates EMT via redox regulation. a. Transcriptional expressions of EMT markers (E-cadherin, Slug, Snail and Twist) were evaluated by qRT-PCR upon MARS2 knockdown in A549 cells. si-Cont indicates si-control RNA (n = 9). b. Morphological change of TGF-β-induced A549 cells upon MARS2 knockdown (n = 3). c. Confocal microscopic image of E-cadherin level in A549 cells upon MARS2 knockdown (n = 3). d. Cellular E-cadherin level was checked by western blot analysis upon MARS2 knockdown, and a rescue assay was performed with exogenous MARS2 expression in A549 cells (n = 3). e. Transcriptional expression of E-cadherin was evaluated by qRT-PCR upon MARS2 knockdown, and a rescue assay was performed with exogenous MARS2 expression in A549 cells (n = 9). f. qRT-PCR of transcriptional expressions of p53 and E-cadherin in A549 cells upon MARS2 knockdown, TP53 knockdown and double knockdowns of MARS2 and TP53 (n = 9). g. qRT-PCR analysis of transcriptional expressions of E-cadherin in A549 cells upon MARS2 knockdown and MARS2 knockdown + KN93 (n = 9). h. qRT-PCR analysis of transcriptional expressions of E-cadherin in A549 cells upon MCU knockdown and MCU knockdown + KN93 (n = 9). i. Transcriptional expressions of MARS2, E-cadherin and Snail were evaluated by qRT-PCR with MARS2 knockdown and MARS2 knockdown + H2O2 (100 μM for 24 h) in A549 cells (n = 9). j. Effect of MARS2 knockdown on A549 cell migration was investigated by wound healing cell migration assay in A549 cells (n = 3). k. Wound-healing cell migration assay was performed with MARS2 knockdown in H2O2-treated A549 cells (n = 3). l. Activity of MMP-2 is related with MARS2 as evidenced by gelatin-zymography assay (n = 3). m. Invasive ability of H2O2-treated A549 cells was tested using Boyden chamber assay with MARS2 knockdown (n = 3). Media containing 0.1% FBS (−) were used as negative controls. All the quantitative data in graphs are marked as the mean ± S.D from at least three independent samples. Statistical analyses of results were performed with Student's t-test or ANOVA followed by Tukey's test. (*, P < 0.05, **, P < 0.01, ***, P < 0.001, ##, P < 0.01 versus si-MARS2, $$, P < 0.01 versus si-MCU).
Fig. 6
Fig. 6
MARS2 is regulated by ZEB1 in response to Wnt signaling. a. Transcriptional expression of MARS2 was checked by qRT-PCR after TGF-β treatment in A549 cells (n = 9). b. Design of ChIP primers flanking ZEB1 binding sites near the promoter region on MARS2 ORF. c. ChIP assay using ZEB1 ChIP primers on MARS2 gene (n = 6). si-Cont indicates si-control RNA. d. ZEB1 regulation on MARS2 was investigated using anti-ZEB1 siRNA by western blot analysis in A549 cells (n = 3). e. Transcriptional expressions of MARS2 and ZEB1 were analyzed by qRT-PCR upon ZEB1 knockdown using anti-ZEB1 siRNA in A549 cells (n = 9). f. Transcriptional expressions of MARS2 were analyzed by qRT-PCR with canonical Wnt activator 1-Azakenpaullone (Aza) treatment (10 μM for 24 h) in A549 and H1299 cells, respectively (n = 9). g. Transcriptional expressions of MARS2 were analyzed by qRT-PCR with canonical Wnt inhibitor IWP-2 treatment (30 μM for 24 h) in A549 and H1299 cells, respectively (n = 9). h. Wnt regulation on MARS2 expression was investigated with Aza and anti-ZEB1 siRNA treatments in A549 cells by immune-fluorescence microscopy (n = 3). i. Comparison of MARS2 expression levels in 4 normal lung cells (IMR90, MRC-5, primary small airway epithelial cells, and WI-38) and 12 lung cancer cell lines (A549, Calu-1, Calu-3, ChaGo-k1, EKVX, HOP92, H322, H322M, H460, H520, H522, H1299) (n = 3). All the quantitative data in graphs are marked as the mean ± S. D from at least three independent samples. Statistical analyses of results were performed with Student's t-test. (**, P < 0.01, ***, P < 0.001).

References

    1. Park S.G., Schimmel P., Kim S. Aminoacyl tRNA synthetases and their connections to disease. Proc. Natl. Acad. Sci. U.S.A. 2008;105(32):11043–11049. - PMC - PubMed
    1. Gomez M.A.R., Ibba M. Aminoacyl-tRNA synthetases. Cold Spring Harbor Laboratory Press for the RNA Society. 2020;26(8):910–936. - PMC - PubMed
    1. Konovalova S., Tyynismaa H. Mitochondrial aminoacyl-tRNA synthetases in human disease. Mol. Genet. Metabol. 2013;108(4):206–211. - PubMed
    1. Kwon N.H., et al. Dual role of methionyl-tRNA synthetase in the regulation of translation and tumor suppressor activity of aminoacyl-tRNA synthetase-interacting multifunctional protein-3. Proc. Natl. Acad. Sci. U. S. A. 2011;108(49):19635–19640. - PMC - PubMed
    1. Spencer A.C., et al. Characterization of the human mitochondrial methionyl-tRNA synthetase. Biochemistry. 2004;43(30):9743–9754. - PubMed

MeSH terms