. 2023 Mar:155:106618.
doi: 10.1016/j.compbiomed.2023.106618. Epub 2023 Feb 2.

Early computational detection of potential high-risk SARS-CoV-2 variants

Affiliations

Early computational detection of potential high-risk SARS-CoV-2 variants

Karim Beguir et al. Comput Biol Med. 2023 Mar.

Abstract

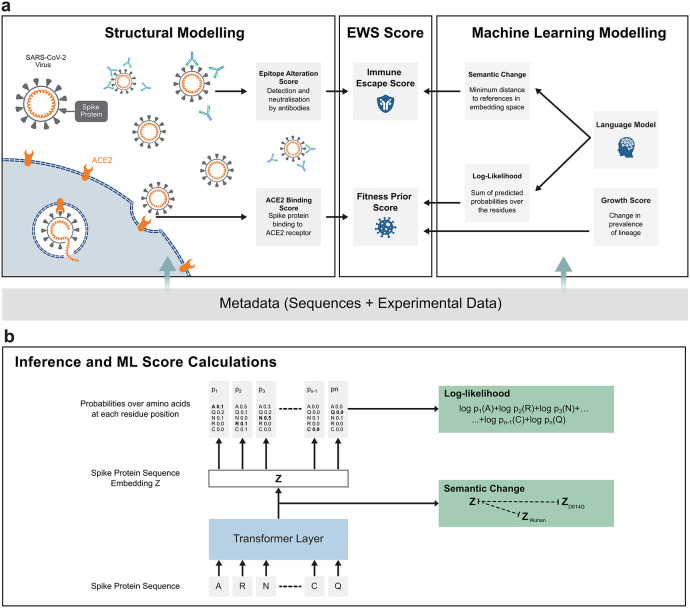
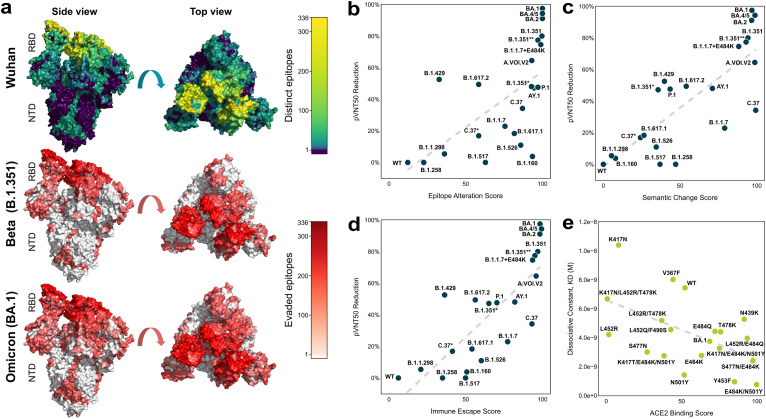
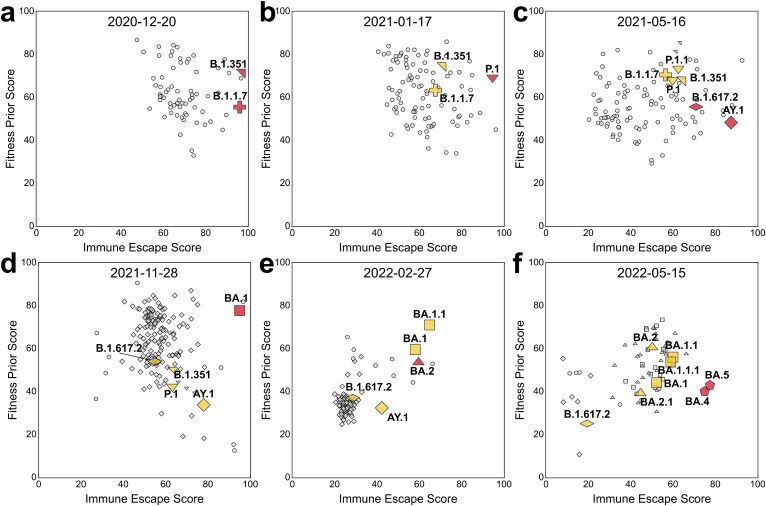
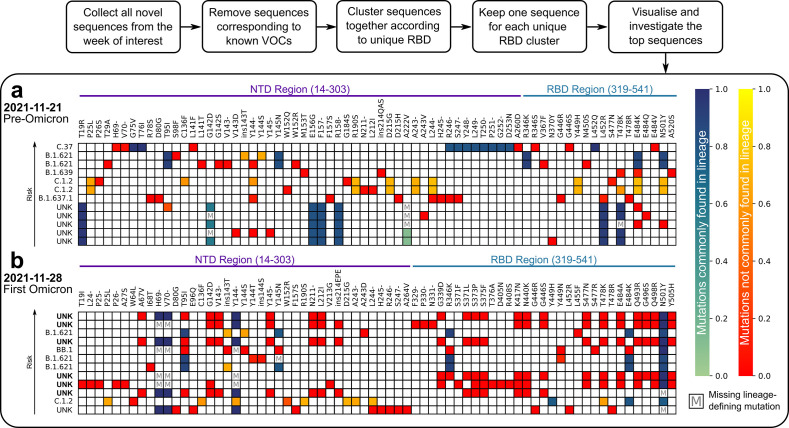
The ongoing COVID-19 pandemic is leading to the discovery of hundreds of novel SARS-CoV-2 variants daily. While most variants do not impact the course of the pandemic, some variants pose an increased risk when the acquired mutations allow better evasion of antibody neutralisation or increased transmissibility. Early detection of such high-risk variants (HRVs) is paramount for the proper management of the pandemic. However, experimental assays to determine immune evasion and transmissibility characteristics of new variants are resource-intensive and time-consuming, potentially leading to delays in appropriate responses by decision makers. Presented herein is a novel in silico approach combining spike (S) protein structure modelling and large protein transformer language models on S protein sequences to accurately rank SARS-CoV-2 variants for immune escape and fitness potential. Both metrics were experimentally validated using in vitro pseudovirus-based neutralisation test and binding assays and were subsequently combined to explore the changing landscape of the pandemic and to create an automated Early Warning System (EWS) capable of evaluating new variants in minutes and risk-monitoring variant lineages in near real-time. The system accurately pinpoints the putatively dangerous variants by selecting on average less than 0.3% of the novel variants each week. The EWS flagged all 16 variants designated by the World Health Organization (WHO) as variants of interest (VOIs) if applicable or variants of concern (VOCs) otherwise with an average lead time of more than one and a half months ahead of their designation as such.


Conflict of interest statement

Declaration of competing interest U.S. is a management board member and employee at BioNTech SE. A.M., B.G.L. and B.S. are employees at BioNTech SE. A.P. and Y.L. are employees at BioNTech US: U.S., A.M., Y.L., and A.P. are inventors on patents and patent applications related to RNA technology and/or the COVID-19 vaccine. U.S., A.M., B.G.L., and B.S. have securities from BioNTech SE. K.B. is a management board member and employee at InstaDeep Ltd. M.J.S., Y.F., T.P., N.L.C., A.L., I.K., A.K. and A.U.L. are employees of InstaDeep Ltd or its subsidiaries. K.B., M.J.S., Y.F., T.P., N.L.C., and A.L. are inventors of patents and patent applications related to machine learning technology. K.B., M.J.S., Y.F., T.P., N.L.C., and A.L. have securities from InstaDeep Ltd.

Figures

Fig. 1
Fig. 1
A schematic of the Early Warning System (EWS), a protocol for the analysis and early detection of high-risk SARS-CoV-2 variants. (a) Illustrated on the left-hand side, structural modelling was used to predict the binding affinity of the SARS-CoV-2 S protein to the host protein, ACE2, and to score the mutated epitope regarding its impact on immune escape. The right hand side panel represents the machine learning (ML)-based modelling that was used to extract implicit information from unlabeled data for the hundreds of thousands of registered variants in the GISAID [[1], [2], [3]] database. Looking at the middle panel, the EWS relies on the information from structural modelling and ML-based modelling to compute an immune escape score and a fitness prior score. (b) A schematic of the ML model structure for assessing semantic change and log-likelihood. Once trained (Fig. S1a), the model received a variant S protein sequence as input and returned an embedding vector of the S protein sequence as well as probabilities over amino acids for each residue position (Fig. S1b). The embedding vector was then used to calculate the semantic change from a set of reference variants while the probabilities were used to compute the log-likelihood (see Material and Methods).
Fig. 2
Fig. 2
In silico scores for immune escape and fitness prior correlate with in vitro data. (a) The surface of a SARS-CoV-2 spike (S) protein structure (PDB ID: 7KDL [28]). The top row structure is coloured by the frequency of contact of S protein surface residues with neutralising antibodies (brighter, warmer colour corresponds to more antibody binding). The middle and bottom rows depict the number of evaded epitopes in Beta (B.1.351) and Omicron (BA.1), respectively (red indicates a higher number). (bd) Relationships of the epitope alteration score, semantic change score, and combined immune escape score with the observed 50% pseudovirus neutralisation titer (pVNT50) reduction are shown across n = 21 selected SARS-CoV-2 S protein variants. The pVNT50 reduction compared to wild-type (WT) SARS-CoV-2 pseudovirus is given in percent. Variants for which pVNT50 values exceeded those against the wild-type variant were assigned a pVNT50 reduction of 0 (equal to wild-type). (e) Validation of the ACE2 binding score with the experimentally determined ACE2 binding affinity (KD, dissociation constant) are shown across n = 19 receptor-binding domain (RBD) variants, along with a fitted regression dashed line.
Fig. 3
Fig. 3
Combining immune escape and fitness prior for continuous monitoring of the SARS-CoV-2 variant landscape. Snapshot of lineages in terms of fitness prior and immune escape score on (a) December 20, 2020, (b) January 17, 2021, (c) May 16, 2021, (d) November 28, 2021, (e) February 27, 2022, and (f) May 15, 2022, corresponding to the week of the designations of Alpha/Beta, Gamma, Delta, Omicron BA.1, Omicron BA.2, Omicron BA.4 and Omicron BA.5 by the WHO as VOCs. Red markers indicate the designated lineages of the week, yellow markers are the previously designated lineages and grey markers indicate other lineages. Circles correspond to non-variant of concern (VOC) lineages and other symbols correspond to designated variants and their closely related lineages. The cross, north-east-pointing triangle, south-pointing triangle, flattened diamond, diamond, square, north-pointing triangle, and pentagon correspond to Alpha (B.1.1.7), Beta (B.1.351), Gamma (P.1), Delta (B.1.617.2, AY), Omicron BA.1, Omicron BA.2, and Omicron BA.4/BA.5 lineages, respectively. Lineages such as BA.4 and BA.5 with the same S protein sequence are indicated with the same shape. Only lineages that had been observed within the past 8 weeks relative to the indicated date for each plot and had been reported more than 10 times were included. See Fig. S9 for the corresponding density contour plots of sequences.
Fig. 4
Fig. 4
The EWS protocol for detection of high-risk variants (HRVs) and output heatmaps. A heatmap was constructed each week with the top selected sequences for the immune escape score resulting from the detection protocol outlined in the section Materials and Methods: Retrospective detection of HRVs. The two heatmaps shown here represent the top sequences resulting from this protocol from (a) the week just prior to the appearance of Omicron, November 21, 2021, and (b) the week of the appearance of Omicron, November 28, 2021. Each row represents a spike (S) protein sequence in decreasing order of immune escape score from top (highest score) to bottom (lower score). The label at the front of each row indicates either an associated, reported lineage or an unknown lineage (UNK). The UNK labels in bold in (b) indicate sequences that were later designated as belonging to Omicron. Sequences labelled with UNK were compared to the closest VOC lineage based on sequence similarity in order to distinguish common and uncommon mutations as indicated in the colourbars. All non-bolded UNK-labelled sequences in (a) and (b) were later designated to other lineages. Each column represents a mutation present in the S protein within the NTD and RBD regions indicated in purple and teal, respectively. The colour scale from green to blue represents lineage-defining mutations (defined by the WHO or inferred from mutation frequency) and the relative frequency of a mutation from 0.0 to 1.0 in the sequence population of the assigned lineage. The colour scale from red to yellow represents non-lineage-defining mutations and their frequency from 0.0 to 1.0 in the sequence population of the lineage. Boxes marked with an M indicate lineage-defining mutations that are missing from the corresponding sequence.
Fig. 5
Fig. 5
The EWS flags high-risk variants (HRVs) ahead of their WHO designation as either a variant of interest (VOI) or a variant of concern (VOC). (a) Each bar corresponds to a week and represents all novel, non-VOC spike (S) protein sequences. Each bar is split into 3 groups: sequences that will later be designated as either VOIs or VOC by the WHO (green), sequences that were labelled with unknown lineages that later will be designated as known VOIs or VOCs (grey) and other sequences (white). (b) The cumulative sum of all submissions to GISAID of a given variant lineage (in log scale) over time. Green and red dashed lines indicate the date of WHO designation as either a VOC or a VOI and the date of flagging as a HRV by the EWS, respectively.
Fig. 6
Fig. 6
Comparing detection of high-risk variants (HRVs) using different metrics and machine learning (ML)-based approaches. (a) Detection results using the Early Warning System (EWS) metrics, immune escape score, semantic change score, epitope alteration score, and growth score, compared to standard machine learning (ML) techniques: generalised linear model (GLM) and uniform manifold approximation and projection (UMAP). The left bar chart displays the percentage of variants detected ahead of their designation as either a VOC or VOI by the WHO, the centre bar chart displays the average precision in percent for each metric and the right bar chart displays the proportion of the weeks where the used metric achieves an enrichment greater than 1 (better than random). (b) Detection results with respect to the watch list size per week using immune escape score, semantic change score, epitope alteration score, growth score, GLM and UMAP. The markers correspond to 12 sequences per week, the size used in the EWS.

References

    1. Elbe S., Buckland-Merrett G. Data, disease and diplomacy: GISAID's innovative contribution to global health. Global Chall. 2017;1:33–46. doi: 10.1002/gch2.1018. - DOI - PMC - PubMed
    1. Shu Y., McCauley J. GISAID: global initiative on sharing all influenza data–from vision to reality. Euro Surveill. 2017;22:30494. - PMC - PubMed
    1. Khare S., et al. Gisaid's role in pandemic response. China CDC Wkly. 2021;3:1049–1051. doi: 10.46234/ccdcw2021.255. - DOI - PMC - PubMed
    1. Liu Y., et al. Neutralizing activity of BNT162b2-elicited serum. N. Engl. J. Med. 2021;384:1466–1468. doi: 10.1056/NEJMc2102017. - DOI - PMC - PubMed
    1. Twohig K.A., et al. Hospital admission and emergency care attendance risk for SARS-CoV-2 delta (B.1.617.2) compared with alpha (B.1.1.7) variants of concern: a cohort study. Lancet Infect. Dis. 2022;22:35–42. doi: 10.1016/S1473-3099(21)00475-8. - DOI - PMC - PubMed

Publication types

Supplementary concepts