. 2023 May;164(6):978-989.e6.
doi: 10.1053/j.gastro.2023.01.022. Epub 2023 Feb 10.

Increasing Pancreatic Cancer Incidence in Young Women in the United States: A Population-Based Time-Trend Analysis, 2001-2018

Affiliations

Increasing Pancreatic Cancer Incidence in Young Women in the United States: A Population-Based Time-Trend Analysis, 2001-2018

Yazan Abboud et al. Gastroenterology. 2023 May.

Abstract

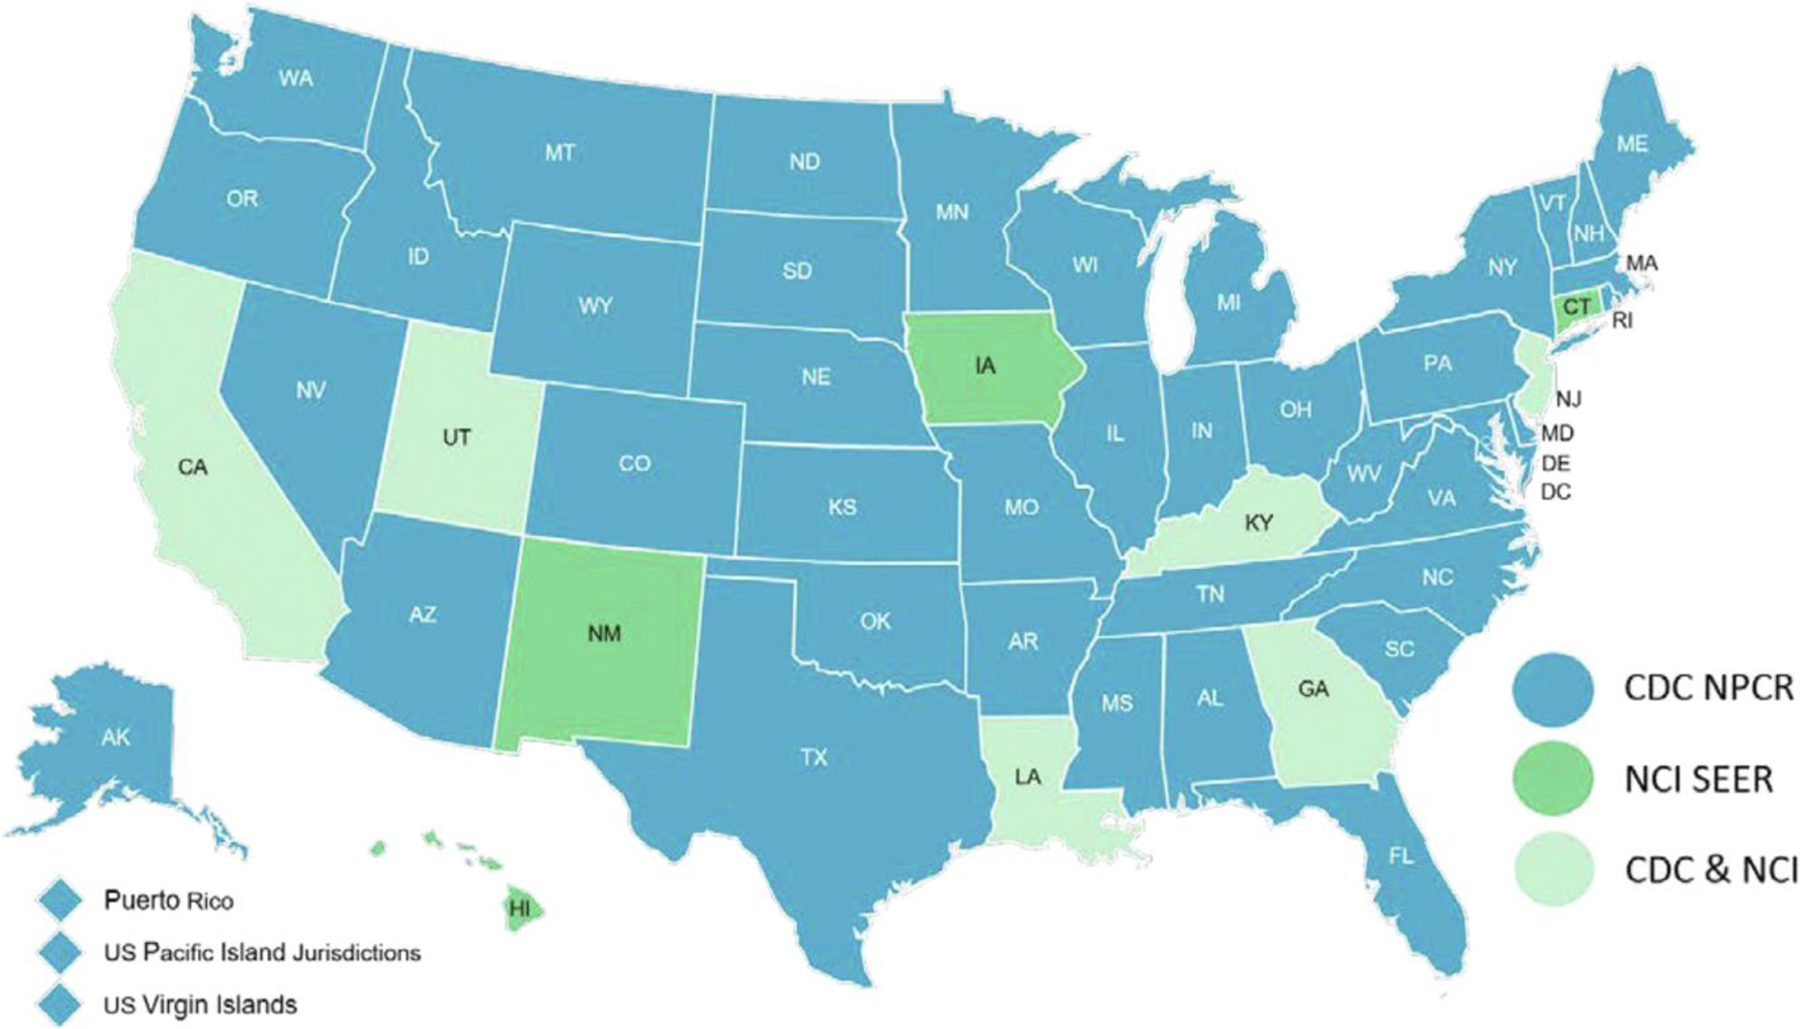
Background & aims: Previous studies have shown an increasing incidence of pancreatic cancer (PC), especially in younger women; however, this has not been externally validated. In addition, there are limited data about contributing factors to this trend. We report age and sex-specific time-trend analysis of PC age-adjusted incidence rates (aIRs) using the National Program of Cancer Registries database without Surveillance Epidemiology and End Results data.

Methods: PC aIR, mortality rates, annual percentage change, and average annual percentage change (AAPC) were calculated and assessed for parallelism and identicalness. Age-specific analyses were conducted in older (≥55 years) and younger (<55 years) adults. PC incidence based on demographics, tumor characteristics, and mortality were evaluated in younger adults.

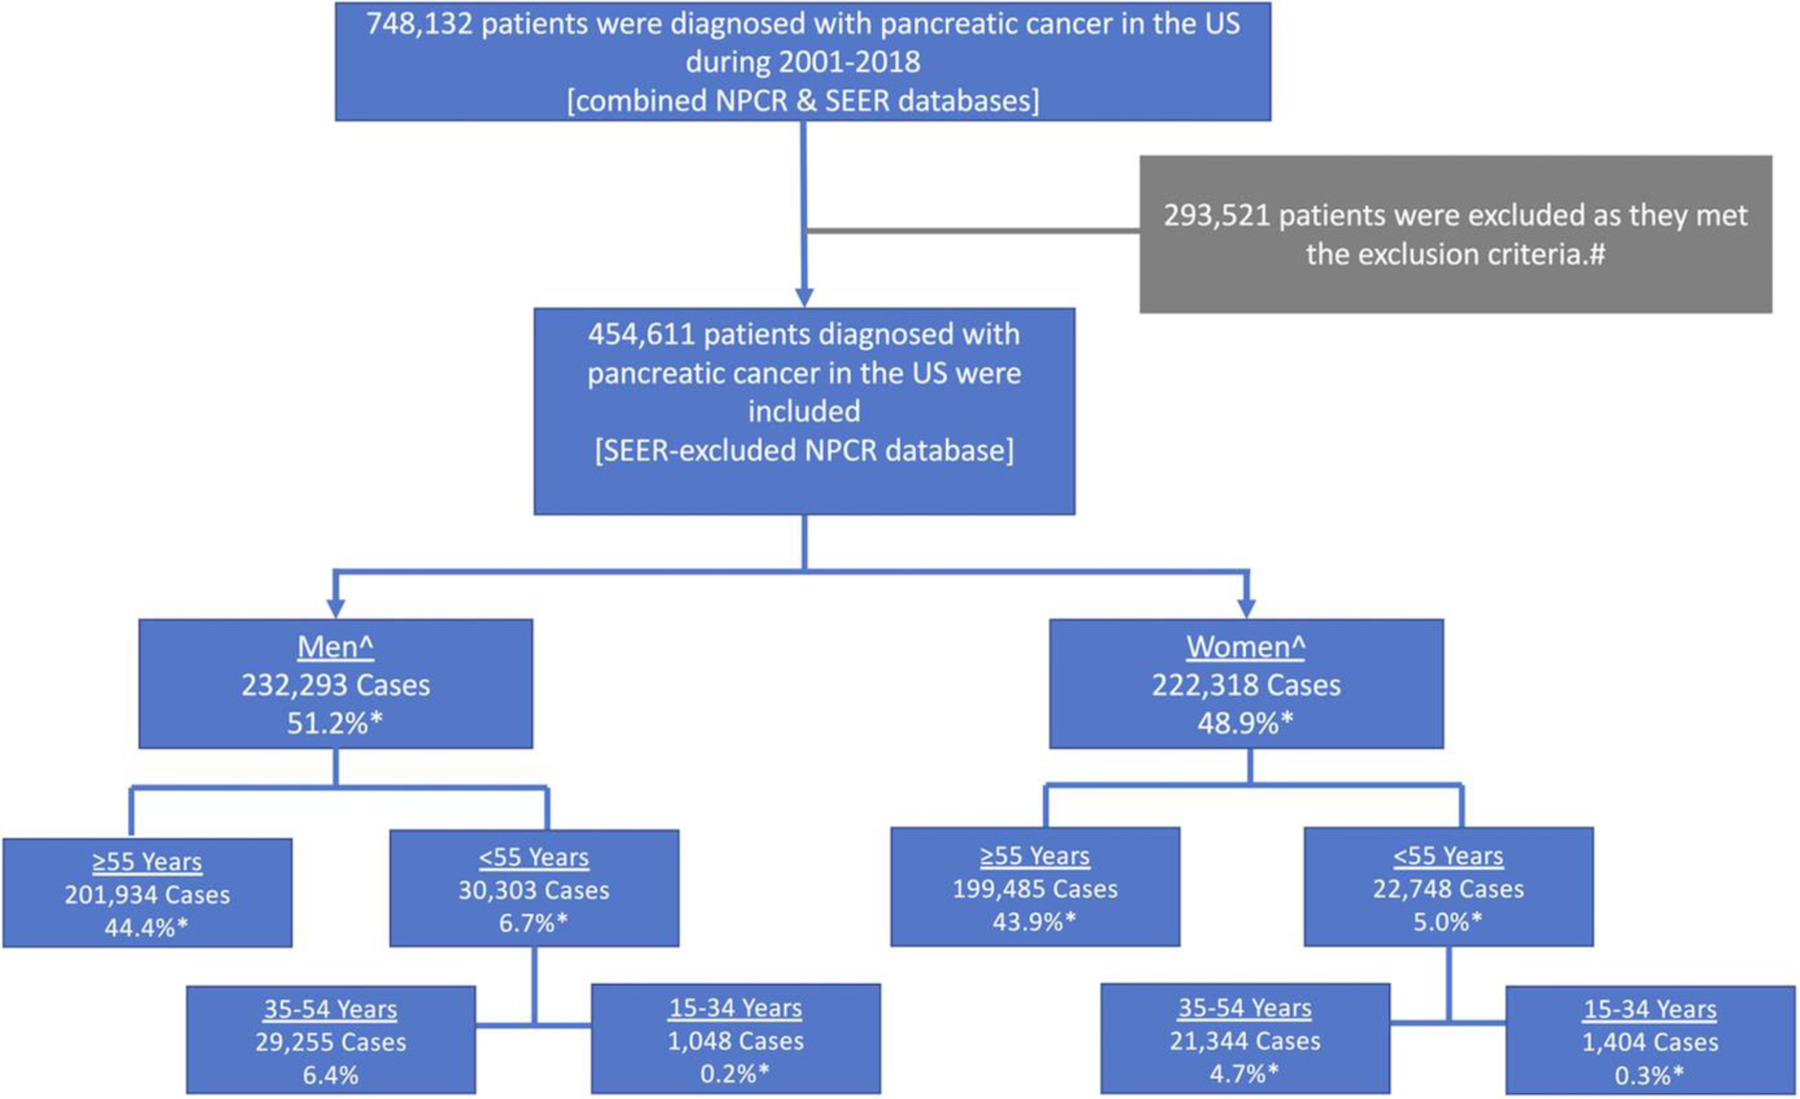
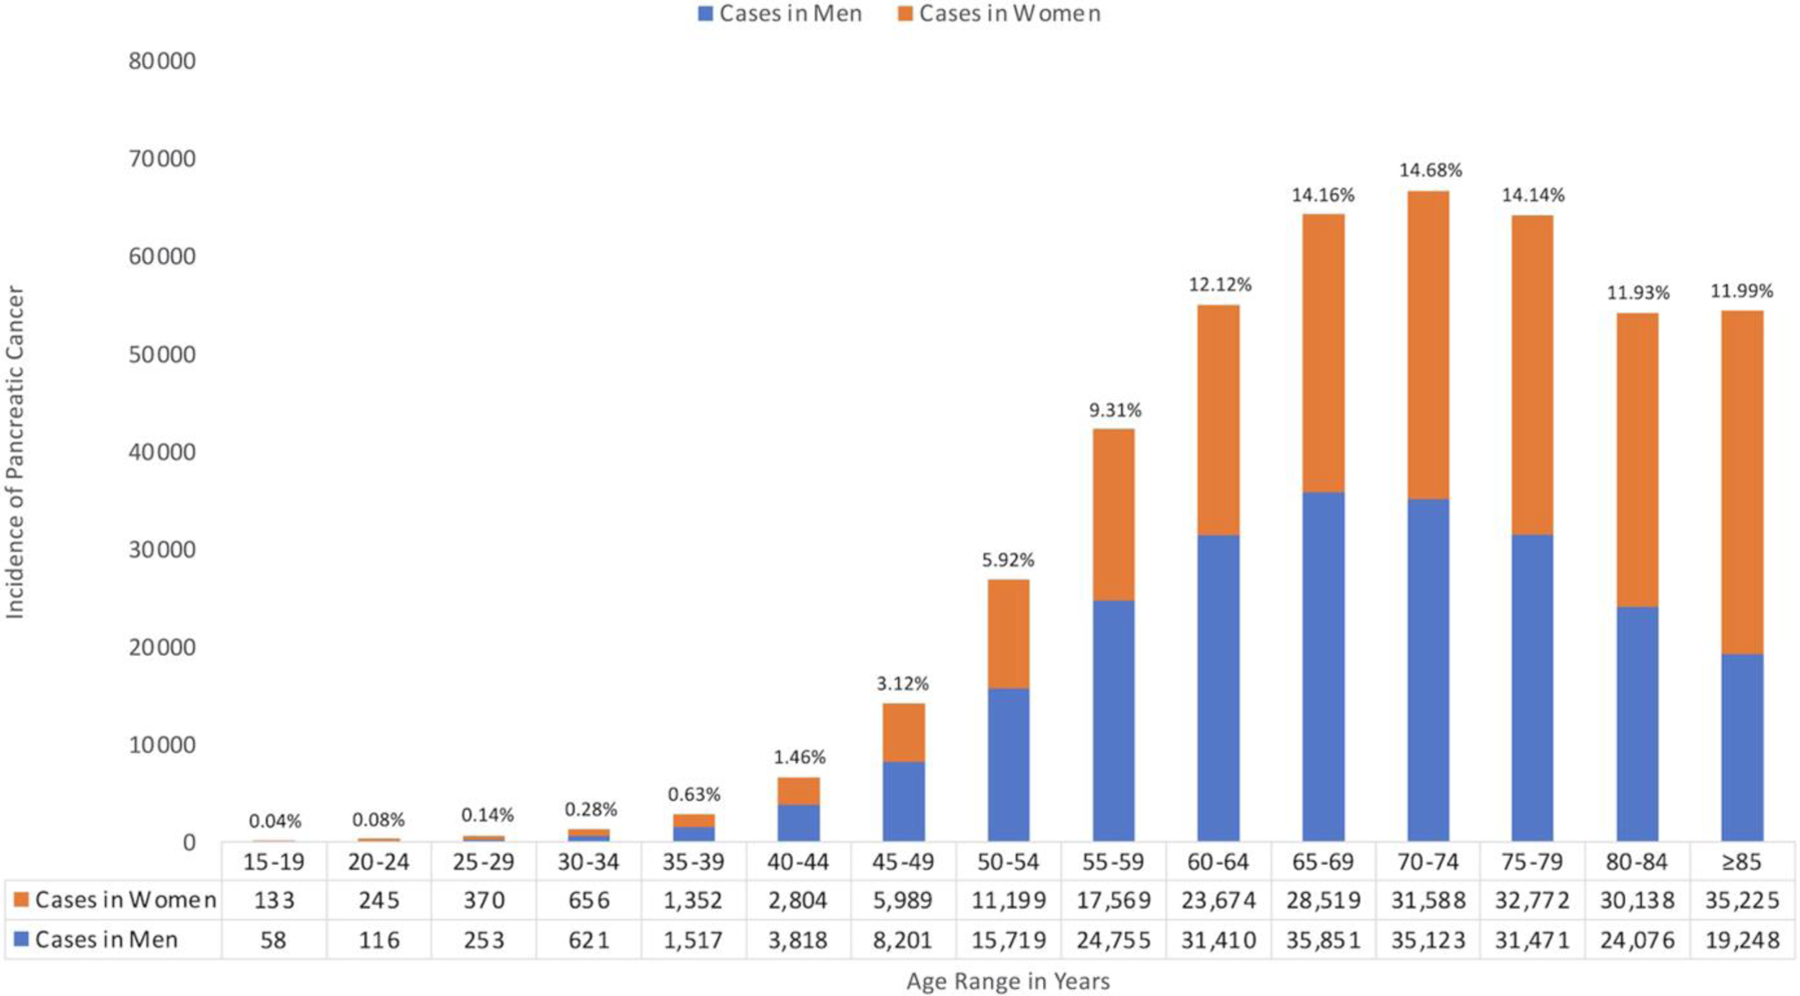
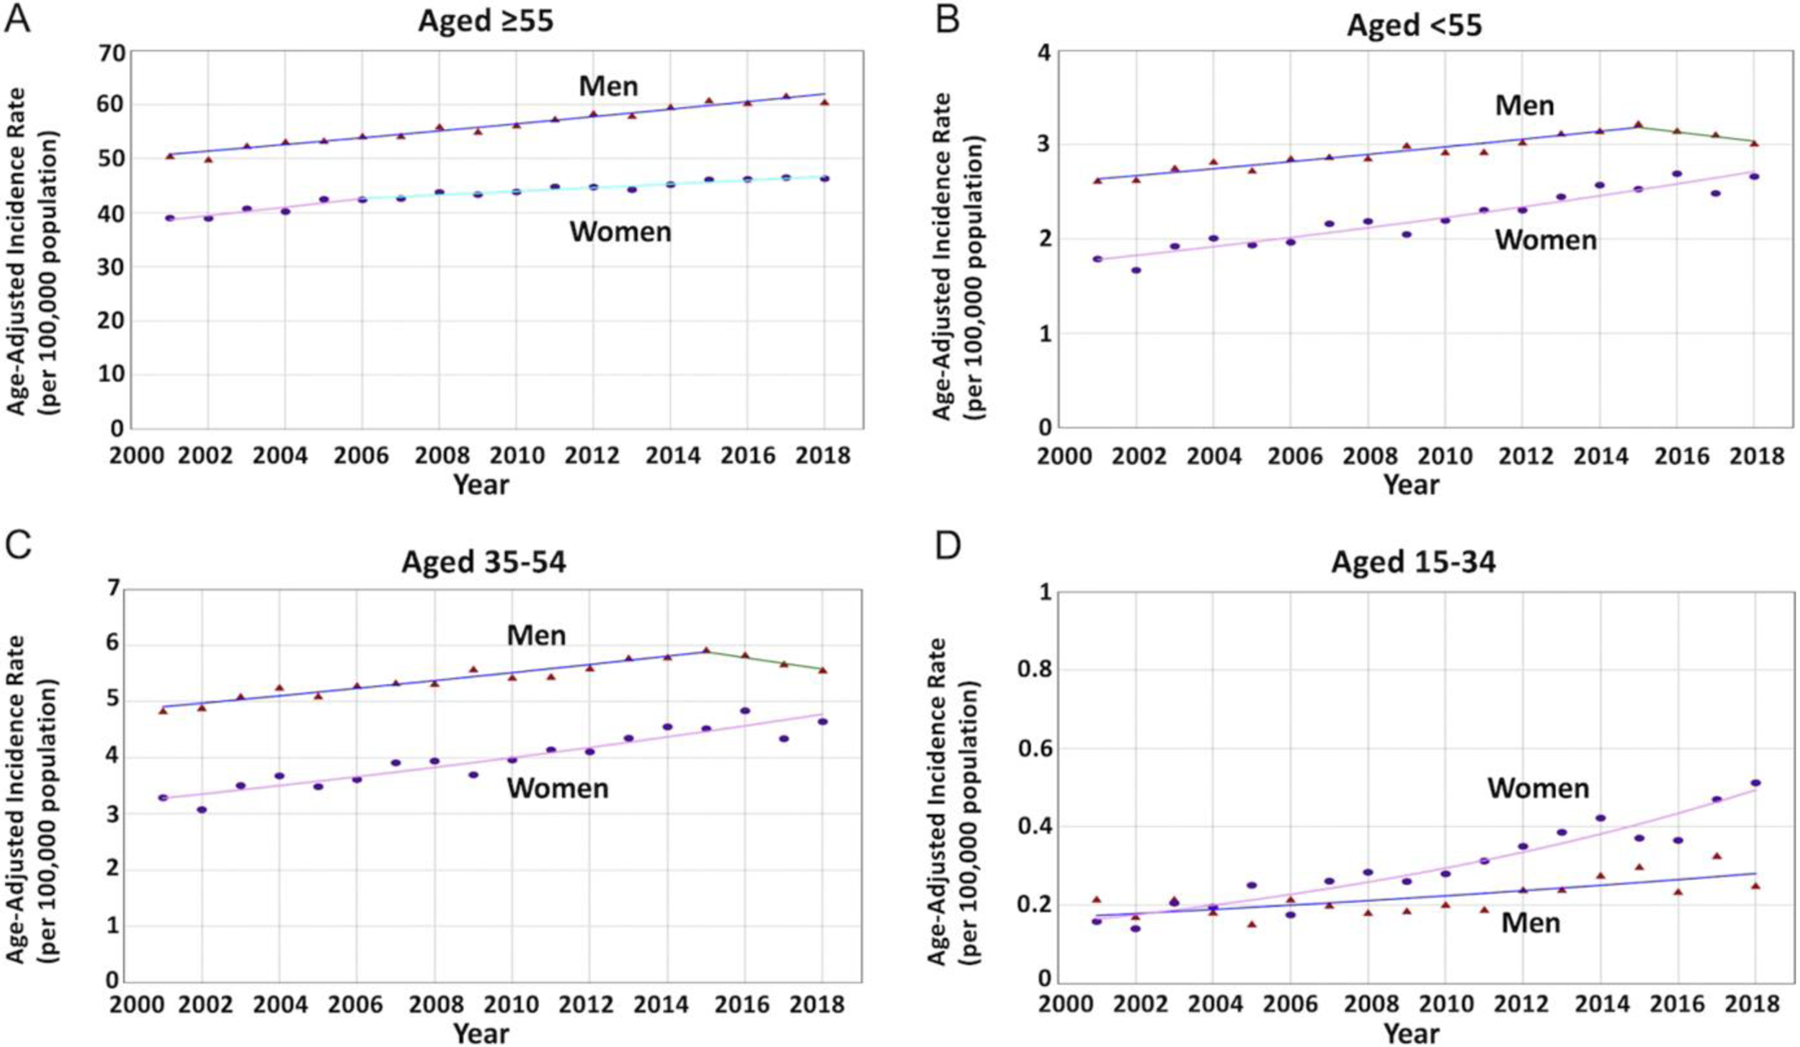
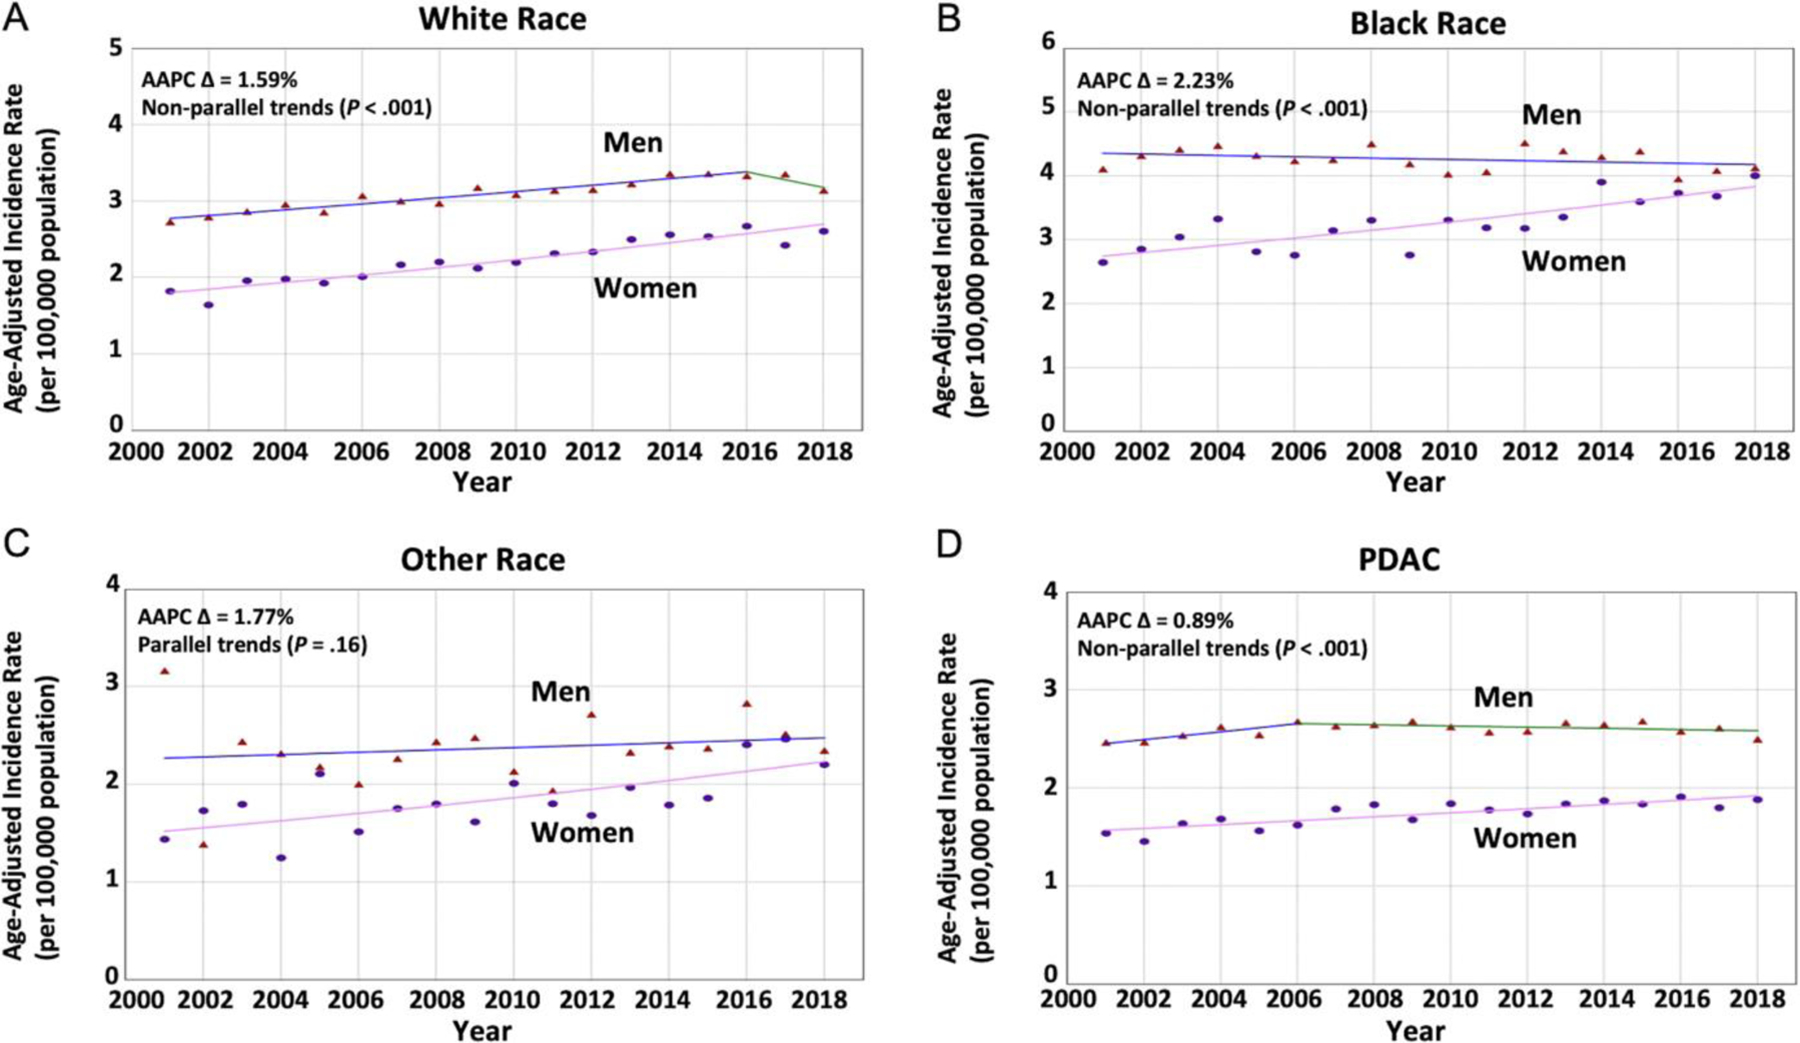
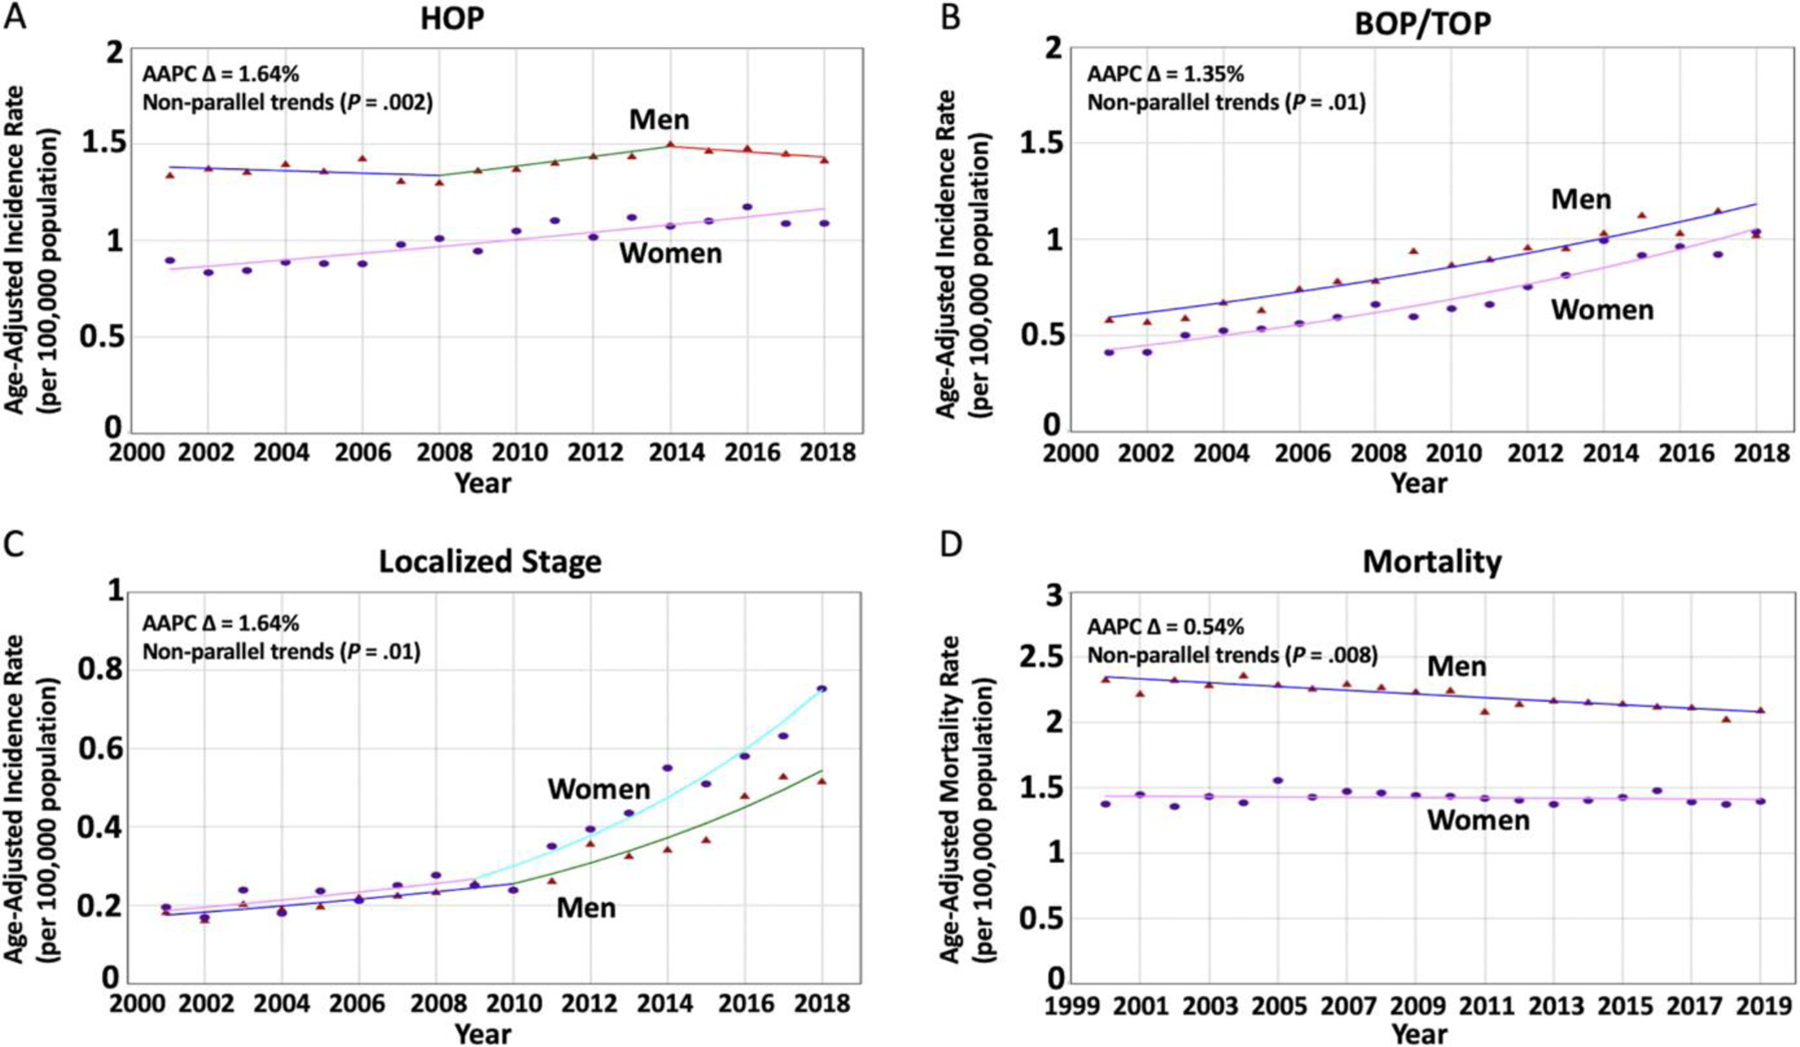
Results: A total of 454,611 patients were diagnosed with PC between 2001 and 2018 with significantly increasing aIR in women (AAPC = 1.27%) and men (AAPC = 1.14%) without a difference (P = .37). Similar results were seen in older adults. However, in younger adults (53,051 cases; 42.9% women), women experienced a greater increase in aIR than men (AAPCs = 2.36%, P < .001 vs 0.62%, P = 0.62) with nonparallel trends (P < .001) and AAPC difference of 1.74% (P < .001). This AAPC difference appears to be due to rising aIR in Blacks (2.23%; P < .001), adenocarcinoma histopathologic subtype (0.89%; P = .003), and location in the head-of-pancreas (1.64%; P < .001). PC mortality was found to be unchanged in women but decreasing in counterpart men (AAPC difference = 0.54%; P = .001).

Conclusion: Using nationwide data, covering ≈64.5% of the U.S. population, we externally validate a rapidly increasing aIR of PC in younger women. There was a big separation of the incidence trend between women and men aged 15-34 years between 2001 and 2018 (>200% difference), and it did not show slowing down.

Keywords: Epidemiology; Incidence; Mortality; Pancreatic Cancer; Sex.


Conflict of interest statement

Conflicts of interest

The authors disclose no conflicts.

Figures

Figure 1.
Figure 1.
Central Cancer Registry Programs submitting cancer data to the CDC’s NPCR and NCI’s SEER programs in the United States. This figure was reproduced from the NPCR-SEER public use database data standards and data dictionary.
Figure 2.
Figure 2.
Flow chart showing the inclusion process of patients who were diagnosed with PC in the United States during 2001–2018 using the NPCR database. #These patients were located in a state that contributed in part or full data to the SEER database during the study period. The excluded states were Alaska, California, Connecticut, Georgia, Hawaii, Idaho, Illinois, Iowa, Kentucky, Louisiana, Massachusetts, Michigan, New Jersey, New Mexico, New York, Utah, and Washington. ^Patients aged 0–14 years (85 females and 56 males) were excluded. *Percentage of overall cases.
Figure 3.
Figure 3.
The sex- and age-based distribution of patients diagnosed with PC in the United States during 2001–2018 using the NPCR database. Percentages were calculated with the number of cases among men and women combined for the age subgroup as the numerator, and the overall number of cases as the denominator.
Figure 4.
Figure 4.
Sex-specific trends and aIRs per 100,000 population for PC among different age groups. (Triangle) Incidence rate in men. (Circle) Incidence rate in women. (A) The AAPC was increasing in women and men without a statistically significant difference (1.11 vs 1.17; P = .65) among patients aged 55 years or older. (B) The AAPC was relatively increasing at a greater rate in women when compared with men (2.36 vs 0.62; P < .001) with nonparallel trends (P < .001) among patients younger than 55 years. (C) The AAPC was relatively increasing at a greater rate in women when compared with the stable trend in men (2.09 vs 0.54; P < .001) with nonparallel trends (P < .001) among patients aged 35–54 years. (D) The AAPC was relatively increasing at a much greater rate in women when compared with men (6.45 vs 2.97; P < .001) with nonparallel trends (P = .014) among patients aged 35–54 years.
Figure 5.
Figure 5.
Sex-specific trends for PC incidence based on race and histopathologic subgroup in younger adults. (Triangle) Incidence rate in men. (Circle) Incidence rate in women. (A) The AAPC was relatively increasing at a greater rate in women when compared with men (2.93 vs 0.80; P < .001) with nonparallel trends (P < .001) among patients of White race. (B) The AAPC was relatively increasing at a greater rate in women when compared with men (1.98 vs −0.24; P < .001) with nonparallel trends (P < .001) among patients of Black race. (C) The AAPC was increasing in women and men (2.28 vs 0.51; P = .04) with parallel trends (P = .16) among patients of other races. (D) The AAPC was relatively increasing at a greater rate in women when compared with men (1.19 vs 0.31; P = .003) with nonparallel trends (P < .001) among patients diagnosed with PDAC histopatholgic subtype.
Figure 6.
Figure 6.
Sex-specific trends for PC incidence based on tumor location and stage-at-diagnosis and sex-specific mortality trends in younger adults. (Triangle) Incidence rate in men. (Circle) Incidence rate in women. (A) The AAPC was relatively increasing at a greater rate in women when compared with men (1.86 vs 0.22; P < .001) with nonparallel trends (P = .002) among patients diagnosed with tumors at the HOP. (B) The AAPC was relatively increasing at a greater rate in women when compared with men (5.47 vs 4.12; P = .006) with nonparallel trends (P = .01) among patients diagnosed with tumors at the BOP or TOP. (C) The AAPC seemed to be relatively increasing at a greater rate in women when compared with men (8.52 vs 6.89; P = .29) with nonparallel trends (P = .01) among patients diagnosed with tumors at a localized stage. (D) Mortality rates were decreasing in men but not in women (AAPC, −0.64 vs −0.09; P = .001) with nonparallel trends (P = .008).

Comment in

Similar articles

Cited by

References

    1. NIH National Cancer Institute SEER Program. Cancer Stat Facts: Pancreatic Cancer. Available at: https://seer.cancer.gov/statfacts/html/pancreas.html. Accessed November 6, 2022.
    1. Siegel RL, Miller KD, Fuchs HE, et al. Cancer Statistics, 2021. CA Cancer J Clin 2021;71:7–33. - PubMed
    1. Gordon-Dseagu VL, Devesa SS, Goggins M, et al. Pancreatic cancer incidence trends: evidence from the Surveillance, Epidemiology and End Results (SEER) population-based data. Int J Epidemiol 2018;47:427–439. - PMC - PubMed
    1. U.S. Cancer Statistics Working Group. U.S. Cancer Statistics. Data Visualizations Tool, based on 2021 submission data (1999–2019): U.S. Department of Health and Human Services, Centers for Disease Control and Prevention and National Cancer Institute. Available at: https://www.cdc.gov/cancer/dataviz. Released November 2022. Accessed November 9, 2022.
    1. Bauer MR, Bright EE, MacDonald JJ, et al. Quality of life in patients with pancreatic cancer and their caregivers: a systematic review. Pancreas 2018;47:368–375. - PubMed

Publication types