. 2023 May;299(5):103003.
doi: 10.1016/j.jbc.2023.103003. Epub 2023 Feb 11.

Single-molecule dynamics of DNA gyrase in evolutionarily distant bacteria Mycobacterium tuberculosis and Escherichia coli

Affiliations

Single-molecule dynamics of DNA gyrase in evolutionarily distant bacteria Mycobacterium tuberculosis and Escherichia coli

Cooper J Galvin et al. J Biol Chem. 2023 May.

Abstract

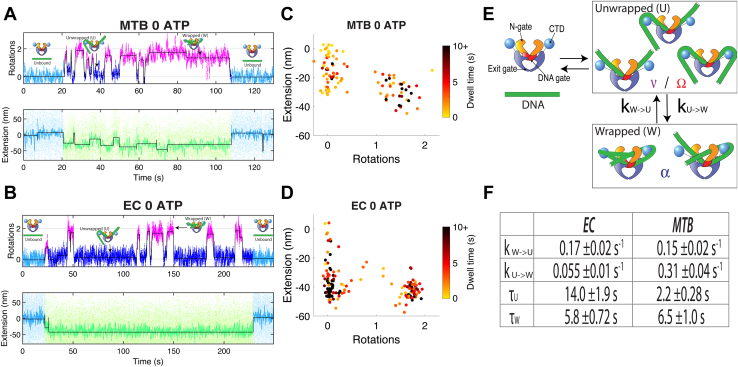
DNA gyrase is an essential nucleoprotein motor present in all bacteria and is a major target for antibiotic treatment of Mycobacterium tuberculosis (MTB) infection. Gyrase hydrolyzes ATP to add negative supercoils to DNA using a strand passage mechanism that has been investigated using biophysical and biochemical approaches. To analyze the dynamics of substeps leading to strand passage, single-molecule rotor bead tracking (RBT) has been used previously to follow real-time supercoiling and conformational transitions in Escherichia coli (EC) gyrase. However, RBT has not yet been applied to gyrase from other pathogenically relevant bacteria, and it is not known whether substeps are conserved across evolutionarily distant species. Here, we compare gyrase supercoiling dynamics between two evolutionarily distant bacterial species, MTB and EC. We used RBT to measure supercoiling rates, processivities, and the geometries and transition kinetics of conformational states of purified gyrase proteins in complex with DNA. Our results show that E. coli and MTB gyrases are both processive, with the MTB enzyme displaying velocities ∼5.5× slower than the EC enzyme. Compared with EC gyrase, MTB gyrase also more readily populates an intermediate state with DNA chirally wrapped around the enzyme, in both the presence and absence of ATP. Our substep measurements reveal common features in conformational states of EC and MTB gyrases interacting with DNA but also suggest differences in populations and transition rates that may reflect distinct cellular needs between these two species.

Keywords: DNA-protein interaction; bacterial genetics; bacterial pathogenesis; bacterial transcription; molecular motor; single-molecule biophysics; topoisomerase.


Conflict of interest statement

Conflict of interest The authors declare that they have no conflicts of interest with the contents of this article.

Figures

Figure 1
Figure 1
Rotor bead tracking to detect supercoiling dynamics in two evolutionarily distinct species.A, simplified mechanochemical model of DNA:gyrase conformational states previously observed by RBT (17). B, experimental diagram of tethers used for RBT tracking, highlighting the two major modes of information gathering: DNA contraction and DNA rotation caused by enzyme binding and activity below the rotor bead. C, phylogenetic tree of gyrases from previously studied model organisms and several common pathogenic species, populated using a consensus of trees of species divergence dates using the online Time-Tree tool (58). D, depictions of extension and rotation changes to DNA during the gyrase topoisomerization reaction and the response of the rotor bead. E, example single-molecule trace for a DNA tether in the presence of Mycobacterium tuberculosis (MTB) gyrase. The extension data (color) shows a period prior to enzyme binding (blue), then a period during gyrase binding and DNA supercoiling (warmer colors) until dissociation (blue). F, example single-molecule trace for a DNA tether in the presence of Escherichia coli (EC) gyrase, showing a binding and supercoiling event. MTB, Mycobacterium tuberculosis; EC, Escherichia coli; RBT, rotor bead tracking.
Figure 2
Figure 2
Single-molecule burst data and supercoiling velocities.A, example single-molecule processive bursts for EC and MTB DNA gyrase. The starting angle for each trace is offset by an arbitrary multiple of two rotations in order to fit many examples into a single panel. B, average velocity of DNA gyrase by bacterial species and [ATP]. Bars represent the weighted mean and the weighted SD (both weighted by burst duration); text displays the weighted mean. Total number of cycles for each condition: MTB 1.3 mM ATP, N = 167 cycles; EC 1.3 mM ATP, N = 316 cycles; MTB 130 μM ATP, N = 110 cycles; EC 130 μM ATP, N = 59 cycles. Examples of longer EC bursts at 1.3 mM ATP are included in Fig. S4. EC, Escherichia coli; MTB, Mycobacterium tuberculosis.
Figure 3
Figure 3
DNA:gyrase complex conformations at varying nucleotide conditions for EC and MTB enzymes. Distributions of angle and extension measurements are shown as 2D histograms, where (0,0) represents free DNA without gyrase interaction. A and B, fitted 2D Gaussian centers are labeled. The number of gyrase encounters with DNA recorded are as follows: A, MTB gyrase, 0 ATP, N = 19 traces, taken across 3 days and three different tethers; B, MTB gyrase, 130 μM ATP, N = 16 traces, taken across 2 days and three different tethers; C, MTB gyrase, 1.3 mM ATP, N = 17 traces, taken across 5 days and five different tethers; D, EC gyrase, 0 ATP, N = 21 traces, taken across 2 days and two different tethers; E, EC gyrase, 130 μM ATP, N = 7 traces, taken across 2 days and two different tethers; F, EC gyrase, 1.3 mM ATP, N = 8 traces, taken across 3 days and three different tethers. Traces with 5 s of free DNA before and after each run are also shown in Fig. S5 to visualize the free DNA population at (0,0). EC, Escherichia coli; MTB, Mycobacterium tuberculosis.
Figure 4
Figure 4
DNA:gyrase conformational dynamics in the absence of ATP. Data replicates are the same as for Figure 3. A and B, example traces of MTB and EC gyrase interacting with DNA without nucleotide. Color changes in the plotted angle denote detected changes in mean angle, where magenta signifies detected states beyond 0.65 rotations and blue signifies all other states. The black lines in the angle and extension plots show the Steppi idealizations of the trajectories (41). Light green extension data indicates where a detected contraction has occurred. Darker color extension data has been filtered with a 2.5 Hz low-pass Butterworth filter applied separately to Steppi-detected bound and unbound states. C and D, one data point is plotted for each detected dwell at either the unwrapped or wrapped state. E, simplified model for DNA:gyrase conformations pooled into detected states. F, rates calculated for simplified model and dwell times in wrapped and unwrapped states. All binding events started and ended in detected unwrapped states. For EC, Nfree->U and NU->free = 21, NW->U and NU->W = 65; for MTB, Nfree->U and NU->free = 19, NW->U and NU->W = 41 (N for total binding events shown in Fig. 3). EC, Escherichia coli; MTB, Mycobacterium tuberculosis.
Figure 5
Figure 5
DNA:gyrase conformational dynamics with ATP. Data replicates same as Figure 3. A and B, example traces of MTB and EC gyrase interacting with DNA with intermediate (130 μM) ATP. Color changes in the angle plot denote detected changes in mean angle, where magenta signifies detected dwells between 0.85 and 1.85 rotations (angle coordinate mod 2) and blue signifies all other detected dwell angles. The black lines in the angle and extension plots show the Steppi idealizations of the trajectories. Light green extension data indicates where a detected contraction has occurred. Darker color extension data has been filtered with a 2.5 Hz low-pass Butterworth filter applied separately to Steppi-detected bound and unbound states. C and D, every detected dwell by species and nucleotide condition, histogrammed along the angle coordinate; magenta signifies detected states between 0.85 and 1.85 rotations (angle coordinate mod 2) and blue signifies all other states. EC, Escherichia coli; MTB, Mycobacterium tuberculosis.
Figure 6
Figure 6
Summary model for differences in dominant states between species.

References

    1. Forterre P., Gribaldo S., Gadelle D., Serre M.-C. Origin and evolution of DNA topoisomerases. Biochimie. 2007;89:427–446. - PubMed
    1. Van Boeckel T.P., Gandra S., Ashok A., Caudron Q., Grenfell B.T., Levin S.A., et al. Global antibiotic consumption 2000 to 2010: an analysis of national pharmaceutical sales data. Lancet Infect. Dis. 2014;14:742–750. - PubMed
    1. Baba T., Ara T., Hasegawa M., Takai Y., Okumura Y., Baba M., et al. Construction of Escherichia coli K-12 in-frame, single-gene knockout mutants: the keio collection. Mol. Syst. Biol. 2006;2 2006.0008. - PMC - PubMed
    1. Goodall E.C.A., Robinson A., Johnston I.G., Jabbari S., Turner K.A., Cunningham A.F., et al. The essential genome of Escherichia coli K-12. mBio. 2018;9 - PMC - PubMed
    1. Postow L., Crisona N.J., Peter B.J., Hardy C.D., Cozzarelli N.R. Topological challenges to DNA replication: conformations at the fork. Proc. Natl. Acad. Sci. U. S. A. 2001;98:8219–8226. - PMC - PubMed

Publication types

MeSH terms

LinkOut - more resources