

Practical Implications of the Update to the 2015 Japan Standard Population: Mortality Archive From 1950 to 2020 in Japan
- PMID: 36775330
- PMCID: PMC10257988
- DOI: 10.2188/jea.JE20220302
Practical Implications of the Update to the 2015 Japan Standard Population: Mortality Archive From 1950 to 2020 in Japan
Abstract
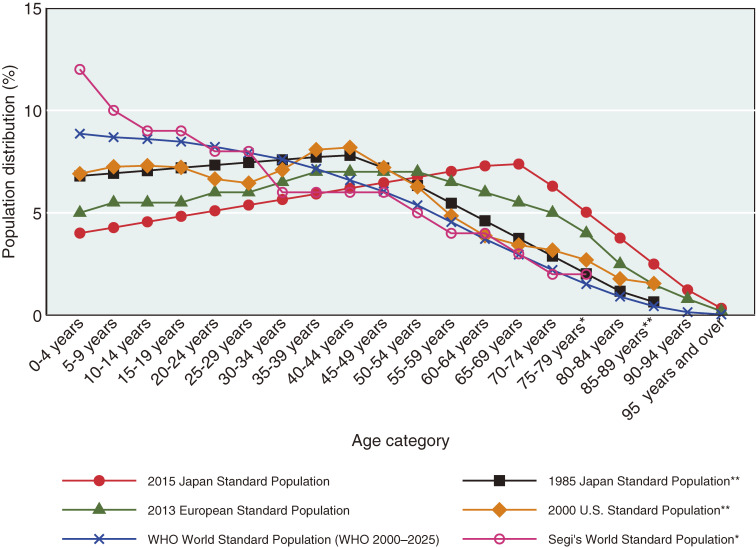
Background: The 2015 Japan Standard Population (JSP) was established in response to changes in the age structure. However, the effects of major updates, especially the recategorization of older age groups, for interpreting various health metrics have not been clarified.
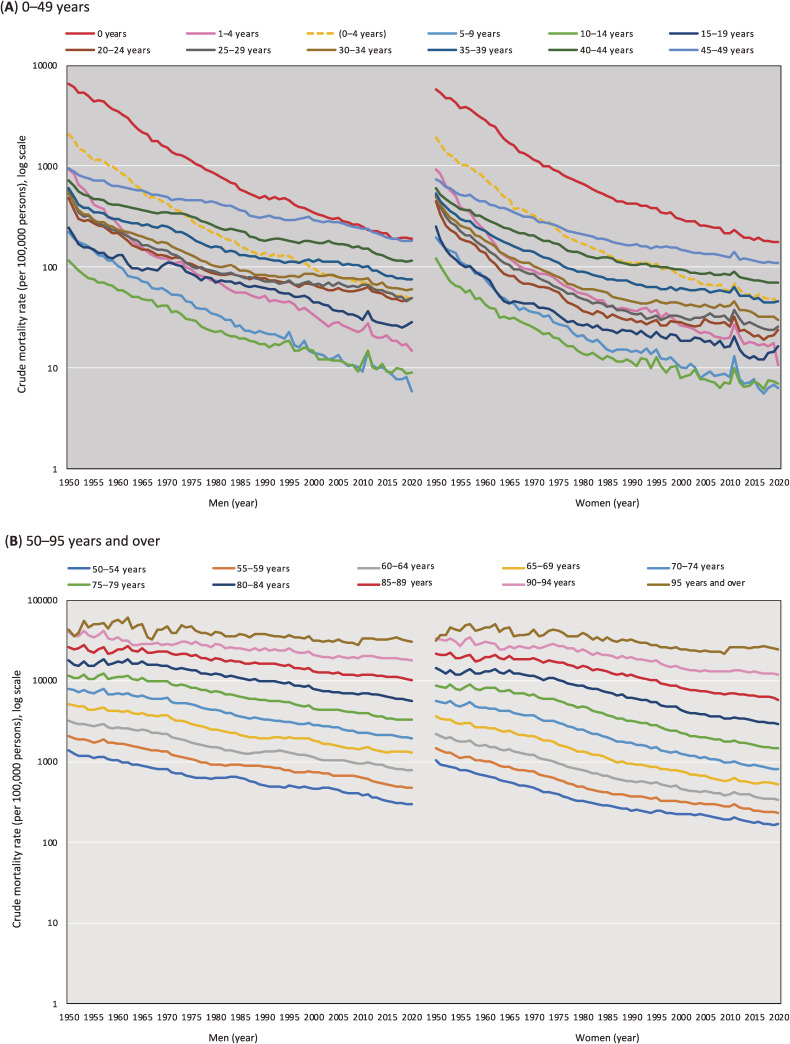
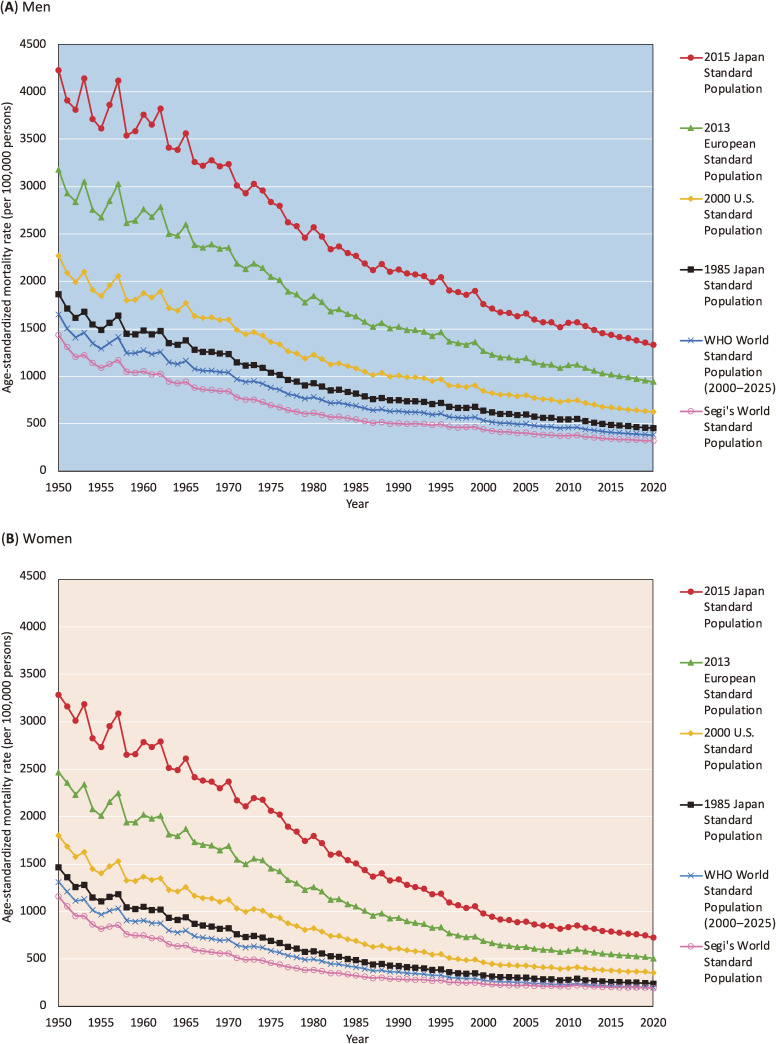
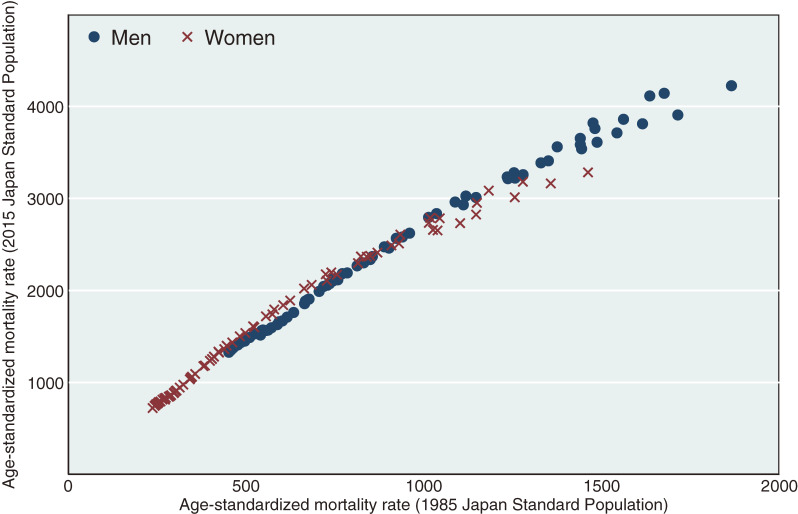
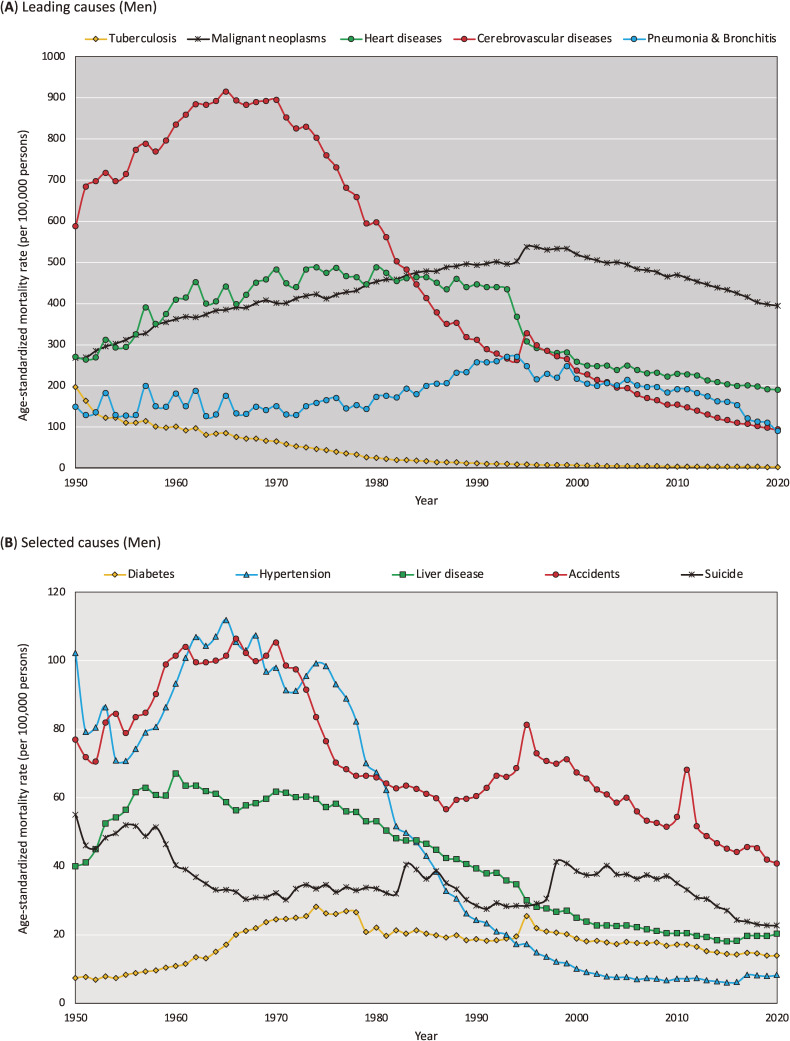
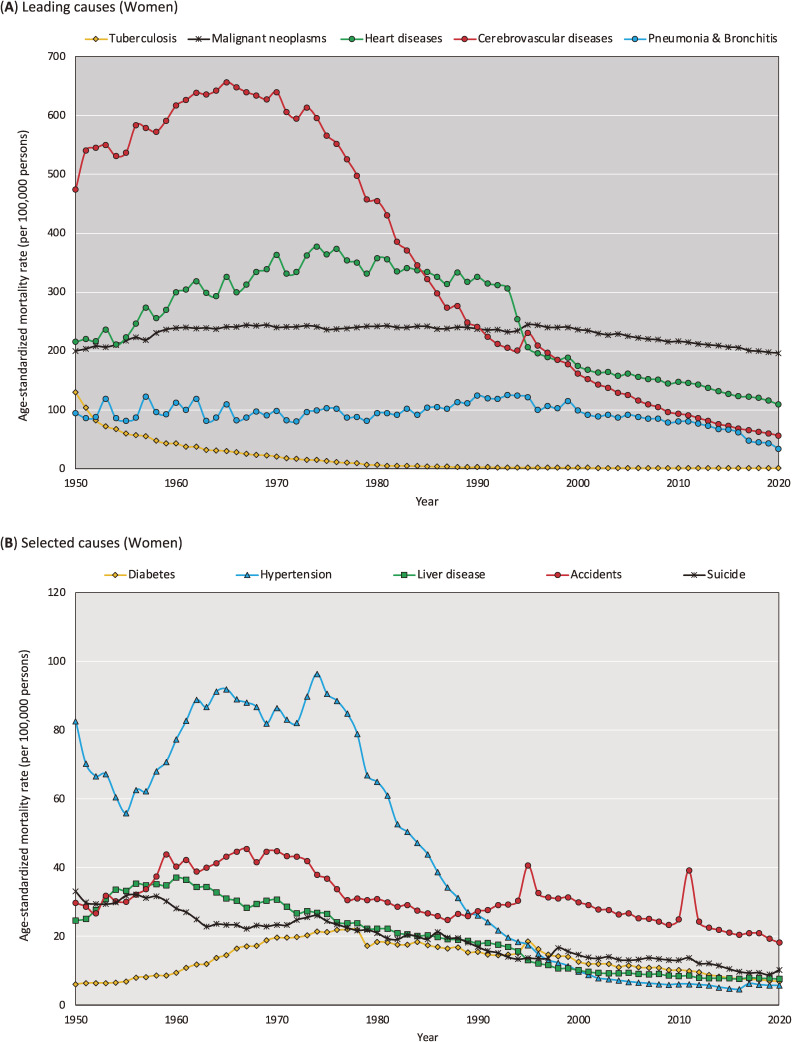
Methods: Population data were collected and estimated for older age categories (85-89, 90-94, and ≥95 years). Data on the number of deaths were also collected from the Vital Statistics. We recalculated the all-cause and leading cause-specific age-standardized mortality rate (ASMR) using the 2015 JSP by the direct standardization method for data from 1950 to 2020. We compared ASMRs calculated using the 2015 JSP with those calculated using the 1985 JSP. Pearson's correlation coefficients were used to evaluate the consistency of mortality trends between the 2015 and 1985 JSPs.
Results: The absolute all-cause ASMRs calculated using the 2015 JSP were 2.22-3.00 times higher than those calculated using the 1985 JSP. The ASMR ratios increased gradually over time. While trends in all-cause and cause-specific ASMRs calculated using the 2015 JSP and 1985 JSP were generally highly correlated (Pearson's correlation coefficient [r] = 0.993 for all-cause), correlations were relatively low for malignant neoplasms (r = 0.720 for men and r = 0.581 for women) and pneumonia/bronchitis (r = 0.543 for men and r = 0.559 for women) due to non-monotonous trends over time and fluctuations in earlier time periods.
Conclusion: The effect of introducing the new JSP for interpreting trends in all-cause mortality was considered minimal. However, caution is needed when interpreting trends in some cause-specific mortality rates.
Keywords: age-standardized mortality; direct standardization method; standard population; the 1985 Japan Standard Population; the 2015 Japan Standard Population.
Conflict of interest statement
Conflicts of interest: None declared.
Figures
Comment in
-
Toward Better Utilization of the 2015 Japan Standard Population.J Epidemiol. 2023 Oct 5;33(10):545. doi: 10.2188/jea.JE20230135. Epub 2023 Jul 31. J Epidemiol. 2023. PMID: 37331794 Free PMC article. No abstract available.
References
-
- Rothman KJ, Greenland S, Lash TL. Modern epidemiology. vol 3. Philadelphia, US: Wolters Kluwer Health/Lippincott Williams & Wilkins; 2008.
-
- The Surveillance, Epidemiology, and End Results (SEER) Program. Standard Populations (Millions) for Age-Adjustment. https://seer.cancer.gov/stdpopulations/; 2020 Accessed 18.10.2022.
-
- The Ministry of Health, Labour and Welfare. Vital Statistics. https://www.mhlw.go.jp/english/database/db-hw/vs01.html; 2022 Accessed 18.10.2022.
-
- The Ministry of Health, Labour and Welfare. Standardised mortality rates. https://www.mhlw.go.jp/toukei/saikin/hw/jinkou/other/00sibou/1.html; 2001 Accessed 18.10.2022.