Trends in incidence and survival in patients with gastrointestinal neuroendocrine tumors: A SEER database analysis, 1977-2016
- PMID: 36776304
- PMCID: PMC9909535
- DOI: 10.3389/fonc.2023.1079575
Trends in incidence and survival in patients with gastrointestinal neuroendocrine tumors: A SEER database analysis, 1977-2016
Abstract
Objectives: We aimed to determine trends in incidence and survival in patients with gastrointestinal neuroendocrine tumors (GI-NETs) from 1977 to 2016, and then analyze the potential risk factors including sex, age, race, grade, Socioeconomic status (SES), site, and stage.
Methods: Data were obtained from Surveillance, Epidemiology, and End Results Program (SEER) database. Kaplan-Meier survival analysis, relative survival rates (RSRs), and Cox proportional risk regression model were used to evaluate the relationship between these factors and prognosis.
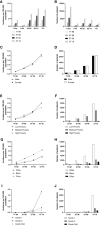
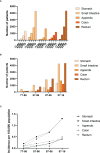
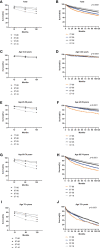
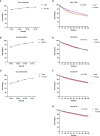
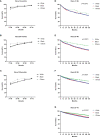
Results: Compared with other sites, the small intestine and rectum have the highest incidence, and the appendix and rectum had the highest survival rate. The incidence was higher in males than in females, and the survival rate in males was close to females. Blacks had a higher incidence rate than whites, but similar survival rates. Incidence and survival rates were lower for G3&4 than for G1 and G2. Age, stage, and grade are risk factors.
Conclusions: This study described changes in the incidence and survival rates of GI-NETs from 1977 to 2016 and performed risk factor analyses related to GI-NETs.
Keywords: gastrointestinal neuroendocrine tumors; incidence; relative; risk factors; survival.
Copyright © 2023 Liu, Wei, Liu, Chen, Guan, Zhang, Guo, Liu and Xie.
Conflict of interest statement
The authors declare that the research was conducted in the absence of any commercial or financial relationships that could be construed as a potential conflict of interest.
Figures

References
-
- Krieger N, Chen JT, Waterman PD, Rehkopf DH, Subramanian SV. Race/ethnicity, gender, and monitoring socioeconomic gradients in health: a comparison of area-based socioeconomic measures–the public health disparities geocoding project. Am J Public Health (2003) 93:1655–71. doi: 10.2105/ajph.93.10.1655 - DOI - PMC - PubMed
-
- Krieger N, Chen JT, Waterman PD, Soobader M-J, Subramanian SV, Carson R. Geocoding and monitoring of US socioeconomic inequalities in mortality and cancer incidence: does the choice of area-based measure and geographic level matter?: the public health disparities geocoding project. Am J Epidemiol (2002) 156:471–82. doi: 10.1093/aje/kwf068 - DOI - PubMed
LinkOut - more resources
Full Text Sources

