

Development of a TGF-β signaling-related genes signature to predict clinical prognosis and immunotherapy responses in clear cell renal cell carcinoma
- PMID: 36776317
- PMCID: PMC9911835
- DOI: 10.3389/fonc.2023.1124080
Development of a TGF-β signaling-related genes signature to predict clinical prognosis and immunotherapy responses in clear cell renal cell carcinoma
Abstract
Background: Transforming growth factor (TGF)-β signaling is strongly related to the development and progression of tumor. We aimed to construct a prognostic gene signature based on TGF-β signaling-related genes for predicting clinical prognosis and immunotherapy responses of patients with clear cell renal cell carcinoma (ccRCC).
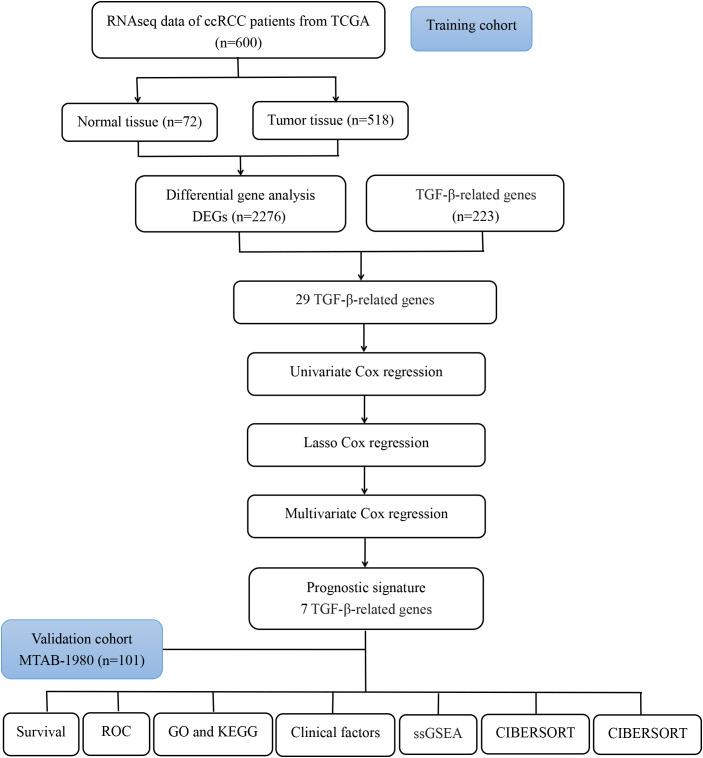
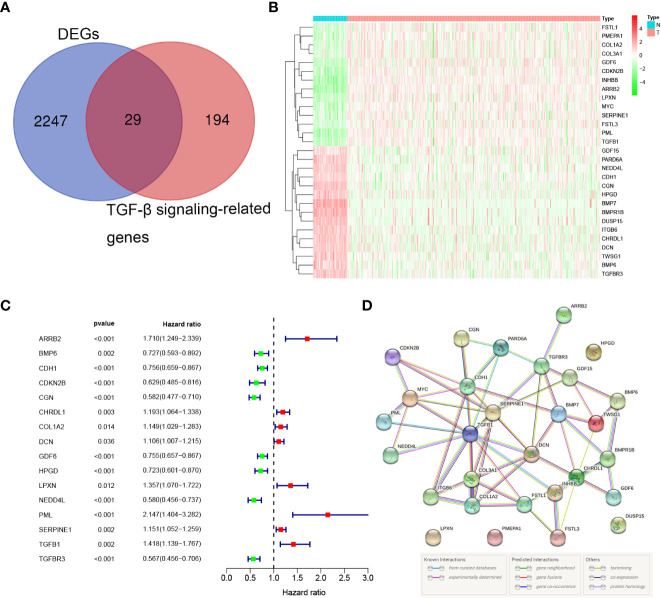
Methods: The gene expression profiles and corresponding clinical information of ccRCC were collected from the TCGA and the ArrayExpress (E-MTAB-1980) databases. LASSO, univariate and multivariate Cox regression analyses were conducted to construct a prognostic signature in the TCGA cohort. The E-MTAB-1980 cohort were used for validation. Kaplan-Meier (K-M) survival and time-dependent receiver operating characteristic (ROC) were conducted to assess effectiveness and reliability of the signature. The differences in gene enrichments, immune cell infiltration, and expression of immune checkpoints in ccRCC patients showing different risks were investigated.
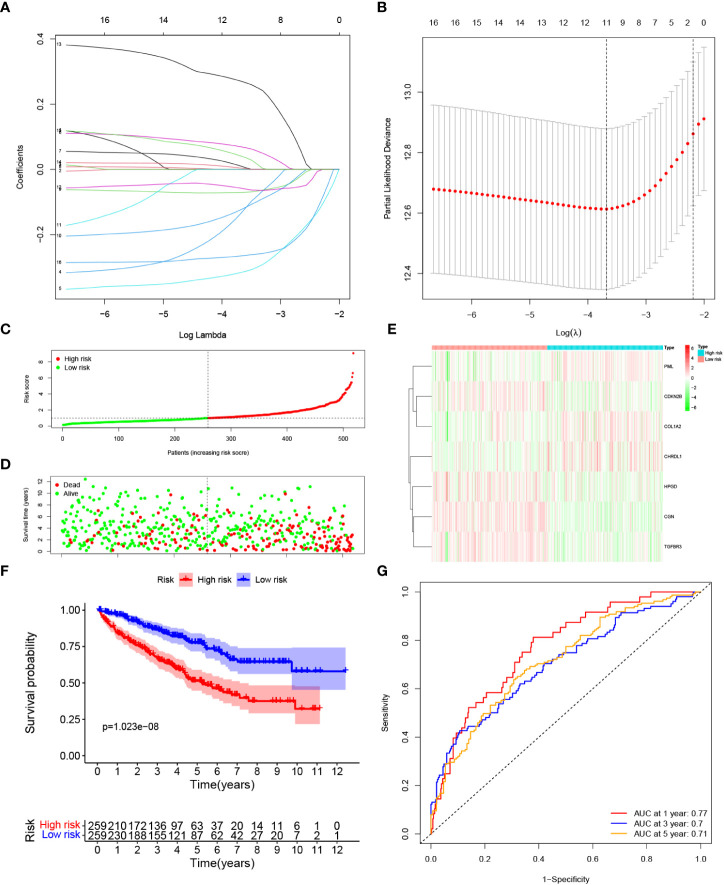
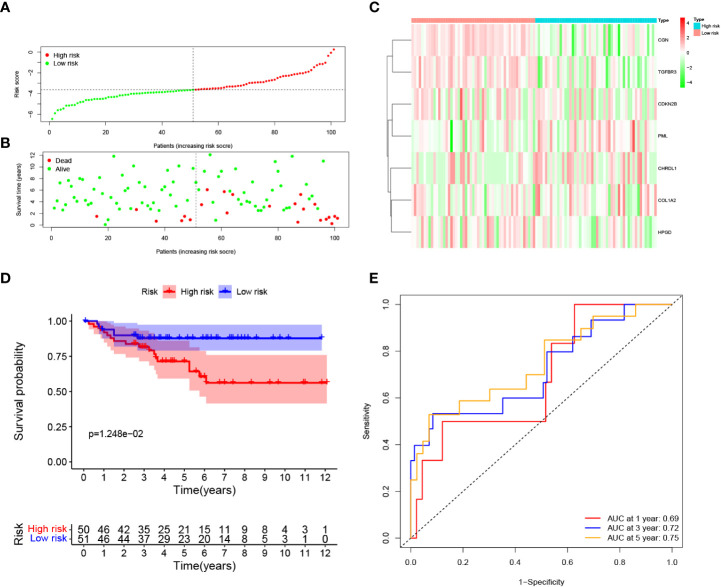
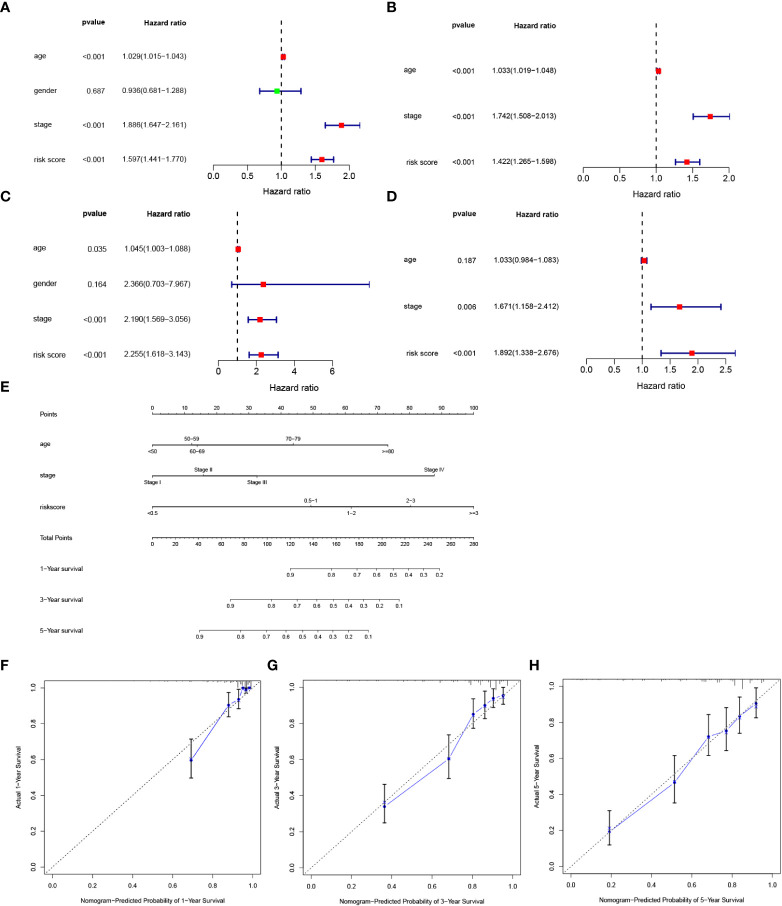
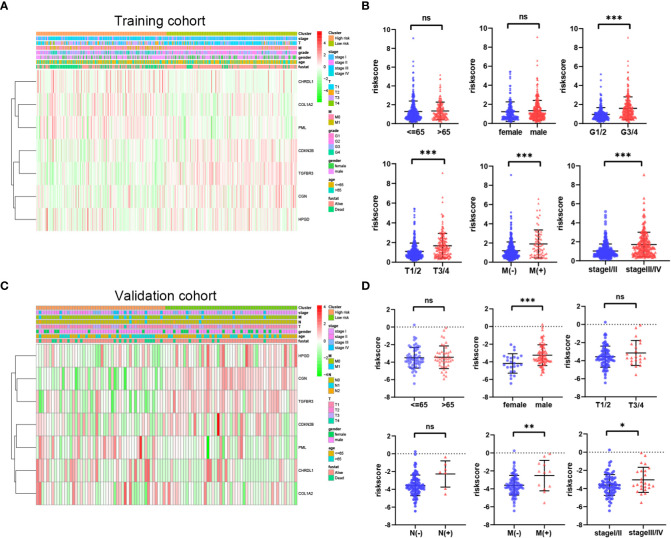
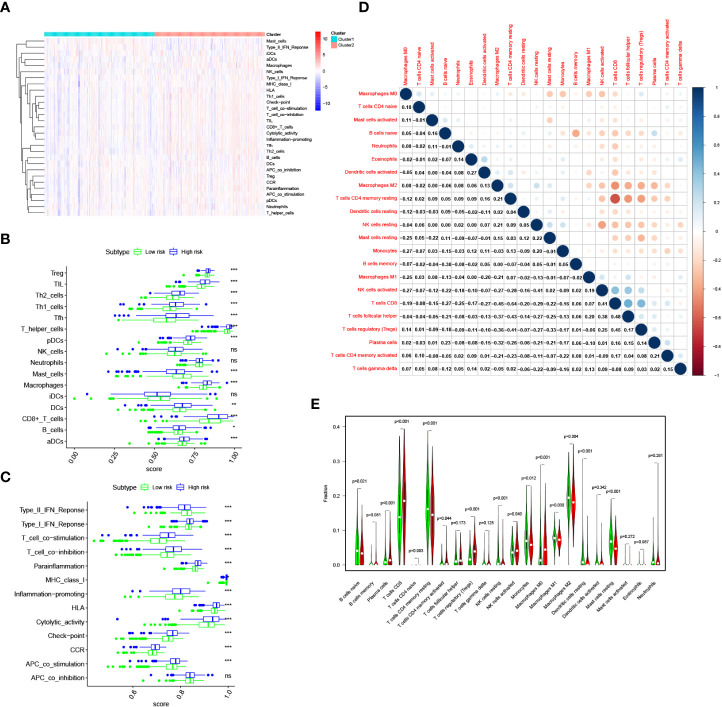
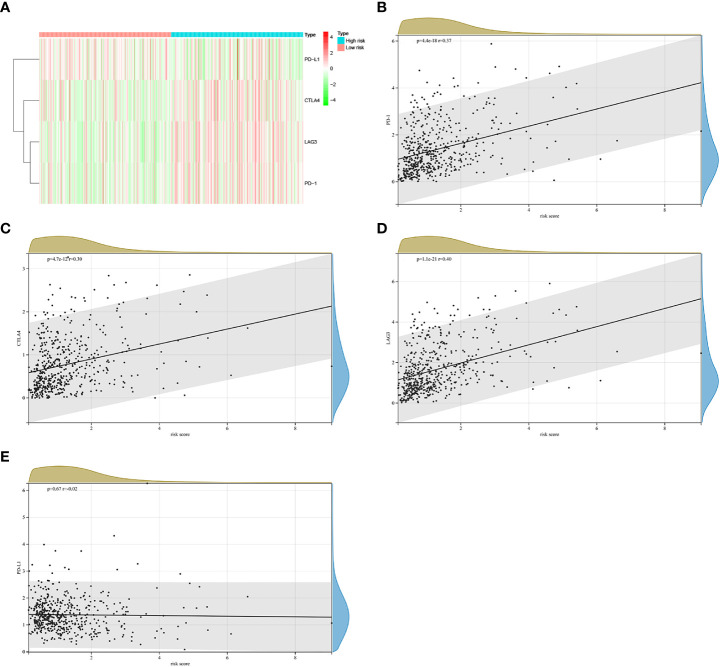
Results: We constructed a seven gene (PML, CDKN2B, COL1A2, CHRDL1, HPGD, CGN and TGFBR3) signature, which divided the ccRCC patients into high risk group and low risk group. The K-M analysis indicated that patients in the high risk group had a significantly shorter overall survival (OS) time than that in the low risk group in the TCGA (p < 0.001) and E-MTAB-1980 (p = 0.012). The AUC of the signature reached 0.77 at 1 year, 0.7 at 3 years, and 0.71 at 5 years in the TCGA, respectively, and reached 0.69 at 1 year, 0.72 at 3 years, and 0.75 at 5 years in the E-MTAB-1980, respectively. Further analyses confirmed the risk score as an independent prognostic factor for ccRCC (p < 0.001). The results of ssGSEA that immune cell infiltration degree and the scores of immune-related functions were significantly increased in the high risk group. The CIBERSORT analysis indicated that the abundance of immune cell were significantly different between two risk groups. Furthermore, The risk score was positively related to the expression of PD-1, CTLA4 and LAG3.These results indicated that patients in the high risk group benefit more from immunotherapy.
Conclusion: We constructed a novel TGF-β signaling-related genes signature that could serve as an promising independent factor for predicting clinical prognosis and immunotherapy responses in ccRCC patients.
Keywords: TGF-β signaling; biomarkers; clear cell renal cell carcinoma; immune infiltration; prognosis signature.
Copyright © 2023 Wu, Xie, Gong, Fu, Chen, Zhou and Luo.
Conflict of interest statement
The authors declare that the research was conducted in the absence of any commercial or financial relationships that could be construed as a potential conflict of interest.
Figures
Similar articles
-
Development and validation of a combined hypoxia- and metabolism-related prognostic signature to predict clinical prognosis and immunotherapy responses in clear cell renal cell carcinoma.Front Oncol. 2023 Nov 10;13:1162846. doi: 10.3389/fonc.2023.1162846. eCollection 2023. Front Oncol. 2023. PMID: 38023248 Free PMC article.
-
A novel oxidative stress-related genes signature associated with clinical prognosis and immunotherapy responses in clear cell renal cell carcinoma.Front Oncol. 2023 Aug 3;13:1184841. doi: 10.3389/fonc.2023.1184841. eCollection 2023. Front Oncol. 2023. PMID: 37601683 Free PMC article.
-
A DNA Damage Repair Gene Signature Associated With Immunotherapy Response and Clinical Prognosis in Clear Cell Renal Cell Carcinoma.Front Genet. 2022 May 17;13:798846. doi: 10.3389/fgene.2022.798846. eCollection 2022. Front Genet. 2022. PMID: 35656315 Free PMC article.
-
Novel amino acid metabolism-related gene signature to predict prognosis in clear cell renal cell carcinoma.Front Genet. 2022 Sep 2;13:982162. doi: 10.3389/fgene.2022.982162. eCollection 2022. Front Genet. 2022. PMID: 36118874 Free PMC article.
-
A new CCCH-type zinc finger-related lncRNA signature predicts the prognosis of clear cell renal cell carcinoma patients.Front Genet. 2022 Sep 30;13:1034567. doi: 10.3389/fgene.2022.1034567. eCollection 2022. Front Genet. 2022. PMID: 36246657 Free PMC article.
Cited by
-
A Novel TGF-β-Related Signature for Predicting Prognosis, Tumor Microenvironment, and Therapeutic Response in Colorectal Cancer.Biochem Genet. 2024 Aug;62(4):2999-3029. doi: 10.1007/s10528-023-10591-7. Epub 2023 Dec 7. Biochem Genet. 2024. PMID: 38062276
-
Transforming growth factor-β (TGF-β) signaling pathway-related genes in predicting the prognosis of colon cancer and guiding immunotherapy.Cancer Pathog Ther. 2023 Dec 12;2(4):299-313. doi: 10.1016/j.cpt.2023.12.002. eCollection 2024 Oct. Cancer Pathog Ther. 2023. PMID: 39371100 Free PMC article.
-
TGFβ in Pancreas and Colorectal Cancer: Opportunities to Overcome Therapeutic Resistance.Clin Cancer Res. 2024 Sep 3;30(17):3676-3687. doi: 10.1158/1078-0432.CCR-24-0468. Clin Cancer Res. 2024. PMID: 38916900 Free PMC article. Review.
-
TGF-β signaling in health, disease, and therapeutics.Signal Transduct Target Ther. 2024 Mar 22;9(1):61. doi: 10.1038/s41392-024-01764-w. Signal Transduct Target Ther. 2024. PMID: 38514615 Free PMC article. Review.
-
PD1/PD-L1 blockade in clear cell renal cell carcinoma: mechanistic insights, clinical efficacy, and future perspectives.Mol Cancer. 2024 Jul 16;23(1):146. doi: 10.1186/s12943-024-02059-y. Mol Cancer. 2024. PMID: 39014460 Free PMC article. Review.
References
-
- Gray RE, Harris GT. Renal cell carcinoma: Diagnosis and management. Am Fam Physician (2019) 99:179–84. - PubMed
LinkOut - more resources
Full Text Sources
Miscellaneous