. 2023 Jan 26:11:1113656.
doi: 10.3389/fcell.2023.1113656. eCollection 2023.

A targeted multi-proteomics approach generates a blueprint of the ciliary ubiquitinome

Affiliations

A targeted multi-proteomics approach generates a blueprint of the ciliary ubiquitinome

Mariam G Aslanyan et al. Front Cell Dev Biol. .

Abstract

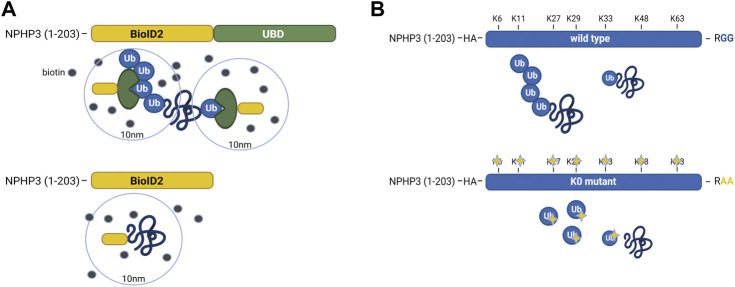
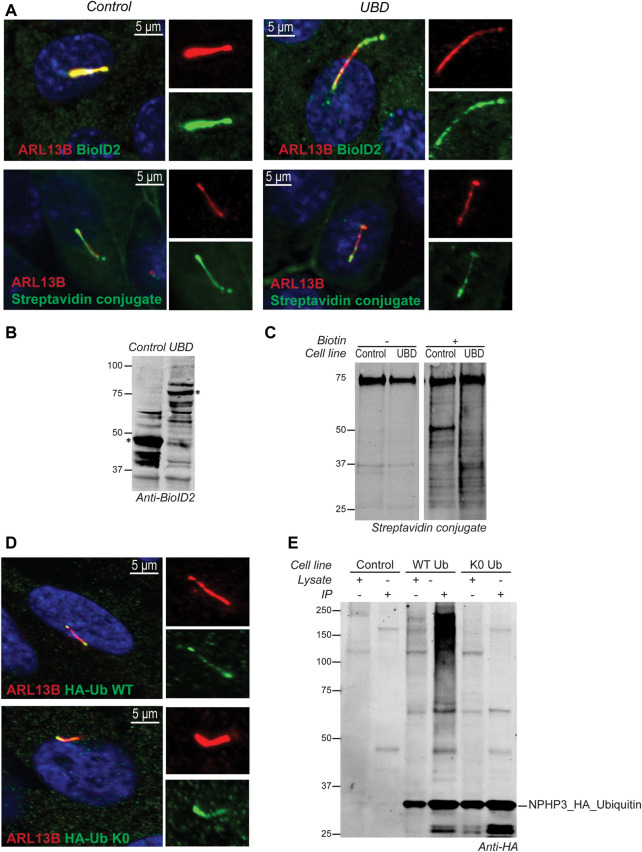
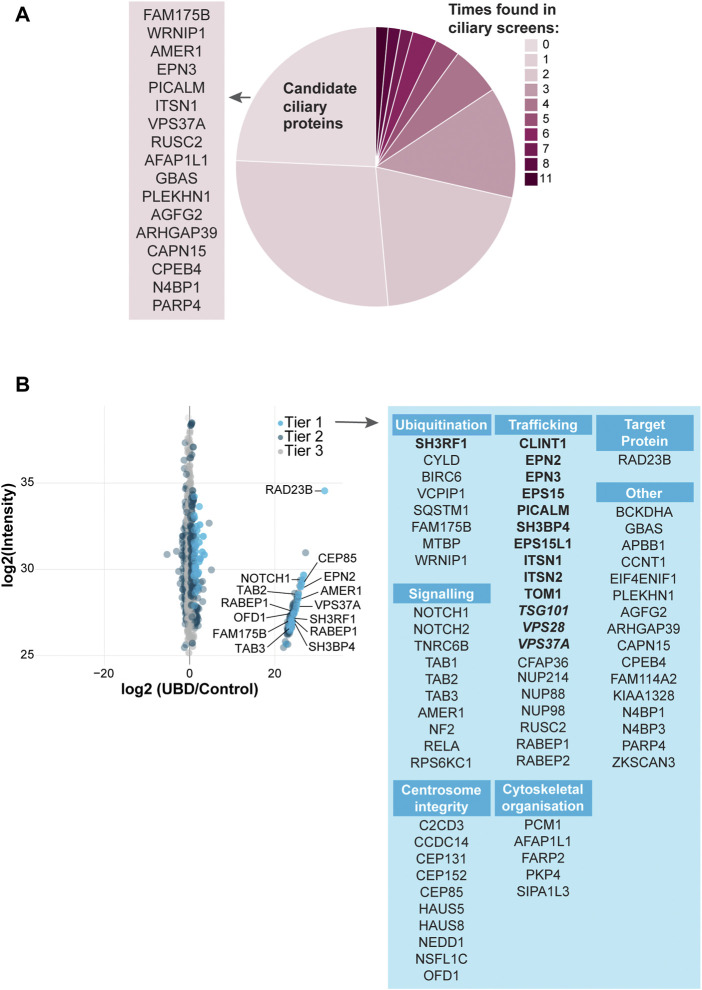
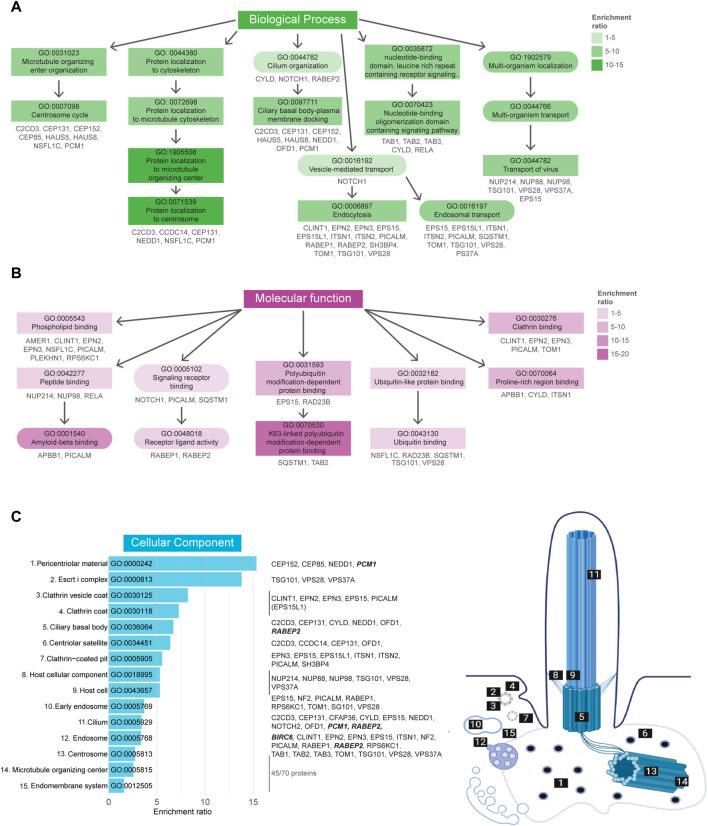
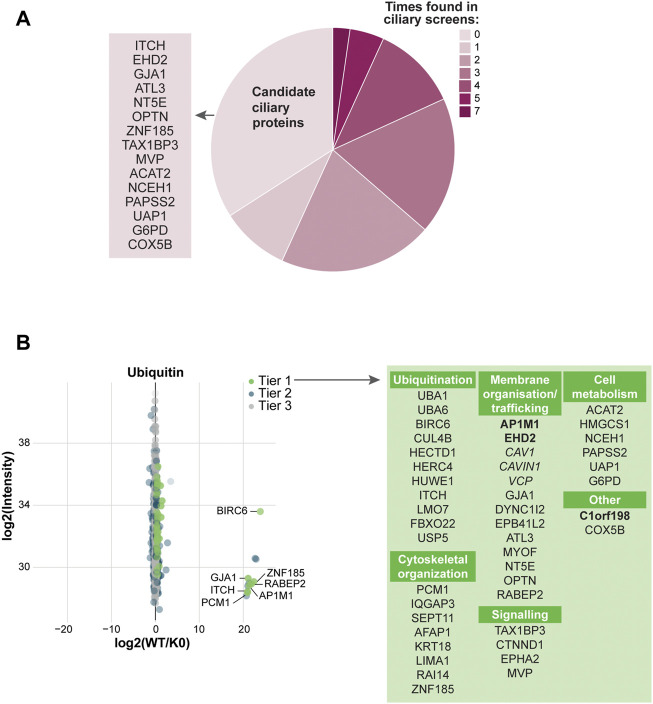
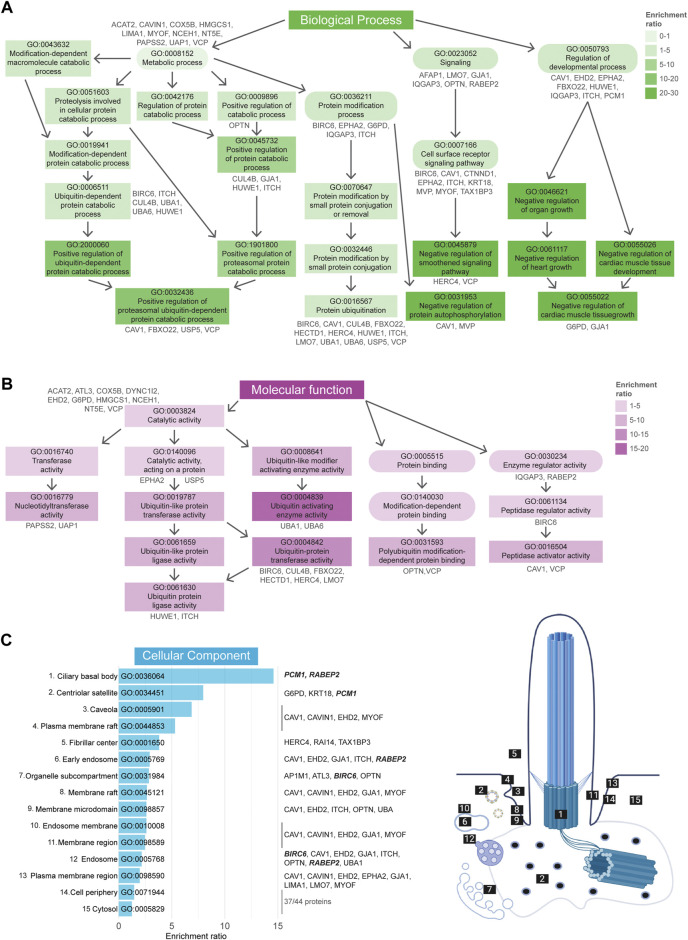
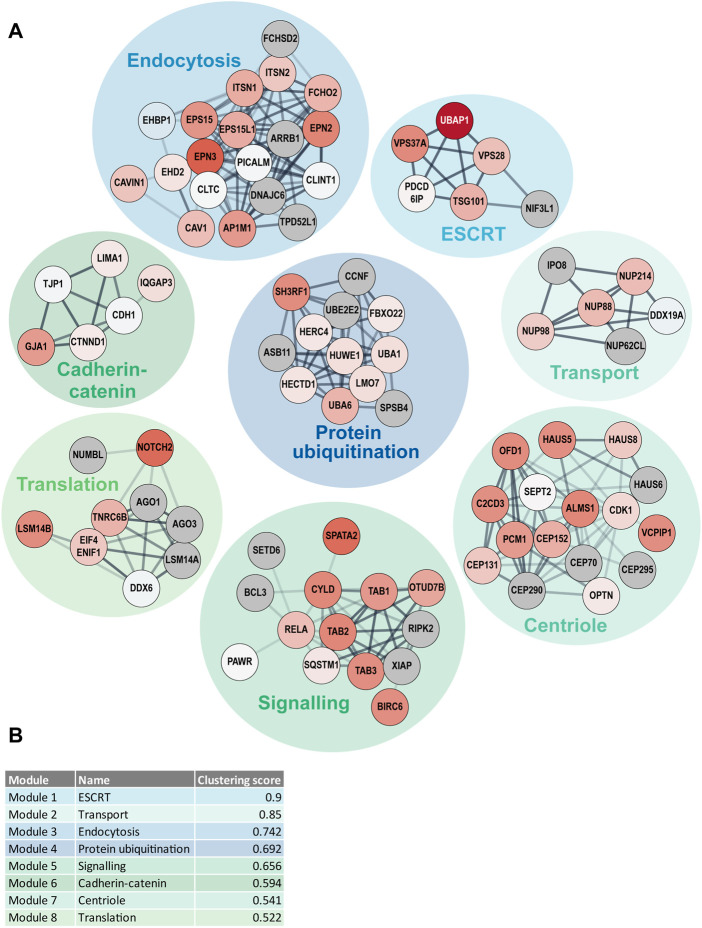
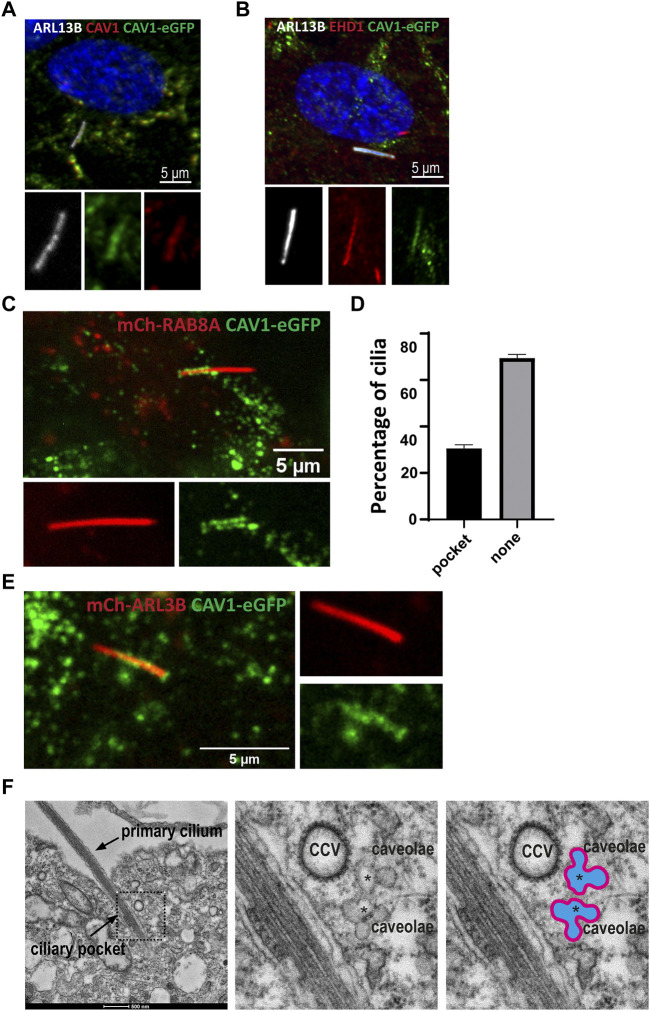
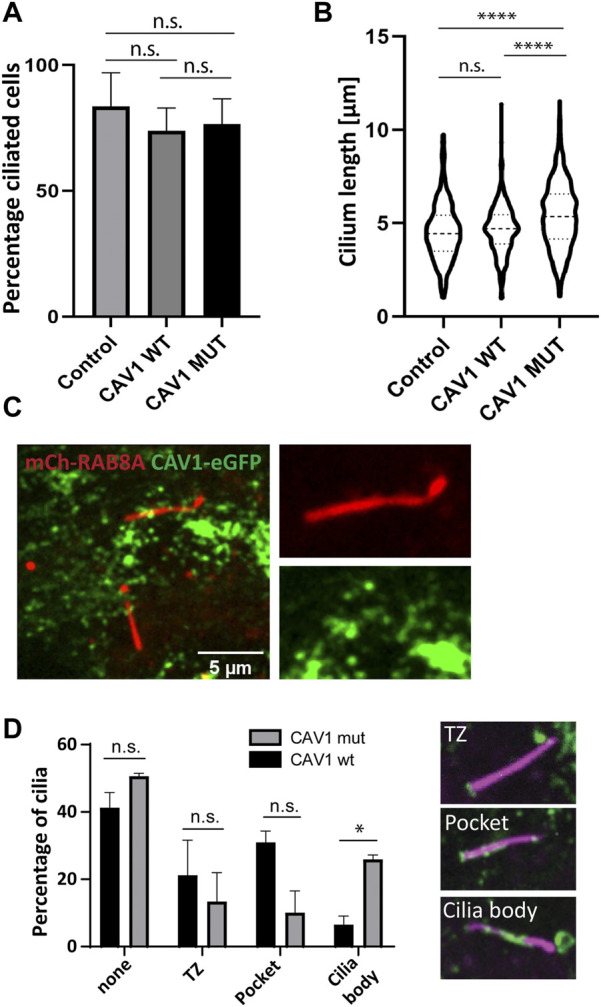
Establishment and maintenance of the primary cilium as a signaling-competent organelle requires a high degree of fine tuning, which is at least in part achieved by a variety of post-translational modifications. One such modification is ubiquitination. The small and highly conserved ubiquitin protein possesses a unique versatility in regulating protein function via its ability to build mono and polyubiquitin chains onto target proteins. We aimed to take an unbiased approach to generate a comprehensive blueprint of the ciliary ubiquitinome by deploying a multi-proteomics approach using both ciliary-targeted ubiquitin affinity proteomics, as well as ubiquitin-binding domain-based proximity labelling in two different mammalian cell lines. This resulted in the identification of several key proteins involved in signaling, cytoskeletal remodeling and membrane and protein trafficking. Interestingly, using two different approaches in IMCD3 and RPE1 cells, respectively, we uncovered several novel mechanisms that regulate cilia function. In our IMCD3 proximity labeling cell line model, we found a highly enriched group of ESCRT-dependent clathrin-mediated endocytosis-related proteins, suggesting an important and novel role for this pathway in the regulation of ciliary homeostasis and function. In contrast, in RPE1 cells we found that several structural components of caveolae (CAV1, CAVIN1, and EHD2) were highly enriched in our cilia affinity proteomics screen. Consistently, the presence of caveolae at the ciliary pocket and ubiquitination of CAV1 specifically, were found likely to play a role in the regulation of ciliary length in these cells. Cilia length measurements demonstrated increased ciliary length in RPE1 cells stably expressing a ubiquitination impaired CAV1 mutant protein. Furthermore, live cell imaging in the same cells revealed decreased CAV1 protein turnover at the cilium as the possible cause for this phenotype. In conclusion, we have generated a comprehensive list of cilia-specific proteins that are subject to regulation via ubiquitination which can serve to further our understanding of cilia biology in health and disease.

Keywords: ESCRT; caveolae; cilia; cilia ubiquitination; ciliary proteostasis; ciliopathies; clathrin-mediated endocytosis.


Conflict of interest statement

The authors declare that the research was conducted in the absence of any commercial or financial relationships that could be construed as a potential conflict of interest.

Figures

FIGURE 1
FIGURE 1
Schematic representation of the UBD-PL and UAP proteomics approaches (A) In IMCD3 cells, the Ubiquitin-binding domain Proximity Labeling (UBD-PL) approach was developed. Using the NPHP3 targeting strategy, the C-terminal ubiquitin-binding domain (UBD) of the RAD23b protein was fused to the BioID2 proximity labeling tag. The RAD23b protein contains a tandem of two UBAs at its C terminus, which were utilized in this study as an indirect bait for polyubiquitinated substrates. These polyubiquitinated targets will become biotinylated when they come into proximity with the BioID2 tag, which promiscuously attaches biotin moieties to primary amines within an estimated radius of 10 nm. As a control, an NPHP3 (1-203)-targeted BioID2 recombinant protein was used. (B) For the Ubiquitin Affinity Proteomics (UAP) approach in RPE1 cells, the NPHP3 ciliary targeting sequence was fused to either wild type (WT) ubiquitin, or a lysine-less ubiquitination-impaired K0 ubiquitin mutant which is unable to bind substates, as the C-terminal Gly residues were mutated to Ala. To facilitate affinity purification and visualization in cells, the hemagglutinin (HA) tag was included at the N-terminus of ubiquitin in both recombinant proteins. The ubiquitination-impaired K0 will not be able to bind nor substrates, nor ubiquitin.
FIGURE 2
FIGURE 2
Validation of model systems to study the ciliary ubiquitinome. (A) IF localization of the UBD and empty vector control BioID2 constructs in stable IMCD3 Flp-In cells. Both proteins colocalized with ARL13B (red) at the primary cilium when co-stained with an antibody against the BioID2 tag (green; upper panels). Upon initiation of proximity labeling, biotinylated substrates can be detected in the cilium (red) using a conjugated Streptavidin antibody (green; lower panels). (B) A western blot stained with anti-BioID2 was used to verify correct expression of both constructs in whole cell extracts of IMCD3 Flp-In cells. (C) Immunoprecipitation upon addition of biotin showed a ladder of biotinylated proximal targets in both control and UBD cells when labeled with a conjugated Streptavidin antibody. (D) IF analysis of stably transfected RPE1 cells confirmed that both the wild type ubiquitin (HA-Ub WT), as well as the ubiquitination impaired mutant (HA-Ub K0) detected using an anti-HA staining (green) colocalized with ARL13B (red) at the primary cilium. (E) Immunoblotting using an anti-HA antibody indicated that both ubiquitin variants were expressed correctly compared to untransfected control cells. The recombinant proteins and their respective interactors could successfully be purified from lysates by immunoprecipitation. Furthermore, as expected, the immunoprecipitated HA- Ub WT also showed a characteristic smear of ubiquitinated substrates at high molecular weight which was not observed for the ubiquitination impaired HA- Ub K0 mutant demonstrating that polyubiquitin chain formation is not impeded in the HA-Ub WT cells.
FIGURE 3
FIGURE 3
Analysis of UBD mass spectrometry results (A) Comparison of the significantly enriched proteins from tier 1 with published ciliary-datasets. Most proteins were previously identified in other ciliary studies, of which OFD1, C2CD3, PCM1, CEP131, and SQSTM1 were identified most often (dark pink). The remaining proteins are indicated as “New candidate ciliary proteins” on the left of the pie plot (B) MS analysis of enriched proteins in the UBD versus the control cell line after proximity labelling. The proteins are colored according to their significance tier. All Tier 1 significant proteins were grouped by function (light blue), for which the clathrin-related proteins (bold) and ESCRT proteins (bold italic) are highlighted. The complete list of identified proteins (Tier 1, 2, and 3) can be found in Supplementary Table S1.
FIGURE 4
FIGURE 4
Gene Ontology enrichment analysis of UBD dataset. (A) GO term enrichment for biological processes (BP) colored by their enrichment ratio. The 11 most enriched BP terms (Fisher’s exact test value ≤9.5E-5) are displayed (square) along with supporting GO terms (circle). Arrows indicate the related terms and the genes per term are indicated in grey. All upstream terms also include the genes from their downstream terms. (B) GO term enrichment analysis for molecular functions (MF) of which the 8 most enriched terms (Fisher’s exact test value ≤5.5E-3) are displayed as in (B). (C) The 15 most enriched terms (Fisher’s exact test value ≤7.5E-4) of the cellular components (CC) GO term enrichment analysis are displayed, ordered by their enrichment ratio. The cellular position of these terms and their related proteins are indicated on the right. The terms “Host cellular component” and “Host cell” do not directly refer to a ciliary localization, while their related proteins do (dashed line). The proteins related to the terms ‘Microtubule organizing center’ and ‘Endomembrane system’ were not indicated, as there were too many to clearly display, however a complete list of proteins can be found in Supplementary Table S1. Proteins indicated in bold italic letters were shared hits between UBD-PL and UAP.
FIGURE 5
FIGURE 5
Analysis of UAP mass spectrometry results (A) Comparison of the significantly enriched proteins with our ciliary database. Most proteins were previously identified in other ciliary screens, of which PCM1, VCP, and DYNC1I2 were identified most often (dark pink). The remaining proteins are indicated as ‘Candidate ciliary proteins’ on the left (B) MS analysis of the enriched proteins for the WT ubiquitin versus the K0 ubiquitin variant. Proteins are colored according to their significance tier and all Tier 1 significant proteins were grouped by function (green). The proteins related to clathrin-mediated endocytosis (bold) and non-clathrin-mediated endocytosis (italic) are marked. The complete list of identified proteins can be found in Supplementary Table S2.
FIGURE 6
FIGURE 6
Gene Ontology enrichment analysis of UAP dataset. (A) GO term enrichment for biological processes (BP) colored by their enrichment ratio. The 19 most enriched terms (Fisher’s exact test value ≤1.5E-3) are displayed (square) along with supporting GO terms (circle). Arrows indicate the associated terms and the genes per term are indicated in grey. All upstream terms also include the genes from the related downstream terms. (B) GO term enrichment analysis for molecular functions (MF) for which all 13 significantly enriched MF terms (Fisher’s exact test value ≤0.05) are displayed as in (A). (C) All 15 significantly enriched terms (Fisher’s exact test value ≤0.05) of the cellular components (CC) GO term enrichment analysis are displayed, ordered by their enrichment ratio. The cellular position of these terms and their related proteins are indicated on the right. The term “Fibrillar center” refers to the nuclear region involved in transcription of ribosomal RNA, however the genes associated here with this term were also shown to localize to the cilia (dashed line). The same applied for the terms “Cell periphery” and “Cytosol”, for which the related genes were not indicated, as there were too many to clearly display. Proteins indicated in bold italic letters were shared hits between UBD-PL and UAP. Non-etheless, a complete list of proteins can be found in Supplementary Table S2.
FIGURE 7
FIGURE 7
DOMINO active network identification (A) DOMINO was used to identify active subnetworks in the combined data from the UBD-PL and UAP approaches. The node colors indicate the enrichment ratios from depleted (blue) to highly enriched (dark red) proteins. Grey nodes indicate proteins that were not detected in either of our approaches. The edge thickness was determined by the STRING confidence score and the edge transparency displays the edge betweenness. (B) The modules were ranked in accordance with their clustering score. Module names indicate the most enriched GO terms. A full list of all enriched GO-terms per module can be found in Supplementary Table S3.
FIGURE 8
FIGURE 8
Dynamic CAV1 localization at the ciliary pocket (A) A stable RPE1Flp-In cell line expressing eGFP-tagged CAV1 was generated for live cell imaging purposes. The recombinant CAV1 (green) colocalizes with both endogenous CAV1 stained with an anti-CAV1 antibody (red) and the ciliary marker ARL13B (white) (B) The ciliary pocket marker EHD1 (red) colocalizes with CAV1 (green) and the ciliary protein ARL13B (white). (C) RPE1 CAV1-eGFP cells stably expressing RAB8A-mCherry underwent live imaging (5–20 min) showing dynamic accumulation of CAV1-eGFP at the cilia pocket. This is a single time frame representation (D) Quantification of CAV1-eGFP ciliary localization from time frame images as in C (n = 75). (E) Single time frame of RPE1 CAV1-eGFP cells stably expressing ARL13B-mCherry shows similar cilia localization as in (C). (F) Representative TEM micrograph of a primary cilium in RPE1 cells serum-starved for 48 h and processed for TEM. Clusters of interconnected caveolae (asterisks) and clathrin coated vesicles (CCV) are found close to the ciliary pocket and the base of the primary cilium.
FIGURE 9
FIGURE 9
Ciliary length but not ciliation affected in CAV1 mutant lines. Three biological replicates and three technical replicates were imaged in order to determine ciliation levels and ciliary length in RPE1 Flp-In cells stably expressing eGFP-tagged CAV1 wild-type (CAV1 WT), or a CAV1 ubiquitination-impaired mutant (CAV1 MUT), and an untransfected control (Control). ARL13B was used as a marker for the ciliary length. The ALPACA tool was used to quantify both parameters. (A) The levels of ciliation between the three lines did not differ significantly. The percentage of ciliated cells was as follows: Control - 83%, CAV1 WT - 73%, and CAV1 MUT - 76%. Error bars indicate mean with SD. (B) A significant difference (p < 0.0001) in cilia length was observed between the CAV1 MUT (cilia counted = 589), as compared to both the CAV1 WT (cilia counted = 422) and Control lines (cilia counted = 341). The latter did not differ from each other significantly. (C) A single time frame from live cell imaging of RPE1 CAV1-eGFP MUT cells stably expressing RAB8A-mCherry. (D) Comparison of CAV1-eGFP WT and CAV-eGFP MUT cilia localization imaged as in (C). Total of 78 (WT) or 77 (MUT) cilia were imaged and quantified. Localization was classified as shown: none for no cilia association, TZ for transition zone only localization, Pocket localization includes the transition zone and the pocket, and Body for lump-like localization on the ciliary body (as seen in C). Significance based on p < 0.05.

References

    1. Airik R., Schueler M., Airik M., Cho J., Ulanowicz K. A., Porath J. D., et al. (2016). SDCCAG8 interacts with RAB effector proteins RABEP2 and ERC1 and is required for hedgehog signaling. Plos One 11 (5), e0156081. 10.1371/journal.pone.0156081 - DOI - PMC - PubMed
    1. Alexa A., Rahnenfuhrer J. (2020). topGO: Enrichment analysis for gene ontology.
    1. Anvarian Z., Mykytyn K., Mukhopadhyay S., Pedersen L. B., Christensen S. T. (2019). Cellular signalling by primary cilia in development, organ function and disease. Nat. Rev. Nephrol. 15 (4), 199–219. 10.1038/s41581-019-0116-9 - DOI - PMC - PubMed
    1. Ariotti N., Parton R. G. (2013). Snapshot: Caveolae, caveolins, and cavins. Cell. 154 (3), 704–704.e1. 10.1016/j.cell.2013.07.009 - DOI - PubMed
    1. Ashburner M., Ball C. A., Blake J. A., Botstein D., Butler H., Cherry J. M., et al. (2000). Gene ontology: Tool for the unification of biology. The gene ontology consortium. Nat. Genet. 25 (1), 25–29. 10.1038/75556 - DOI - PMC - PubMed