. 2022 Sep;1(9):817-829.
doi: 10.1038/s44161-022-00117-6. Epub 2022 Aug 29.

Integrated landscape of cardiac metabolism in end-stage human nonischemic dilated cardiomyopathy

Affiliations

Integrated landscape of cardiac metabolism in end-stage human nonischemic dilated cardiomyopathy

Emily Flam et al. Nat Cardiovasc Res. 2022 Sep.

Abstract

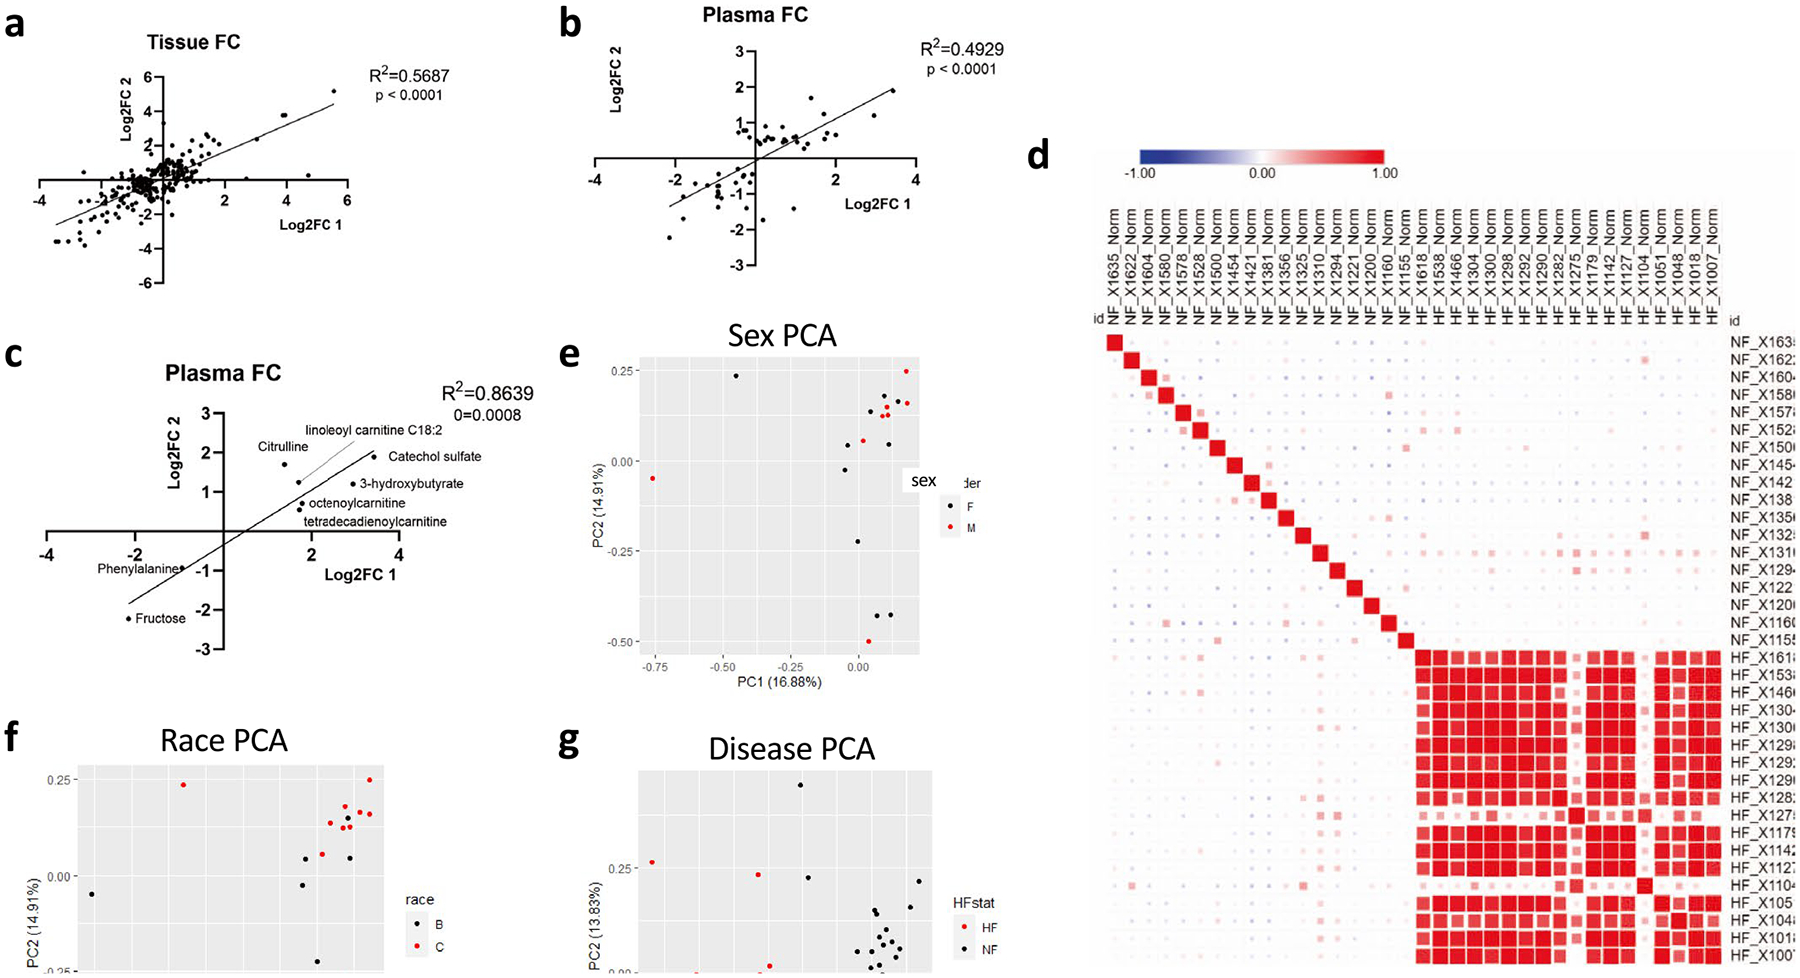
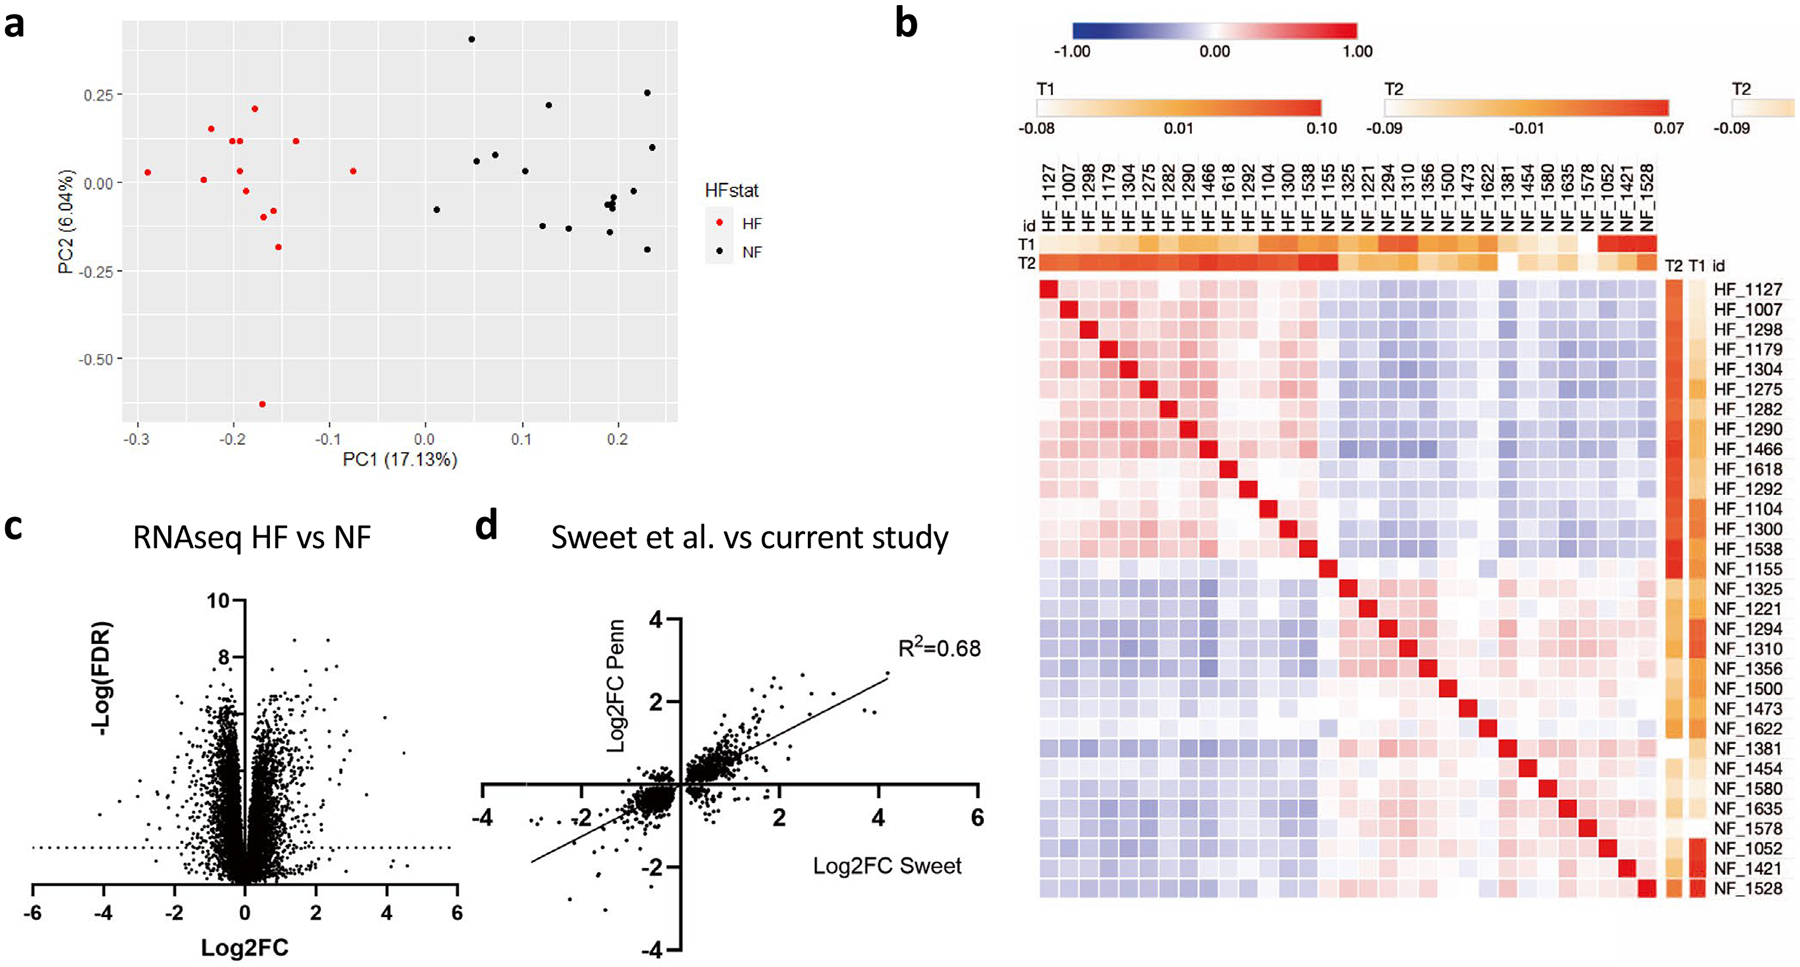
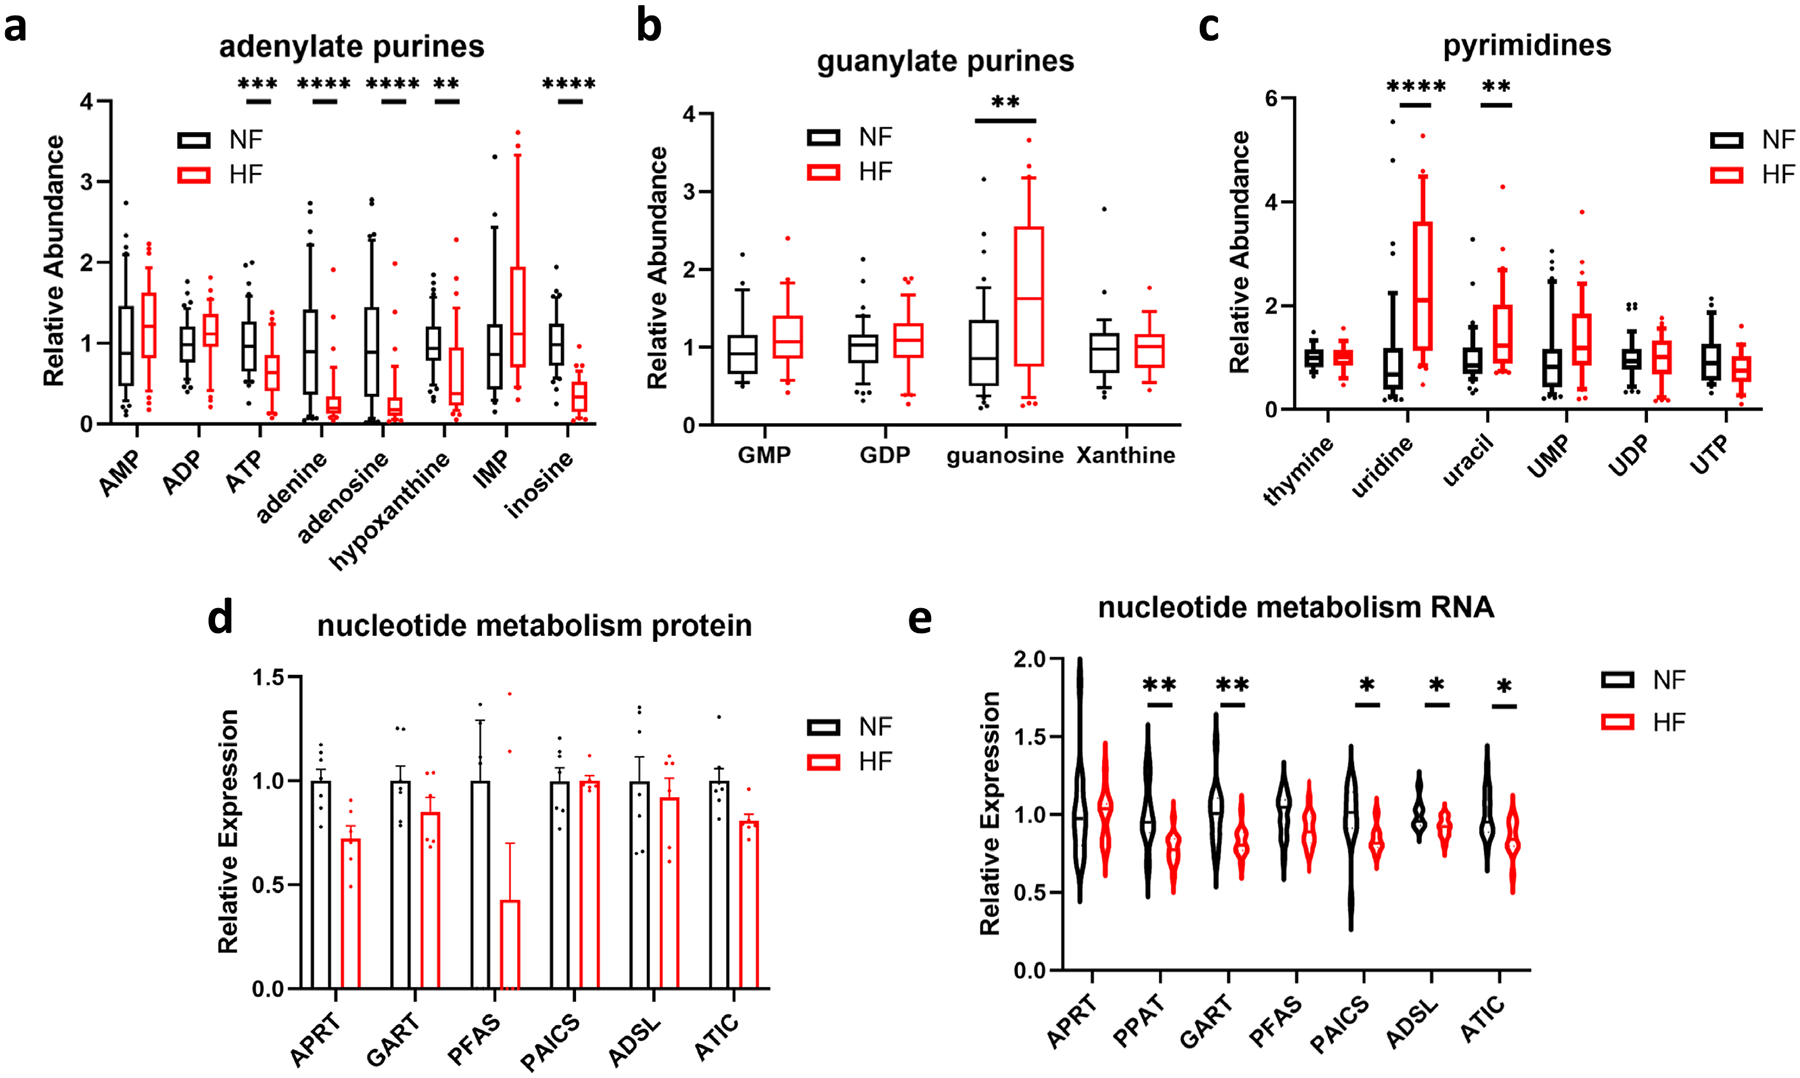
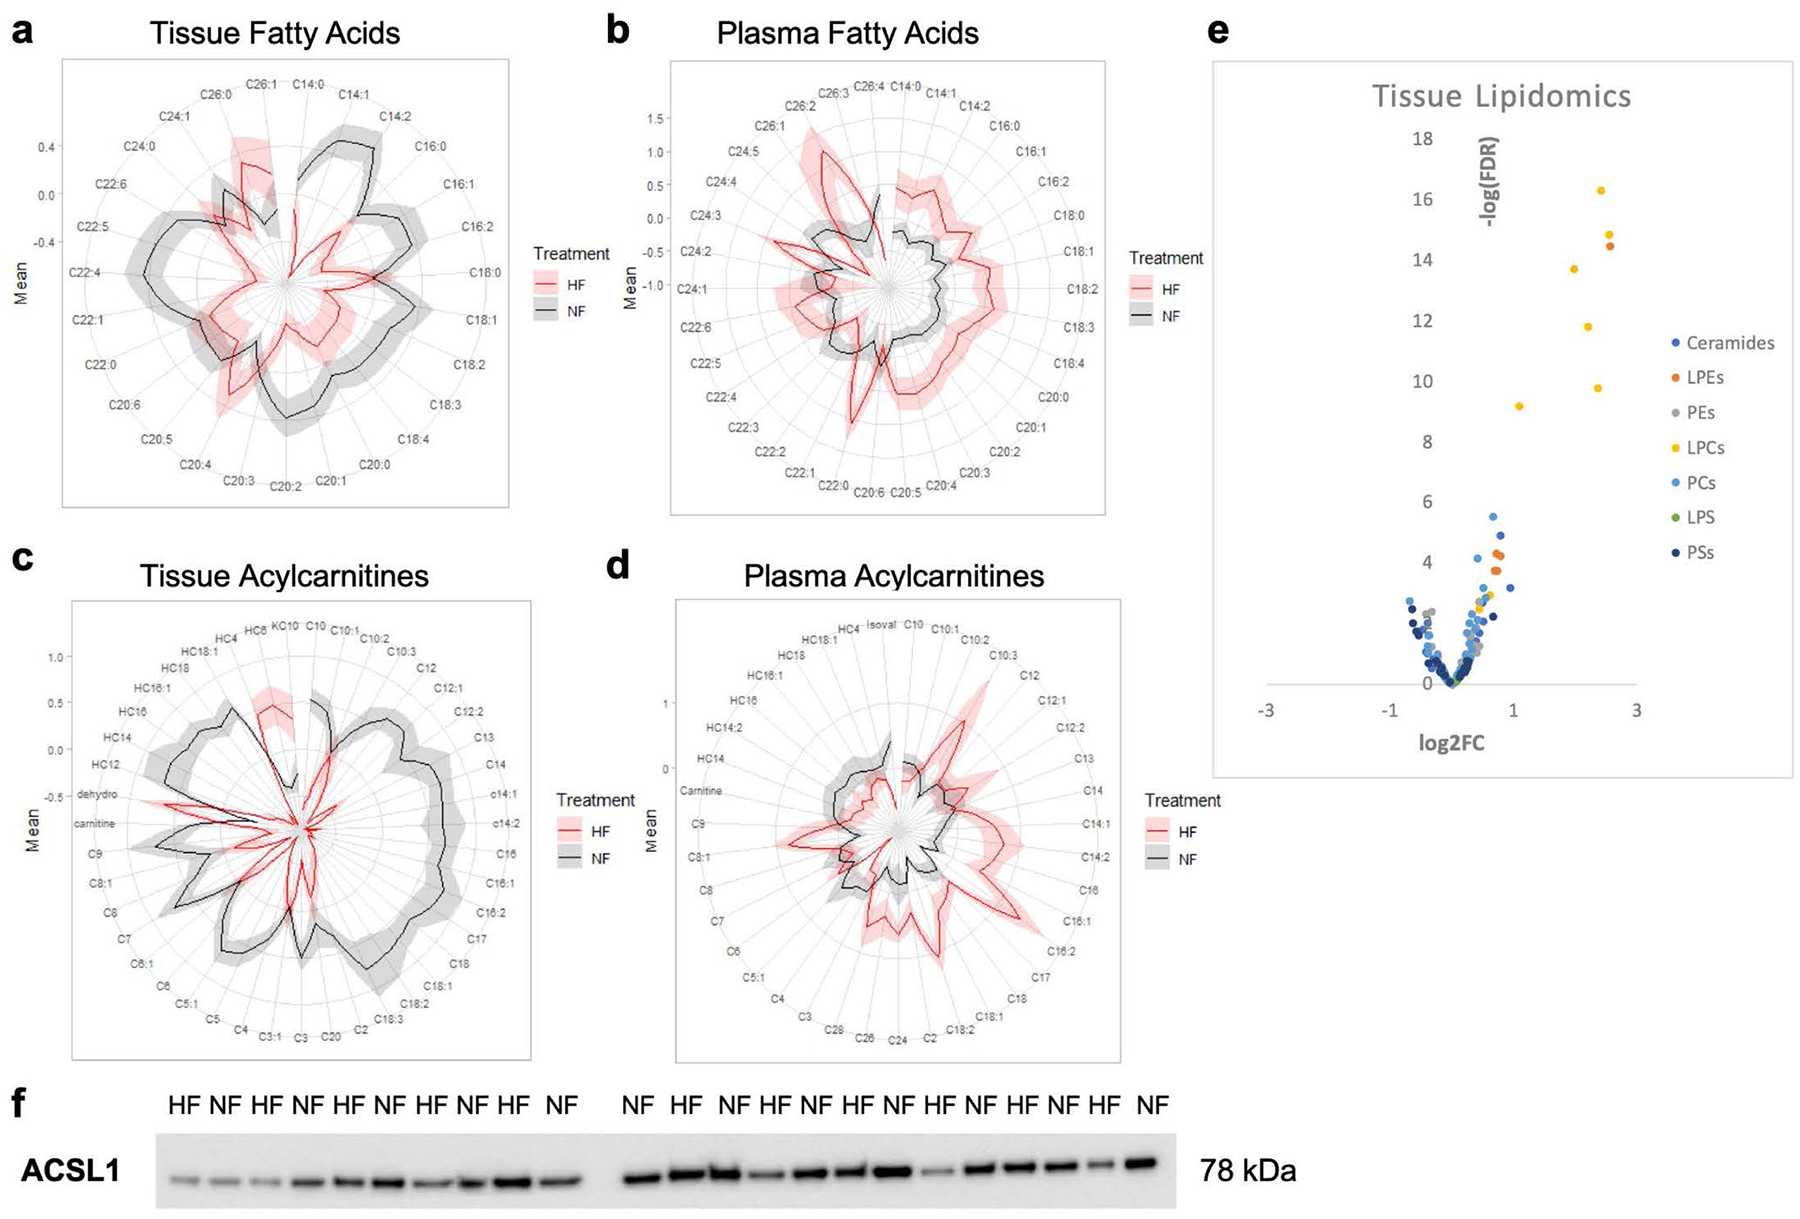
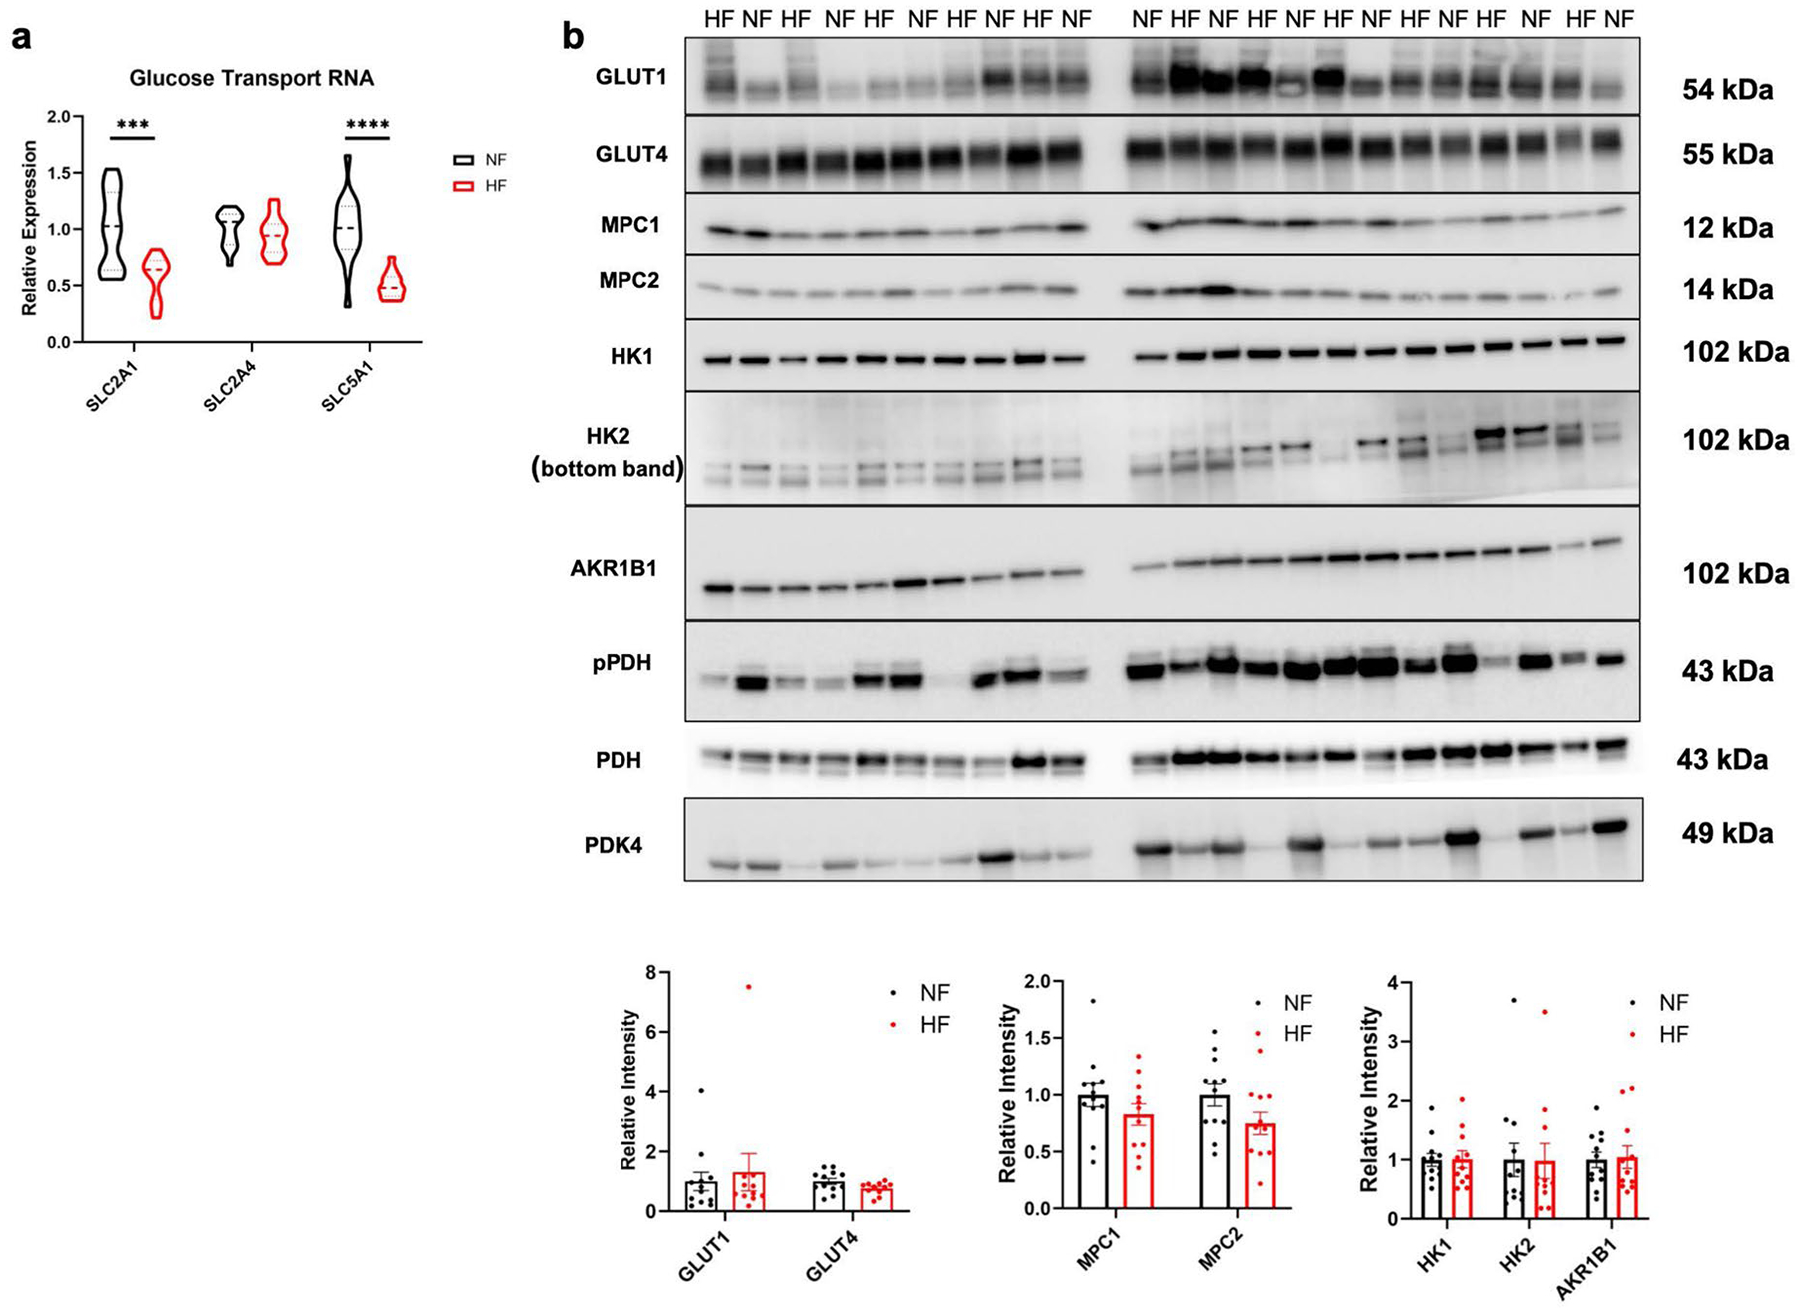
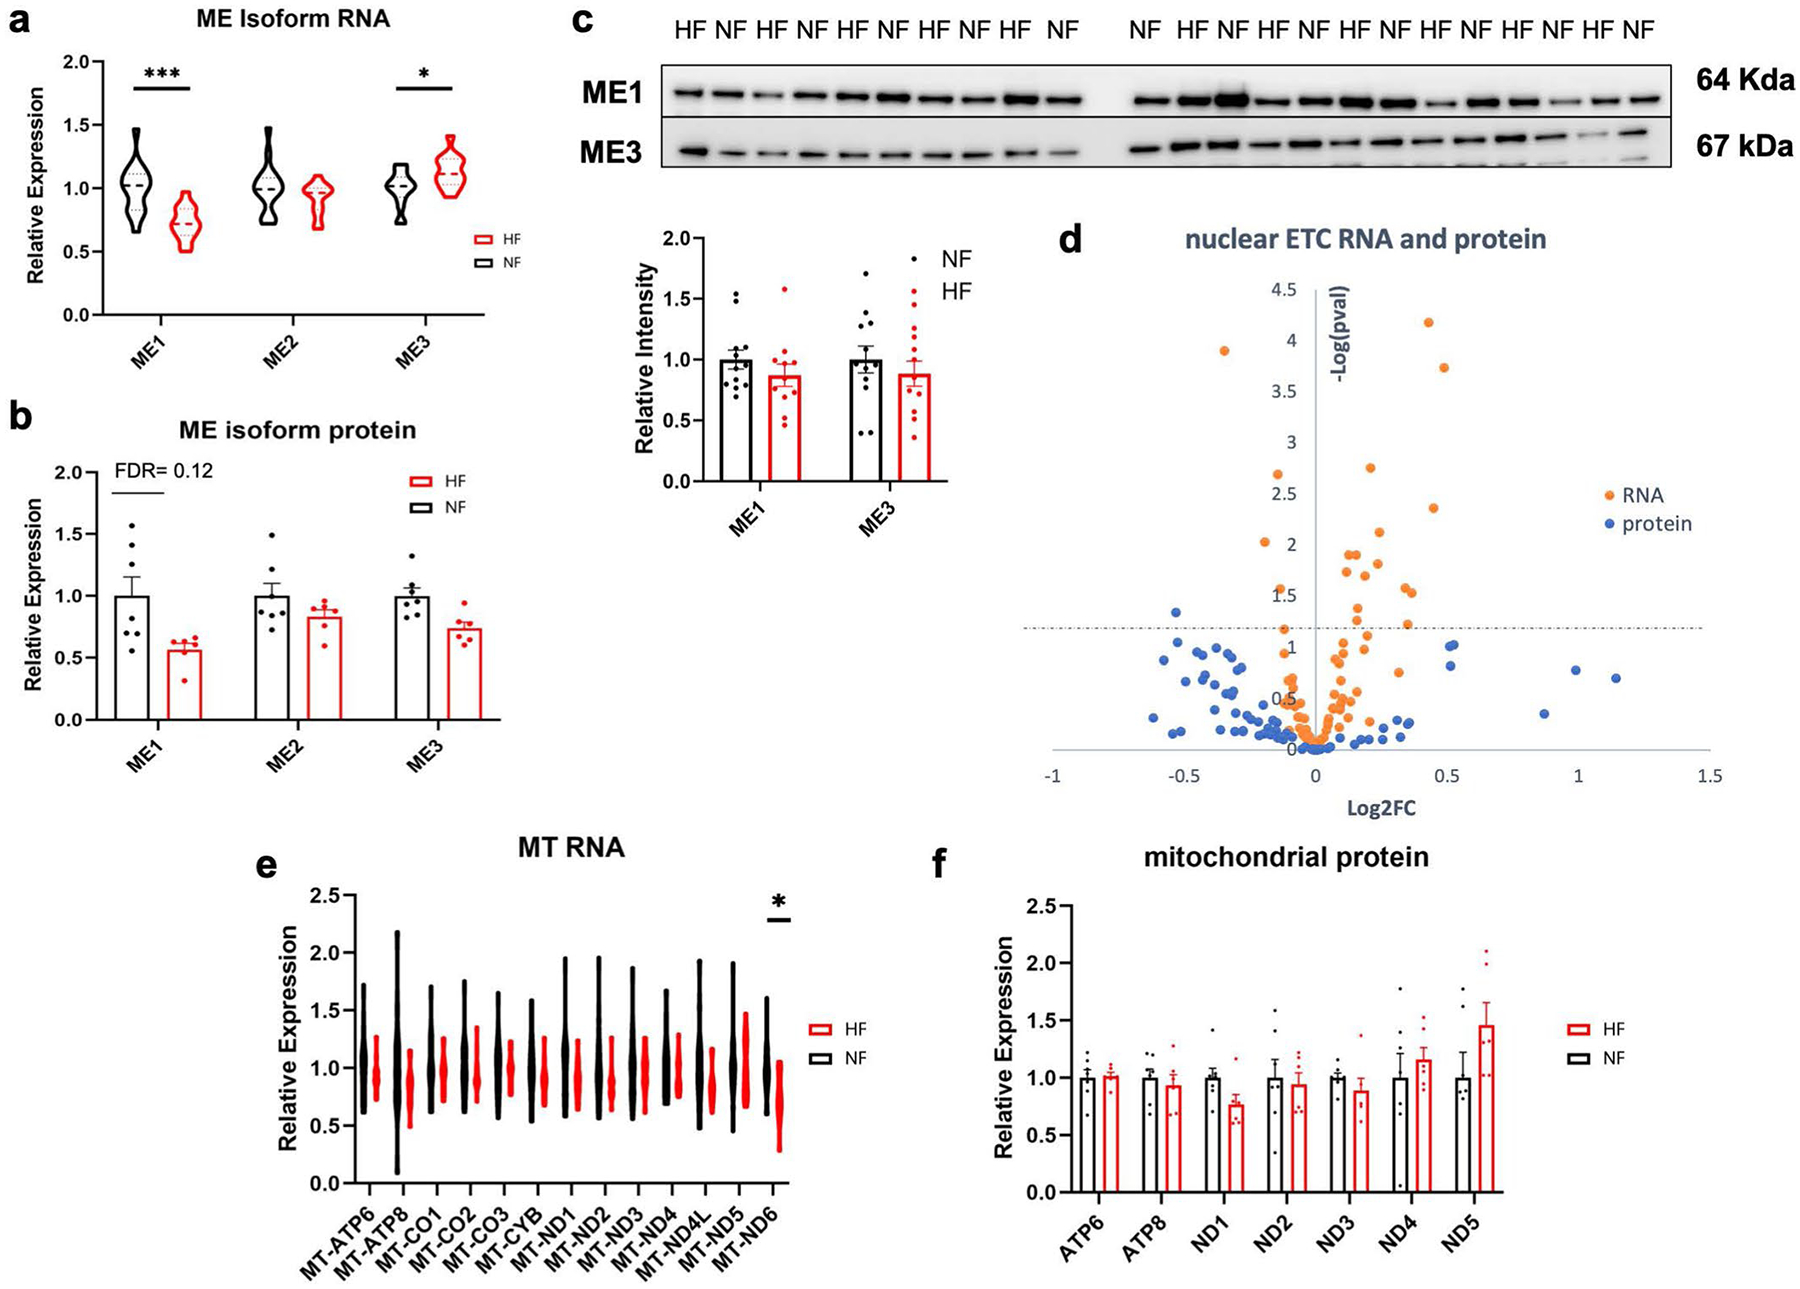
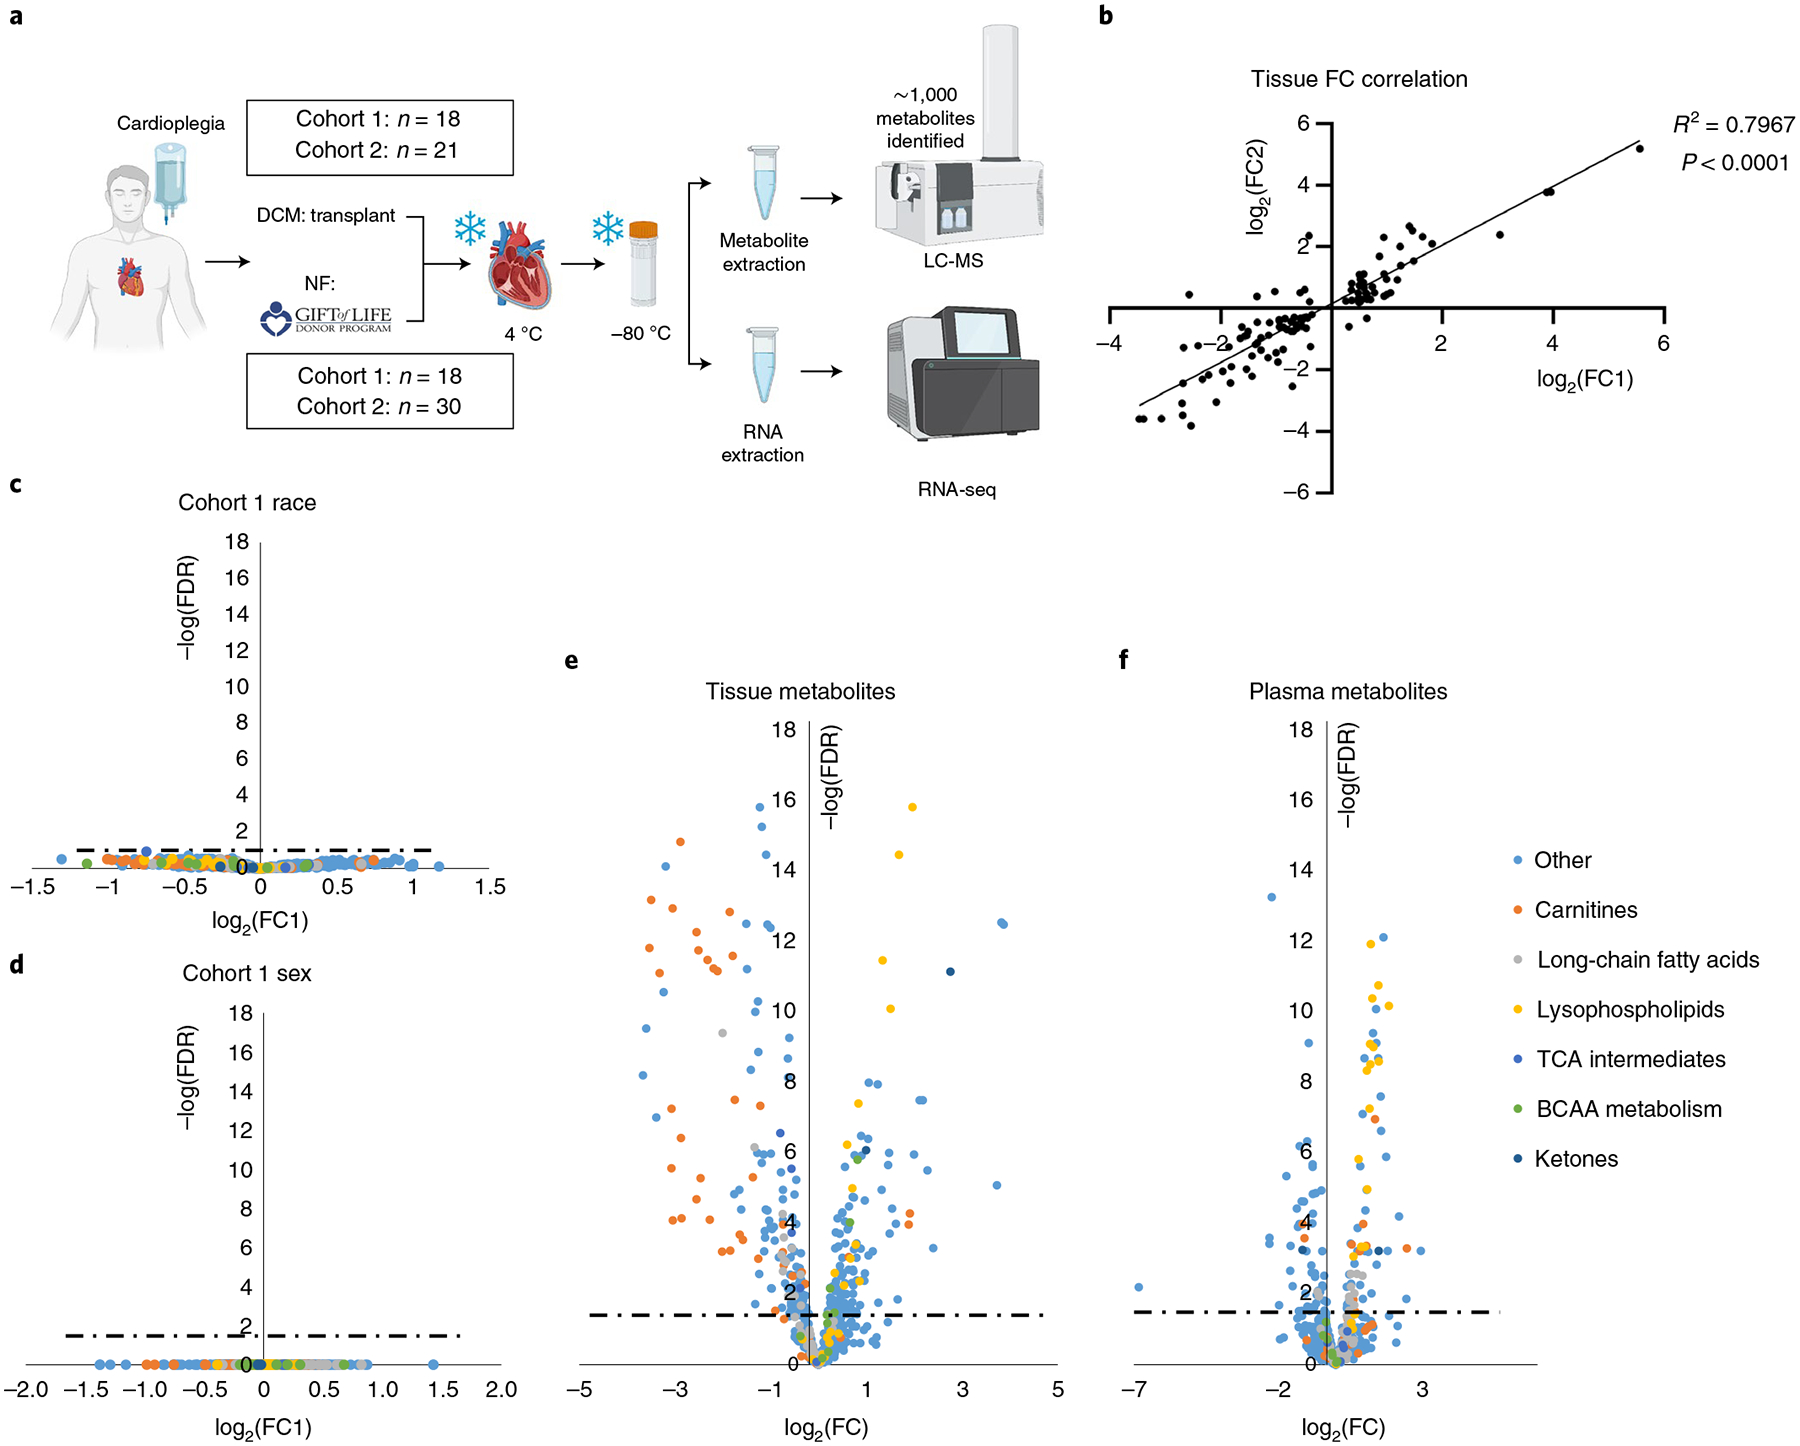
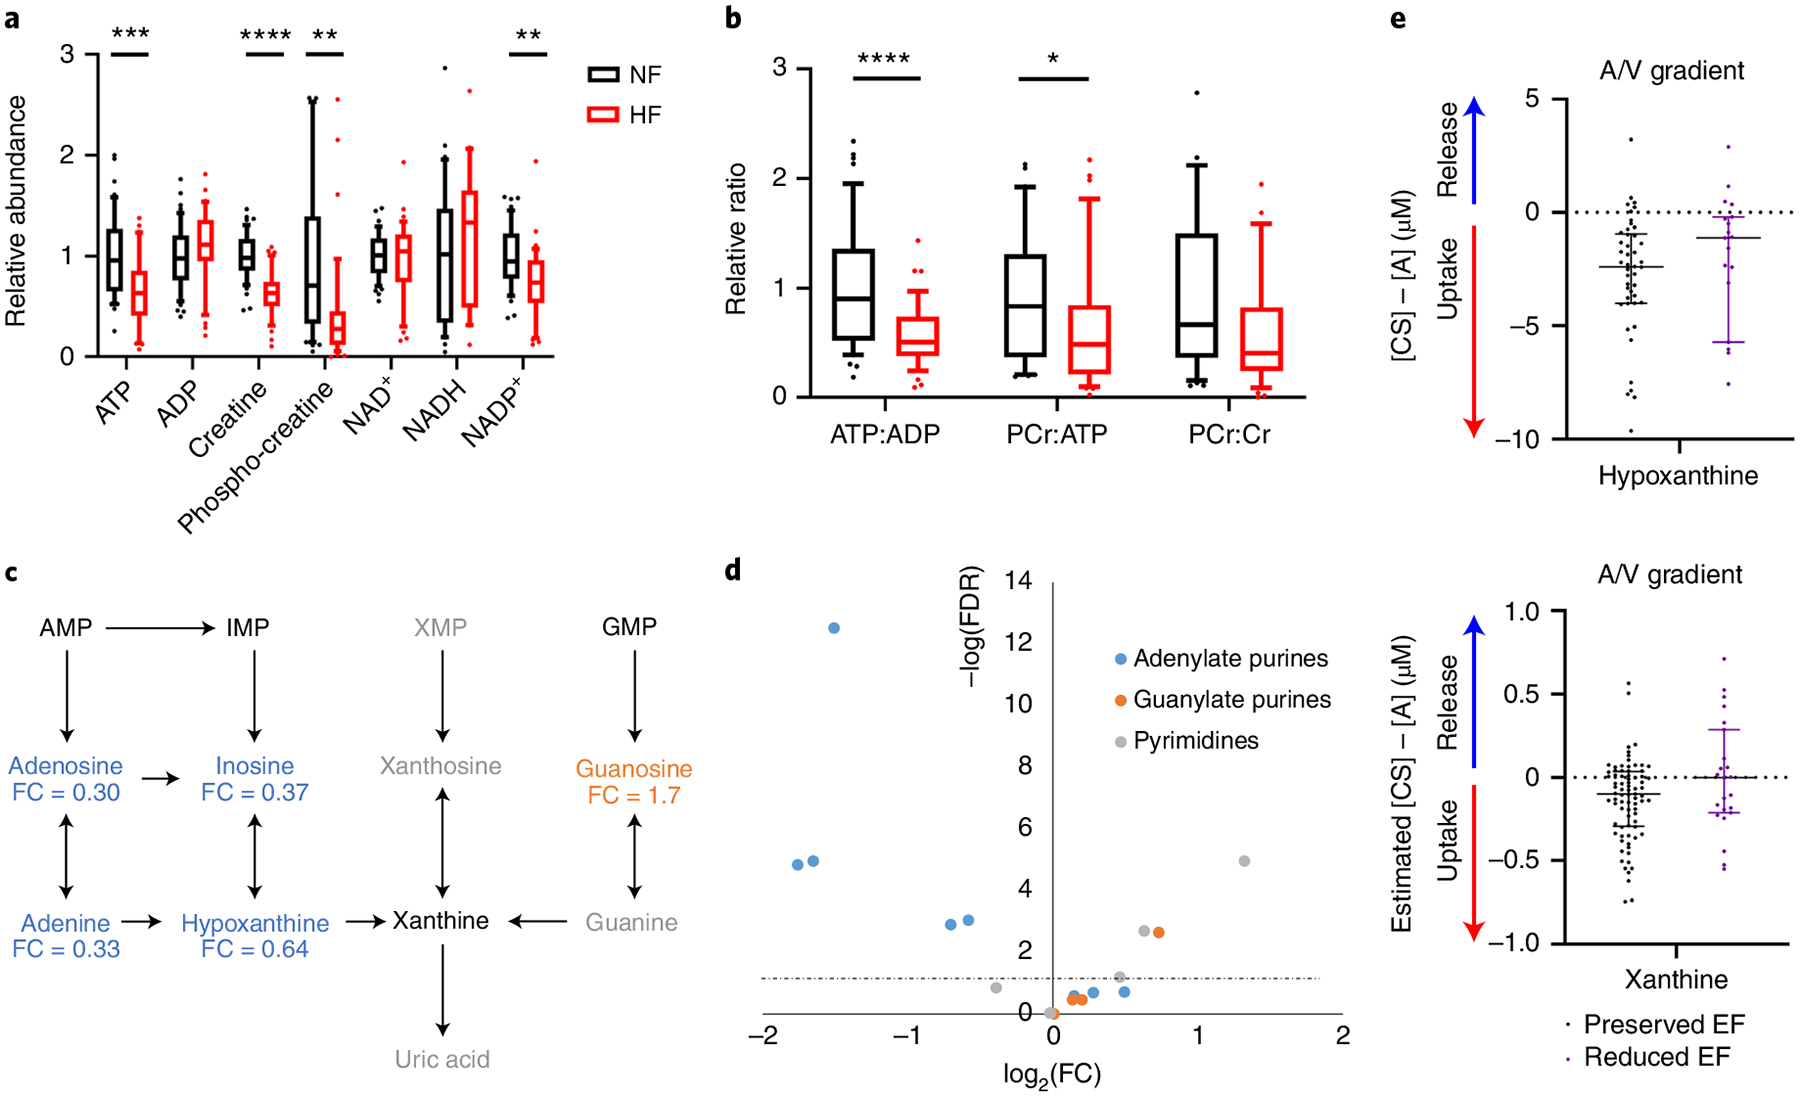
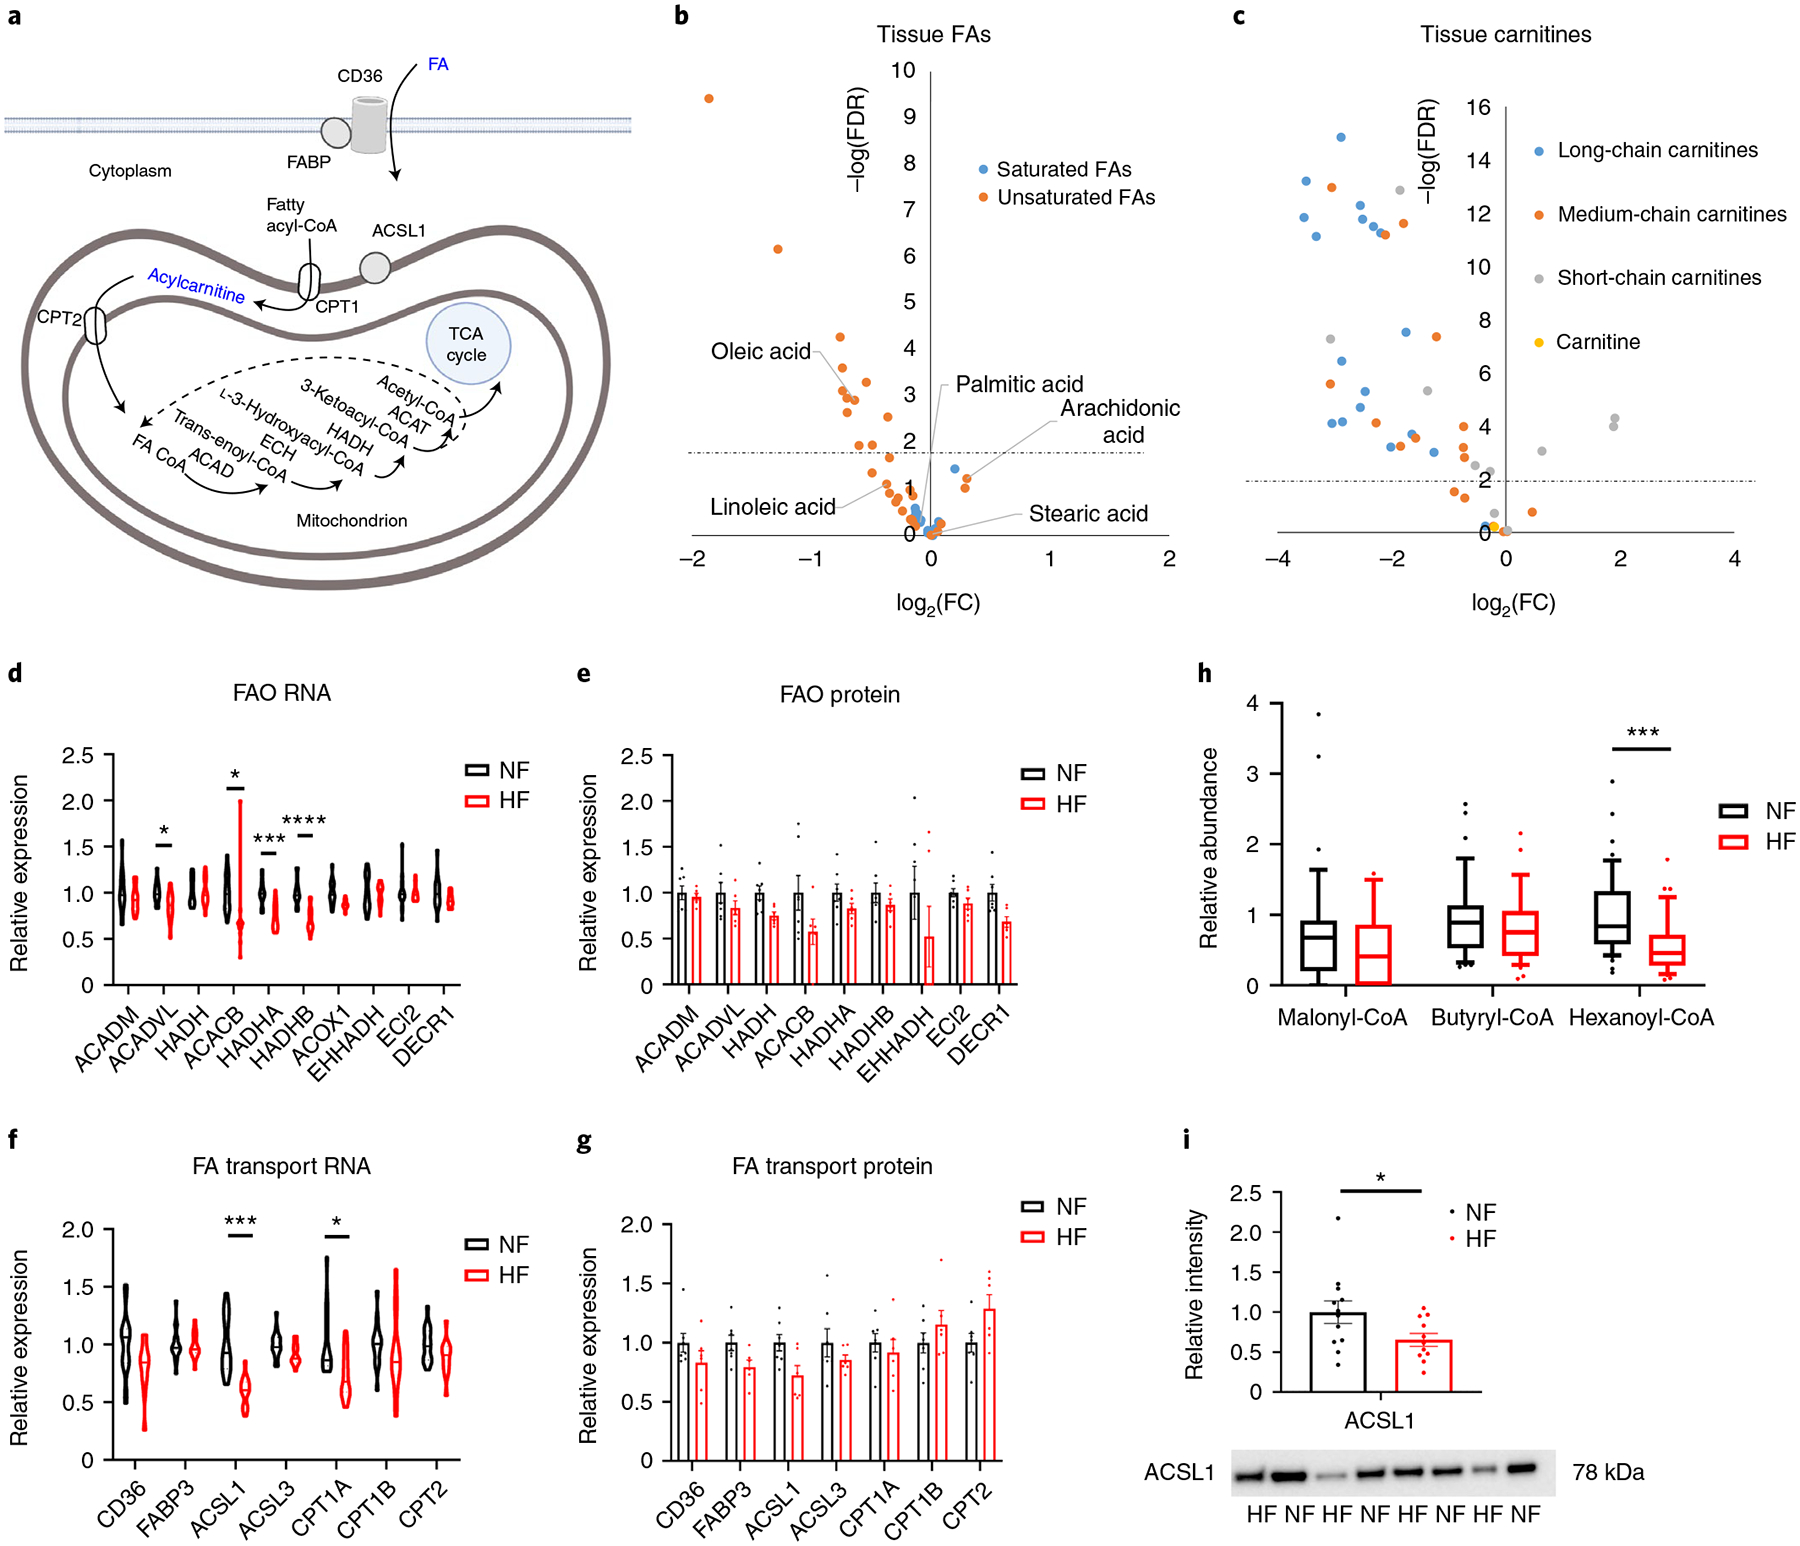
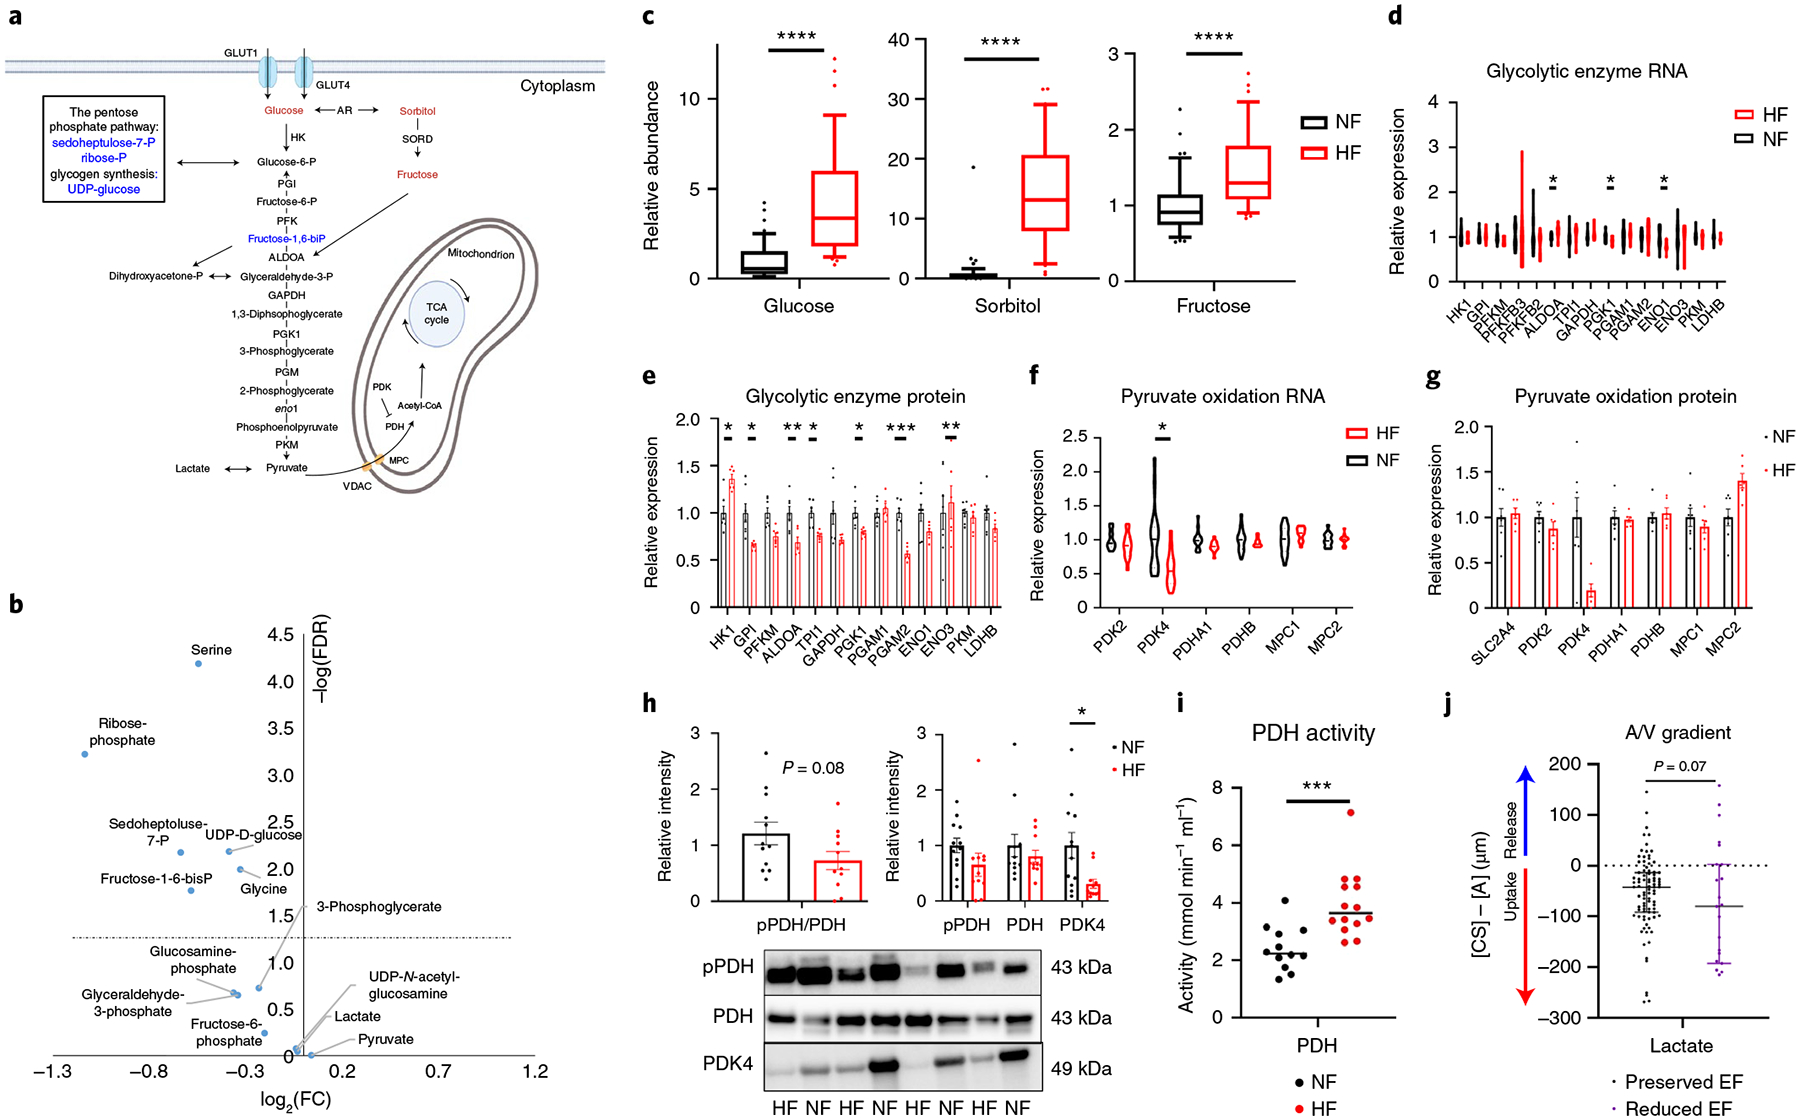
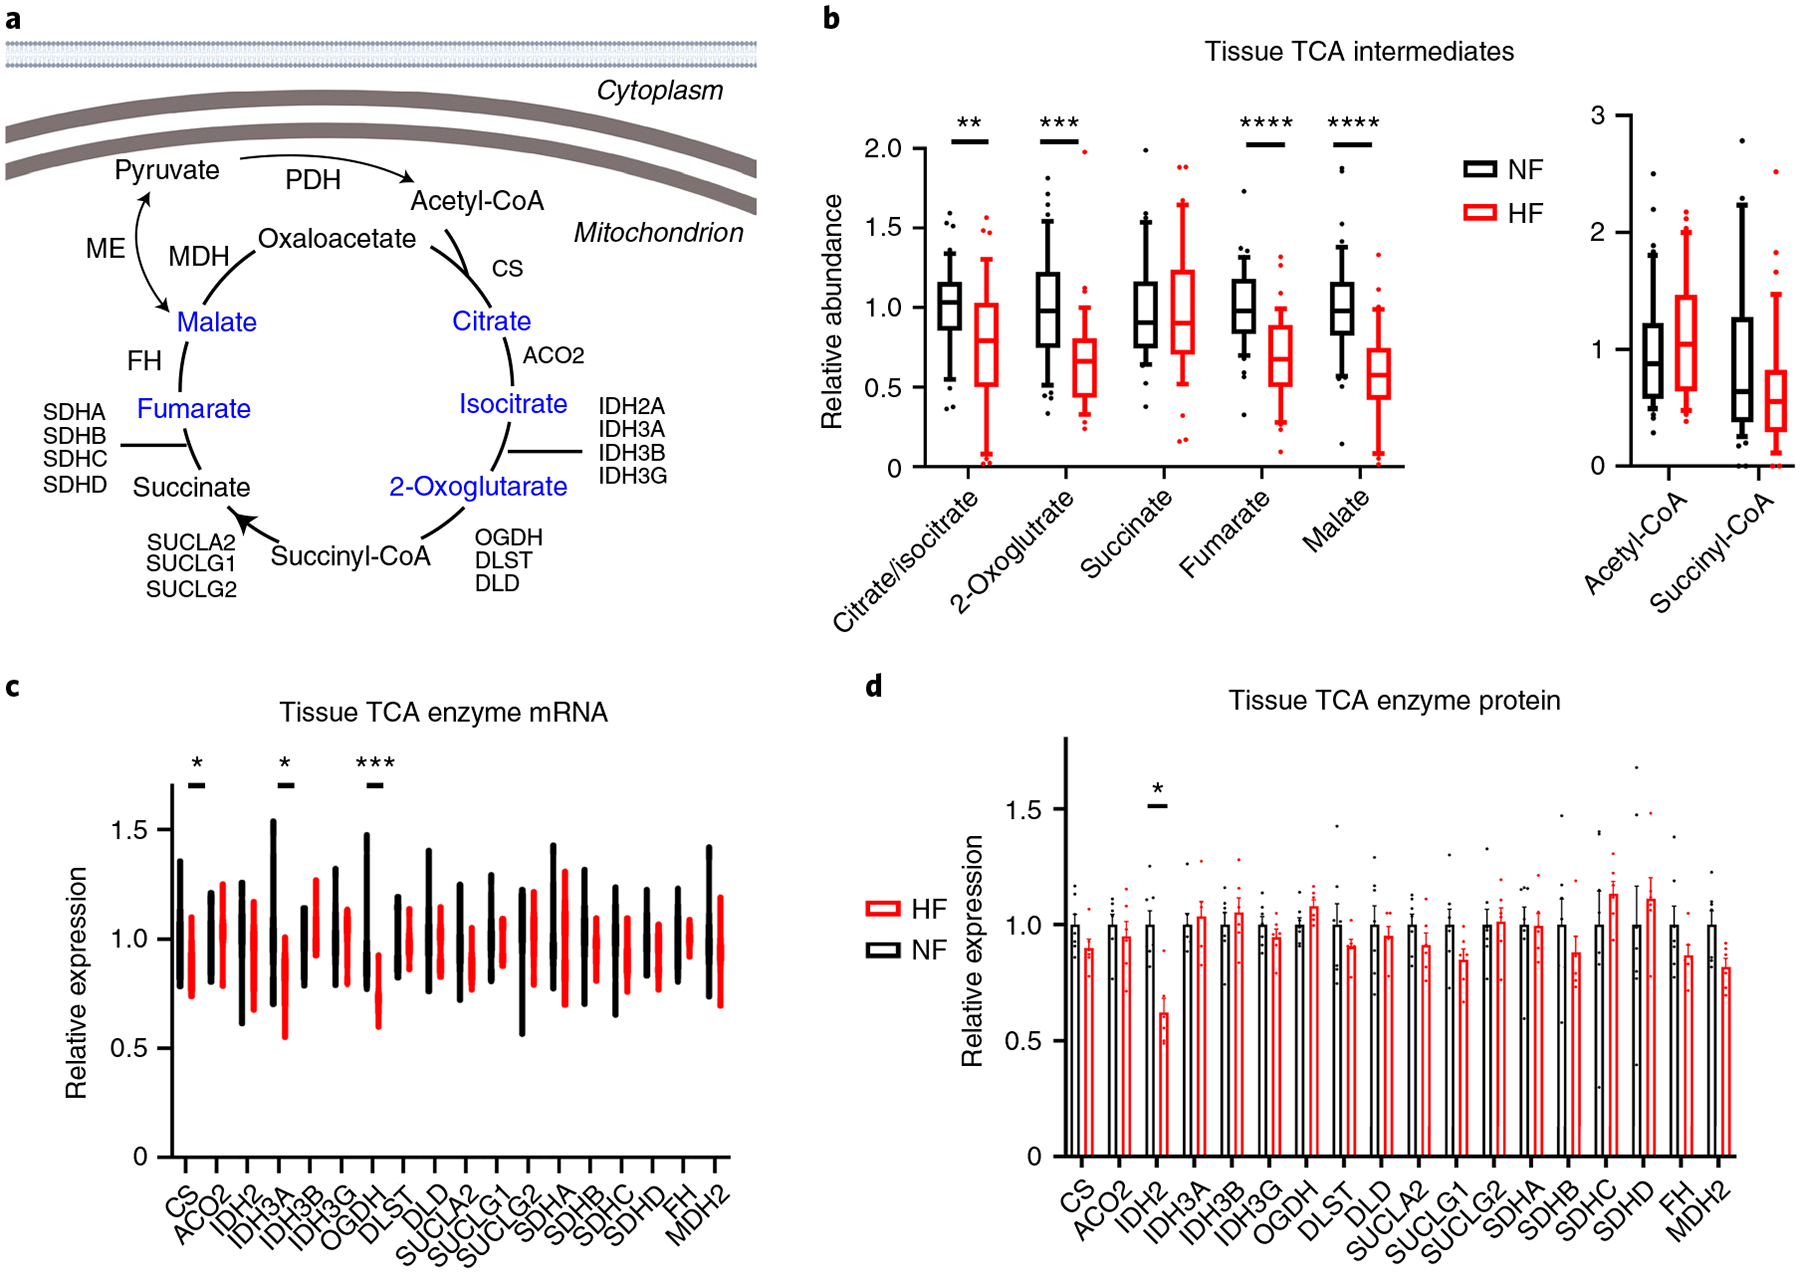
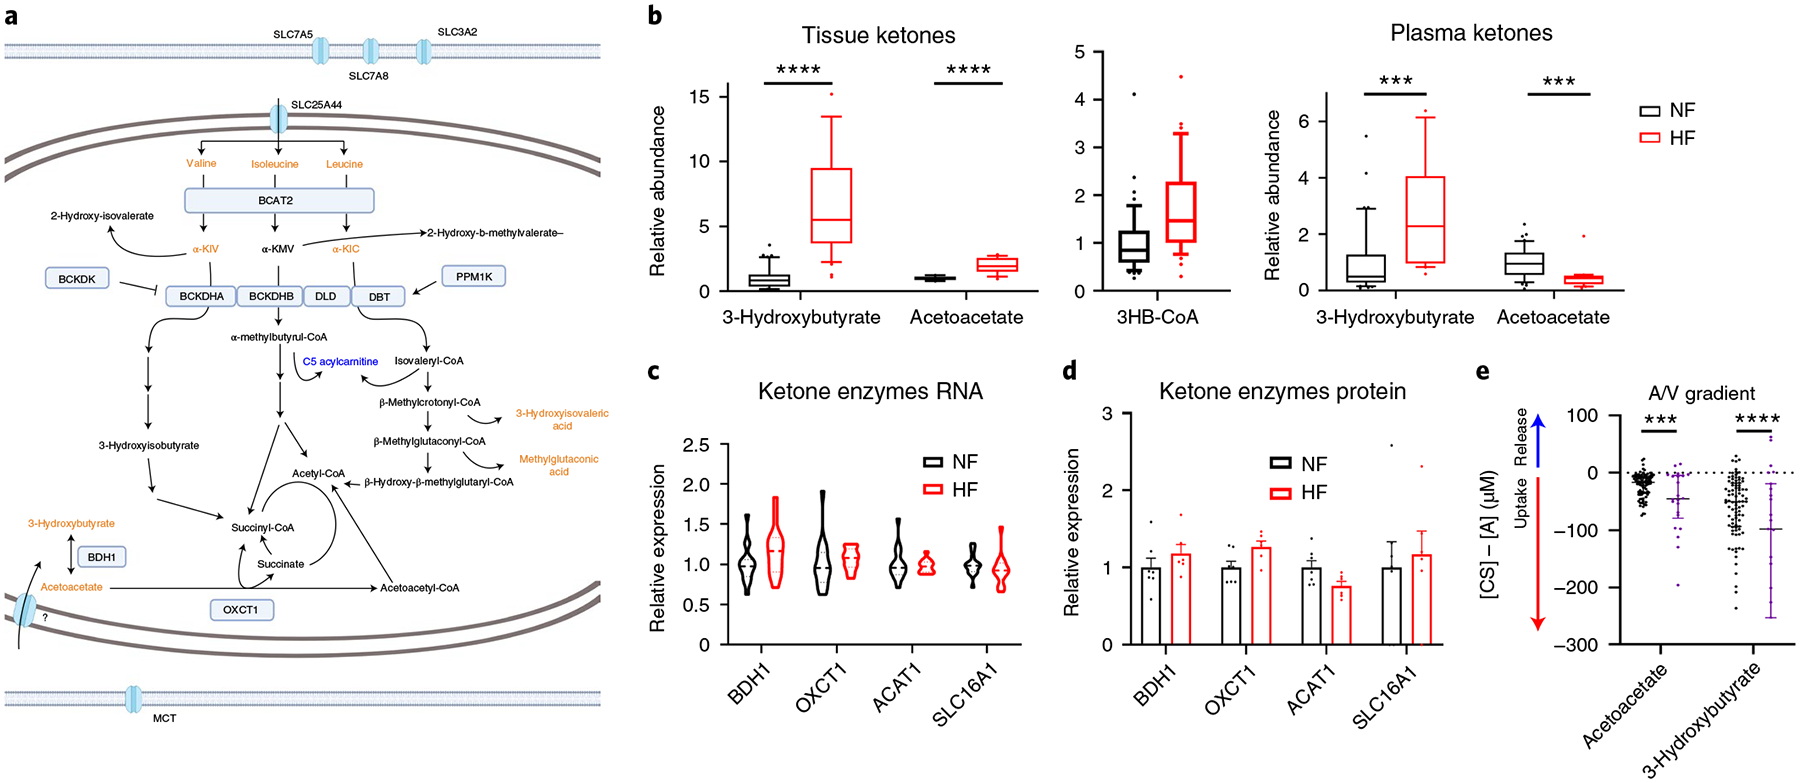
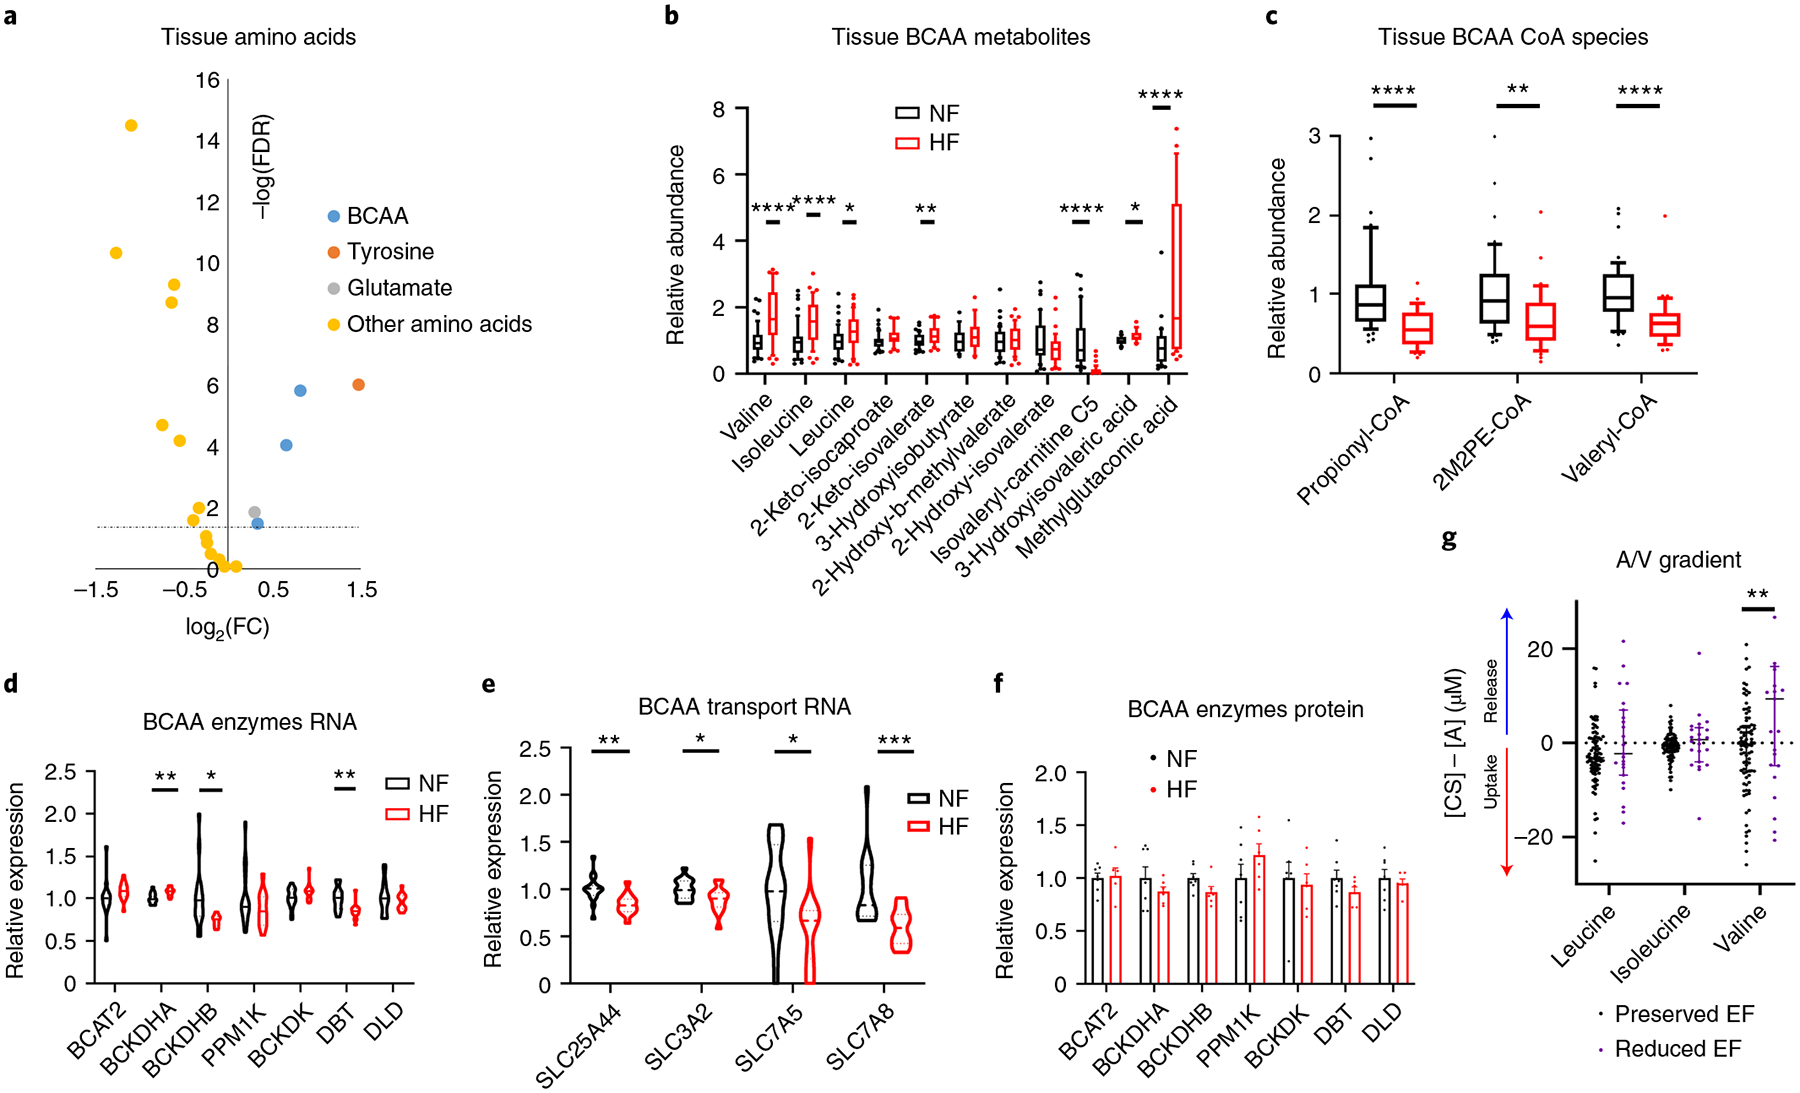
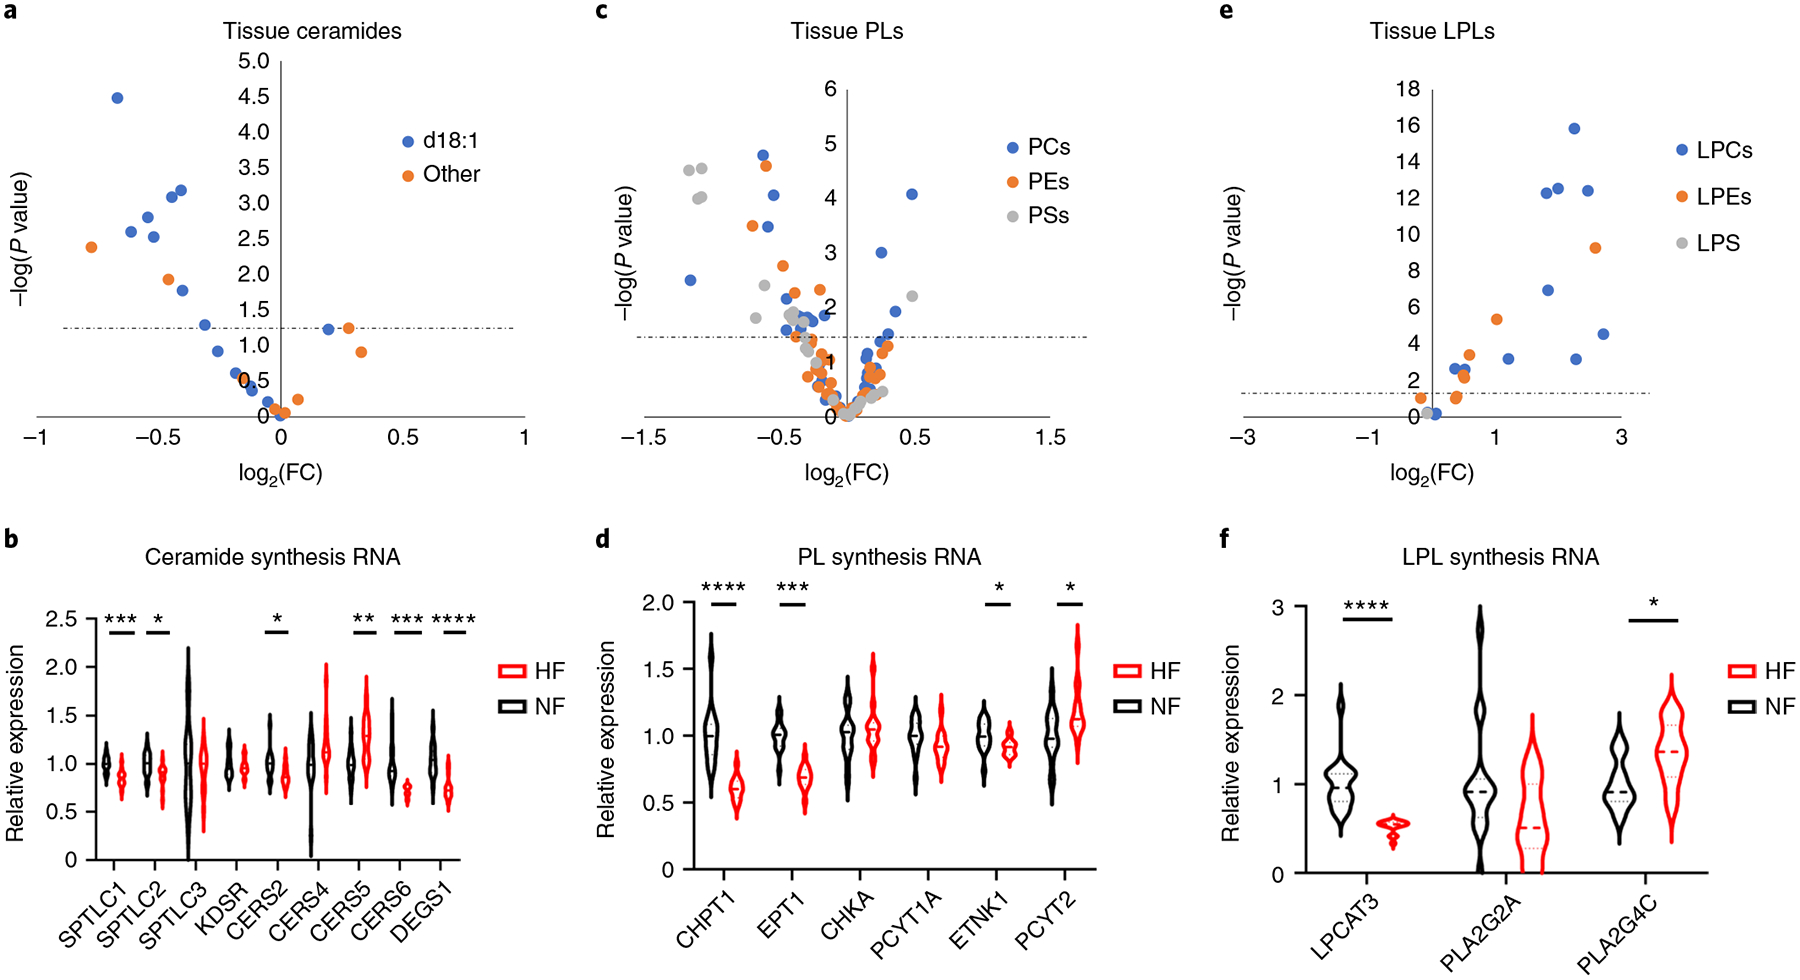
Heart failure (HF) is a leading cause of mortality. Failing hearts undergo profound metabolic changes, but a comprehensive evaluation in humans is lacking. We integrate plasma and cardiac tissue metabolomics of 678 metabolites, genome-wide RNA-sequencing, and proteomic studies to examine metabolic status in 87 explanted human hearts from 39 patients with end-stage HF compared with 48 nonfailing donors. We confirm bioenergetic defects in human HF and reveal selective depletion of adenylate purines required for maintaining ATP levels. We observe substantial reductions in fatty acids and acylcarnitines in failing tissue, despite plasma elevations, suggesting defective import of fatty acids into cardiomyocytes. Glucose levels, in contrast, are elevated. Pyruvate dehydrogenase, which gates carbohydrate oxidation, is de-repressed, allowing increased lactate and pyruvate burning. Tricarboxylic acid cycle intermediates are significantly reduced. Finally, bioactive lipids are profoundly reprogrammed, with marked reductions in ceramides and elevations in lysoglycerophospholipids. These data unveil profound metabolic abnormalities in human failing hearts.


Conflict of interest statement

Competing interests The authors declare no competing interests.

Figures

Extended Data Fig. 1 |
a, b) Correlation between cohort 1 and 2 tissue (a) or plasma (b) of fold-changes (FC) between non-failing and failing samples of metabolites significantly altered (FDR < 0.05) in at least one cohort. One outlier was removed from analysis in figure b. c) Correlation between cohorts 1 and 2 of plasma fold-change of metabolites significantly altered in both cohorts (FDR < 0.05). d) Similarity matrix of samples from cohort 1 based on metabolomics data. Size of square is proportional to Pearson correlation coefficient. e) Principal component analysis (PCA) of non-failing tissue samples from cohort 1. Data points represent patients and are pseudo-colored to reflect sex of donor. f) PCA of non-failing tissue samples from cohort 1. Data points represent patients and are pseudo-colored to reflect race of donor. g) PCA plot of all tissue samples from cohort 1. Data points represent patients and are pseudo-colored to reflect heart failure (HF) vs nonfailing (NF).
Extended Data Fig. 2 |
a) PCA plot of mRNA expression from all tissue samples. Data points represent patients and are pseudo-colored to reflect heart failure (HF) vs nonfailing (NF). b) Similarity matrix of RNA-seq data between individual samples. c) Volcano plot of RNA-seq data from tissue samples. d) Correlation between the current cohort (combined 1 and 2) and a previously published data set (Sweet et al.) of significant fold-changes (FC; nominal p-val < 0.05 by two-sided t-test) in mRNA expression between non-failing vs failing cardiac samples.
Extended Data Fig. 3 |
a-c) Relative abundance of metabolites involved in adenylate (a), guanylate (b), or pyrimidine (c) metabolism in cardiac tissue from nonfailing donors (NF) or subjects with heart failure (HF). Whiskers represent 10th and 90th percentiles, midline represents median, edges of boxes represent first and third quartiles, and points represent data points outside the 10th-90th percentile range. N = 48 NF and N = 39 HF samples. ATP FDR = 0.000904; adenine FDR = 1.09E-05; adenosine FDR = 1.4E-05; hypoxanthine FDR = 0.00126; inosine FDR = 3.02E-13; guanosine FDR = 0.00227; uracil FDR = 0.00202; uridine FDR = 1.09E-05. d-e) Relative protein (d) and mRNA (e) expression of enzymes involved in nucleotide metabolism. Bars represent mean and standard error (N = 7 NF and N = 6 HF). RNA: PPAT FDR = 0.00425; GART FDR = 0.00967; PAICS FDR = 0.0292; ADSL FDR = 0.0204; ATIC FDR = 0.0144. *P < 0.05, **P < 0.01, ***P < 0.001, ****P < 0.0001. P-values were determined by FDR-corrected two-tailed t-test.
Extended Data Fig. 4 |
a, b) Polar plots showing average relative abundance of tissue (a) and plasma (b) fatty acids between failing and non-failing subjects. Fold-change increases with distance from the origin, and shaded extended borders indicate standard error. c-d) Polar plots showing average relative abundance of carnitine species in tissue (c) and plasma (d) between failing and non-failing subjects. e) Volcano plots of differences in metabolite abundance in cardiac tissue after lipid extraction. f) Full western blot of ACSL1 protein (see Fig. 3 for quantification).
Extended Data Fig. 5 |
a) Relative mRNA expression of glucose transport genes. SLC2A1 FDR = 0.00196; SLC51A FDR = 5.88E-05. b) Western blots and quantification of various proteins from failing and non-failing tissues. Bars represent mean and standard error (N = 12 NF and N = 11 HF). ***P < 0.001, ****P < 0.0001. P-values were determined by FDR-corrected two-tailed t-test.
Extended Data Fig. 6 |
a, b) Relative mRNA (a) and protein (b) expression of malic enzyme isoforms. RNA: ME1 FDR = 0.000973; ME3 FDR = 0.0324. Bars represent mean and standard error (N = 7 NF and N = 6 HF). *P < 0.05, **P < 0.01, ***P < 0.001, ****P < 0.0001. P-values were determined by FDR-corrected two-tailed t-test. c) Western blots and quantification of ME1 and ME3 protein in failing and non-failing tissue. Bars represent mean and standard error (N = 12 NF and N = 11 HF). d) Volcano plot of differences in nuclear-encoded mRNAs (orange) and proteins (blue) composing the electron transport chain in cardiac tissue, comparing non-failing to failing samples. Y-axis represents FDR-corrected two-sided t-test between failing and non-failing samples. e, f) Relative expression of RNA (e) and protein (f) encoded by the mitochondrial genome. Bars represent mean and standard error (N = 7 NF and N = 6 HF). RNA: MT-ND6 FDR = 0.0296.
Extended Data Fig. 7 |
a) Western blots and quantification below of mTOR-related proteins from failing and non-failing tissues. Bars represent mean and standard error (N = 12 NF and N = 11 HF).
Fig. 1 |
Fig. 1 |. Cardiac and plasma metabolic alterations in human HF.
a, Overview of sample procurement and experimental design. b, Correlation between cohorts 1 and 2 of fold-changes (FCs) between nonfailing and failing samples of metabolites significantly altered by two-sided Student’s t-test (FDR < 0.05) in both tissue cohorts. c,d, Volcano plot of racial (c) and sex (d) differences in metabolite abundance in nonfailing tissue samples from cohort 1. Fold-changes were calculated as an average value for black patients divided by that of white patients (c) or an average value for female patients over that of male patients (d). Dotted lines represent the threshold of statistical significance (FDR). e,f, Volcano plots of differences in metabolite abundance in cardiac tissue (e) and plasma (f) from combined cohorts, comparing nonfailing with failing samples. Panel a created with BioRender.com
Fig. 2 |
Fig. 2 |. Loss of adenylate purines and high-energy phosphate molecules in HF.
a,b, Relative abundance (a) and ratios (b) of metabolites involved in high-energy phosphate transfers in cardiac tissue from NF donors (n = 48) or subjects with HF (n = 39). The whiskers represent the 10th and 90th percentiles, the midline represents the median, the edges of boxes represent the first and third quartiles and points represent data points outside the 10th–90th percentile range. *P < 0.05, **P < 0.01, ***P < 0.001, ****P < 0.0001. FDR-corrected (a) or nominal (b) P values were determined by two-tailed Student’s t-test. (ATP FDR = 0.000904; ADP FDR = 0.258; creatine FDR = 7.01 × 10⁻⁹; PCr FDR = 0.00268; NAD+ FDR = 0.787; NADH FDR = 0.463; NADP+ FDR = 0.00167; ATP:ADP P = 1.9 × 10⁻⁵; PCr:ATP P = 0.0458; PCr:Cr P = 0.0556). c, Purine degradation pathway. Blue text indicates significantly reduced in failing cardiac tissue and orange significantly elevated in failing cardiac tissue. Fold-change is indicated below each metabolite. Gray text indicates not detected. Significance based on FDR-corrected, two-tailed Student’s t-test (n = 48 NF and n = 39 HF samples). d, Volcano plot of nucleotides, nucleosides, bases and their intermediates from all tissue samples. Fold-change was calculated as the average for NF samples divided by the average of failing samples. P values are FDR-corrected, two-tailed Student’s t-test. The dotted line represents the threshold of statistical significance. A/V, arteriovenous. e, Transcoronary gradient concentrations (artery to coronary sinus) of hypoxanthine and xanthine in human patients with preserved (n = 81) versus reduced (n = 23) EF. Negative values indicate uptake of metabolite into the heart and positive values indicate release of metabolite from the heart. The lines represent the median and interquartile range (IQR). Two outliers in each graph are not shown. AMP, adenosine monophosphate; IMP, inosine monophosphate; XMP, xanthosine monophosphate; GMP, guanosine monophosphate.
Fig. 3 |
Fig. 3 |. Evidence of defective FA transport and FAO in failing hearts.
a, Schematic of FA import and FAO. Blue text indicates a molecule or family of molecules that is reduced in HF. Created with BioRender.com FABP, FA-binding protein. b,c, Volcano plot of differences in FA (b) or carnitine (c) abundance in cardiac tissue, comparing nonfailing (NF) with failing (HF) samples. d,e, Relative mRNA (d) and protein (e) expression of FAO genes. Bars represent mean and s.e.m. (n = 7 NF and n = 6 HF). Significant P values from d are as follows: ACADVL FDR = 0.0194; ACACB FDR = 0.0433; HADHA FDR = 0.000164; HADHB FDR = 4.2 × 10⁻⁵. f,g, Relative mRNA (f) and protein (g) expression of FA transport genes. Bars represent mean and s.e.m. (n = 7 NF and n = 6 HF). Significant P values for f are as follows: ACSL1 FDR = 0.000114; CPT1A FDR = 0.0194. h, Relative abundance of indicated coenzyme A species in tissue samples (n = 47 NF and n = 35 HF). The whiskers represent the 10th and 90th percentiles, the midline represents the median, the edges of boxes represent the first and third quartiles and the points represent data points outside the 10th–90th percentile range. Hexanoyl-CoA P = 0.000183. i, Quantification of ACSL1 protein by western blotting, with representative image of eight failing and NF tissues, shown below (see Extended Data Fig. 4 for full blot). Bars represent mean and s.e.m. (n = 12 NF and n = 11 HF). ACSL1 western blot P = 0.0475. *P < 0.05, **P < 0.01, ***P < 0.001, ****P < 0.0001. P values were determined by FDR-corrected, two-tailed Student’s t-test, except h, which uses a nominal P value.
Fig. 4 |
Fig. 4 |. Defects in glycolysis and evidence of increased lactate oxidation in failing hearts.
a, Schematic of glycolysis and the polyol pathway. Blue text indicates a metabolite that is significantly reduced in failing hearts and red one that is significantly increased. b, Volcano plot of differences in intermediates and products of glucose in cardiac tissue, comparing nonfailing with failing samples. c, Relative abundance of metabolic intermediates of the polyol pathway in tissue. The whiskers represent the 10th and 90th percentiles, the midline represents the median, the edges of boxes represent the first and third quartiles and points represent data points outside the 10th–90th percentile range (n = 48 NF and n = 39 HF samples; glucose FDR = 3.1 × 10⁻⁸, sorbitol FDR = 2.76 × 10⁻¹³; fructose FDR = 8.62 × 10⁻⁵). d,e, Relative mRNA (d) and protein (e) expression of glycolytic genes. Bars represent mean and s.e.m. (n = 7 NF and n = 6 HF). RNA: ALDOA FDR = 0.0328, PGK1 FDR = 0.0377, ENO1 FDR = 0.0125; protein: HK1 FDR = 0.0323, GPI FDR = 0.0180, ALDOA FDR = 0.00695, TPI1 FDR = 0.0308, PGK1 FDR = 0.0401, PGAM2 FDR = 0.000604, ENO3 FDR = 0.00695. f,g, Relative mRNA (f) and protein (g) expression of genes related to pyruvate oxidation. Bars represent mean and s.e.m. (n = 7 NF and n = 6 HF). PDK4 FDR = 0.0208. h, Quantification (top) of indicated proteins by western blotting, with a representative image of eight failing and nonfailing tissues shown below (see Extended Data Fig. 5 for full blot). Bars represent mean and s.e.m. (n = 12 NF and n = 11 HF); pPDH, phosphorylated PDH. PDK4 P = 0.0135. i, PDH activity in failing and nonfailing tissue. The midline represents median (n = 12 NF and n = 14 HF). P = 0.000716. j, Transcoronary gradient concentrations (artery to coronary sinus) of lactate in human patients with preserved (n = 81) versus reduced (n = 23) EF. Negative values indicate uptake of metabolite into the heart and positive values the release of metabolite from the heart. Lines represent median and IQR. Two outliers are not shown. *P < 0.05, **P < 0.01, ***P < 0.001, ****P < 0.0001. P values were determined by FDR-corrected, two-tailed Student’s t-test. Panel a created with BioRender.com
Fig. 5 |
Fig. 5 |. Evidence of depressed cardiac anaplerosis and TCA cycle in failing hearts.
a, Schematic of the TCA cycle. Blue text indicates a metabolite that is significantly reduced in failing hearts. Created with BioRender.com b, Relative abundance of TCA intermediates and indicated coenzyme A species in cardiac tissues. The whiskers represent 10th and 90th percentiles, the midline represents the median, the edges of boxes represent the first and third quartiles and the points represent data points outside the 10th–90th percentile range (n = 48 NF and n = 39 HF samples for non-coenzyme A metabolites (left) and n = 47 NF and N = 35 HF for CoA metabolites (right)). Citrate/isocitrate FDR = 0.00671; 2-oxoglutarate FDR = 0.000179; fumarate FDR = 2.74 × 10⁻⁶; malate FDR = 2.66 × 10⁻⁷. c,d, Relative RNA (c) and protein (d) expression of TCA enzymes. Bars represent mean and s.e.m. (n = 7 NF and n = 6 HF). RNA: CS FDR = 0.0462; IDH3A FDR = 0.020; OGDH FDR = 0.000232. Protein: IDH2 FDR = 0.0217. *P < 0.05, **P < 0.01, ***P < 0.001, ****P < 0.0001. P values were determined by FDR-corrected, two-tailed Student’s t-test.
Fig. 6 |
Fig. 6 |. Aberrant ketone metabolism in failing hearts.
a, Schematic of BCAA and ketone metabolism. Blue text indicates a metabolite that is significantly reduced in failing hearts. Orange text indicates a metabolite that is significantly elevated in failing hearts. Created with BioRender.com b, Relative abundance of ketones (n = 48 NF and n = 39 HF) and 3-hydroxy-CoA (n = 47 NF and n = 35 HF) in cardiac tissues (left) and ketones in plasma (right; n = 42 NF and n = 23). The whiskers represent 10th and 90th percentiles, the midline represents the median, the edges of boxes represent the first and third quartiles and points represent data points outside the 10th–90th percentile range. Tissue: acetoacetate FDR = 8.15 × 10⁻⁷; 3HB FDR = 6.89 × 10⁻¹². Plasma: acetoacetate FDR = 0.000553; BHB FDR = 0.000589. c,d, Relative expression of mRNA (c) and protein (d) of ketone catabolic enzymes. Bars represent mean and s.e.m. (n = 7 NF and n = 6 HF). e, Transcoronary gradient concentrations (artery to coronary sinus) of ketones in human patients with preserved (n = 81) versus reduced (n = 23) EF. Negative values indicate uptake of metabolite into the heart and positive values the release of metabolite from the heart. The lines represent the median and IQR. Five outliers are not shown. Acetoacetate P = 0.000261; BHB P = 0.000058. *P < 0.05, **P < 0.01, ***P < 0.001, ****P < 0.0001. P values were determined by FDR-corrected, two-tailed Student’s t-test.
Fig. 7 |
Fig. 7 |. Aberrant amino acid metabolism in failing hearts.
a, Volcano plot of differences in amino acid abundance in cardiac tissue, comparing nonfailing with failing samples. The dotted line represents the threshold of statistical significance (FDR corrected). b,c, Relative abundance of BCAAs and their catabolic intermediates (b; n = 48 NF and n = 39 HF) and CoA species (c; n = 47 NF and n = 35 HF) in cardiac tissues. The whisker plots represent 10th and 90th percentiles, the midline represents the median, the edges of boxes represent the first and third quartiles and points represent data points outside the 10th–90th percentile range. Valine FDR = 1.52 × 10⁻⁶; isoleucine FDR = 9.16 × 10⁻⁵; leucine FDR = 0.0334; 2-keto-isovalerate FDR = 0.00691; isovaleryl-carnitine FDR = 5.41 × 10⁻⁸; 3-hydroxyisovaleric acid FDR = 0.0388; methylglutaconic acid FDR = 0.0001; propionyl-CoA P = 3.71 × 10⁻⁵; 2M2PE-CoA P = 0.00267; valeryl-CoA P = 1.83 × 10⁻⁵. d,e, Relative expression of mRNA (d) and protein (e) of BCAA catabolic enzymes. Bars represent mean and s.e.m. (n = 7 NF and n = 6 HF). RNA: BCKDHA FDR = 0.00544; BCKDHB FDR = 0.0361; DBT FDR = 0.00599. f, Relative mRNA expression of BCAA transport genes. SLC25A44 FDR = 0.00778; SLC3A2 FDR = 0.0495; SLC7A5 FDR = 0.0480; SLC7A8 FDR = 0.00503. g, Transcoronary gradient concentrations (artery to coronary sinus) of BCAAs in human patients with preserved (n = 81) versus reduced (n = 23) EF. Negative values indicate uptake of metabolite into the heart and positive values indicate release of metabolite from the heart. The lines represent the median and IQR. Three outliers are not shown. Valine P = 0.00199. *P < 0.05, **P < 0.01, ***P < 0.001, ****P < 0.0001. P values were determined by FDR-corrected, two-tailed Student’s t-test.
Fig. 8 |
Fig. 8 |. Decreased ceramides and elevated LPLs in failing hearts.
a, Volcano plot of differences in ceramide abundance in cardiac tissue, comparing nonfailing with failing samples. b, Relative mRNA expression of ceramide synthesis enzymes. SPTLC1 FDR = 0.000282; SPTLC2 FDR = 0.0228; CERS2 FDR = 0.0281; CERS5 FDR = 0.00122; CERS6 FDR = 0.000149; DEGS1 FDR = 5.70 × 10⁻⁵. c, Volcano plot of differences in PL abundance in cardiac tissue, comparing nonfailing with failing samples. d, Relative mRNA expression of PL synthesis enzymes. CHPT1 FDR = 1.17 × 10⁻⁵; EPT1 FDR = 5.41 × 10⁻⁷; ETNK1 FDR = 0.0467; PCYT2 FDR = 0.0308. e, Volcano plot of differences in LPL abundance in cardiac tissue, comparing nonfailing with failing samples. f, Relative mRNA expression of LPL synthesis enzymes. LPCAT3 FDR = 4.53 × 10⁻⁵; PLA2G4C FDR = 0.0159. The dotted line represents the threshold of statistical significance (FDR corrected). *P < 0.05, **P < 0.01, ***P < 0.001, ****P < 0.0001. P values were determined by FDR-corrected, two-tailed Student’s t-test.

References

    1. Benjamin EJ et al. Heart Disease and Stroke Statistics. 2019 update: a report from the American Heart Association. Circulation 10.1161/CIR.0000000000000659 (2019). - DOI - PubMed
    1. Shah KS et al. Heart failure with preserved, borderline, and reduced ejection fraction: 5-year outcomes. J. Am. Coll. Cardiol 70, 2476–2486 (2017). - PubMed
    1. Jones NR, Roalfe AK, Adoki I, Hobbs FDR & Taylor CJ Survival of patients with chronic heart failure in the community: a systematic review and meta-analysis. Eur. J. Heart Fail 21, 1306–1325 (2019). - PMC - PubMed
    1. Ingwall JS & Weiss RG Is the failing heart energy starved? On using chemical energy to support cardiac function. Circ. Res 95, 135–145 (2004). - PubMed
    1. Neubauer S The failing heart—an engine out of fuel. N. Engl. J. Med 356, 1140–1151 (2007). - PubMed