

Use of the Improvement Index to Evaluate Equitable COVID-19 Vaccine Allocation in the San Francisco Bay Area
- PMID: 36776788
- PMCID: PMC9897871
- DOI: 10.1016/j.focus.2023.100075
Use of the Improvement Index to Evaluate Equitable COVID-19 Vaccine Allocation in the San Francisco Bay Area
Abstract
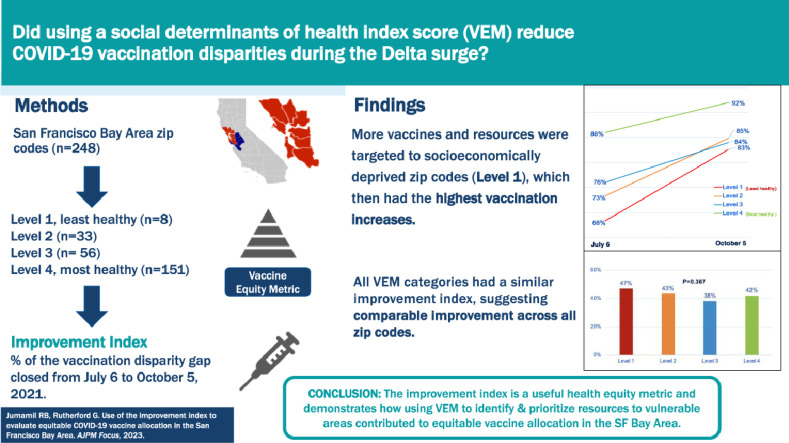
Introduction: A social determinants of health index score or Vaccine Equity Metric was used to prioritize resources and address geographic disparities in California's vaccination coverage. We calculated the improvement index or percentage of the vaccination disparity gap closed to evaluate the impacts of this vaccination strategy in the San Francisco Bay Area during the SARS-CoV-2 Delta variant surge.
Methods: We conducted a cross-sectional study on San Francisco Bay Area ZIP codes during the Delta surge (July 6-October 5, 2021). Data came from the California Immunization Registry and the 2019 5-year American Community Survey. We used Spearman correlations to examine the relationships between Vaccine Equity Metric category and vaccine coverage and Kruskal-Wallis tests to compare vaccination improvement index across Vaccine Equity Metric categories.
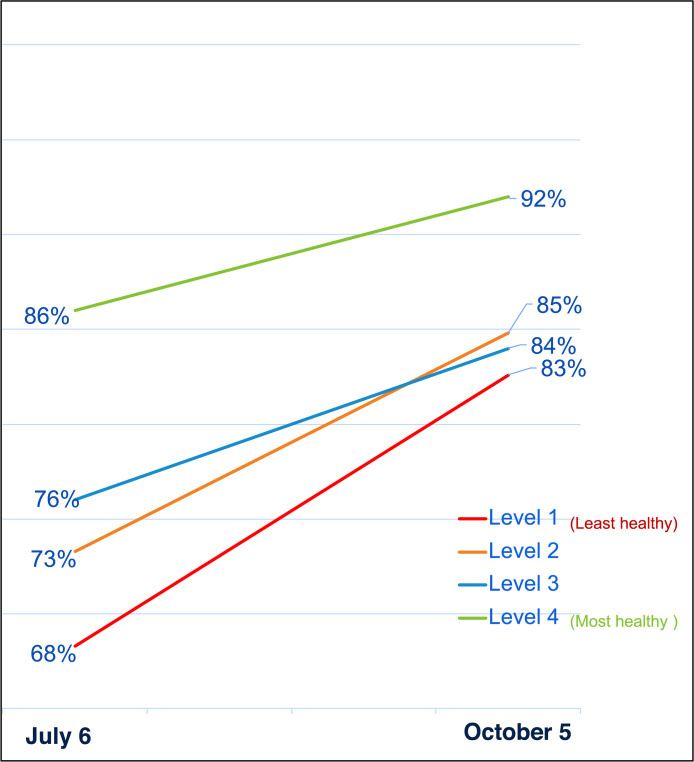
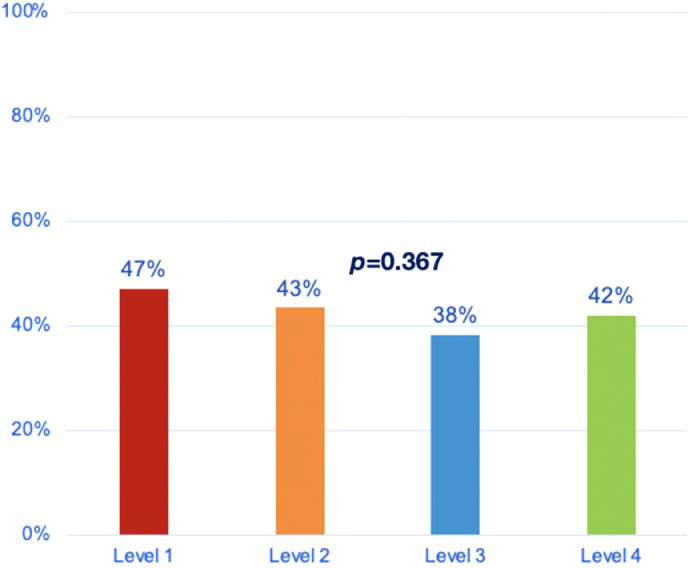
Results: We studied 248 ZIP codes in the San Francisco Bay Area. Those with the lowest resources (Vaccine Equity Metric Level 1) had the highest absolute increase in vaccination coverage (14.3 vs 5.4 percentage points in Vaccine Equity Metric Level 4), although a contribution was higher starting vaccination rates in Level 4 ZIP codes with the greatest resources. The ratio of vaccination coverage between the lowest- and highest-resourced ZIP codes increased from 0.79 to 0.9, suggesting reduced disparity. However, it is difficult to interpret given wide differences in n (Level 1 n=8 vs Level 4 n=151). In contrast, the vaccination improvement index accounts for each Vaccine Equity Metric category's baseline vaccination; all were statistically similar (grand mean=41.5%, p=0.367), implying comparable improvement across all ZIP codes.
Conclusions: Using a Vaccine Equity Metric to identify and prioritize resources to vulnerable communities contributed to equitable vaccine allocation in the San Francisco Bay Area. Our study shows an example of the improvement index's advantages over conventional health equity metrics, such as absolute differences and relative effect measures, which can overestimate an intervention's impact.
Keywords: COVID-19; San Francisco Bay Area; health disparity; improvement index; public health intervention; vaccination.
© 2023 The Authors.
Figures
Similar articles
-
Quantifying inequities in COVID-19 vaccine distribution over time by social vulnerability, race and ethnicity, and location: A population-level analysis in St. Louis and Kansas City, Missouri.PLoS Med. 2022 Aug 26;19(8):e1004048. doi: 10.1371/journal.pmed.1004048. eCollection 2022 Aug. PLoS Med. 2022. PMID: 36026527 Free PMC article.
-
Inequities in COVID-19 vaccine and booster coverage across Massachusetts ZIP codes after the emergence of Omicron: A population-based cross-sectional study.PLoS Med. 2023 Jan 31;20(1):e1004167. doi: 10.1371/journal.pmed.1004167. eCollection 2023 Jan. PLoS Med. 2023. PMID: 36719864 Free PMC article.
-
Chicago's Citywide COVID-19 Vaccine Equity Program: Protect Chicago Plus.Public Health Rep. 2023 Mar-Apr;138(2):218-222. doi: 10.1177/00333549221143093. Epub 2023 Jan 12. Public Health Rep. 2023. PMID: 36633366 Free PMC article.
-
Developing a Community-Oriented and Place-Based Strategy to Improve COVID-19 Vaccine Accessibility.Perm J. 2023 Mar 15;27(1):103-112. doi: 10.7812/TPP/22.097. Epub 2023 Mar 13. Perm J. 2023. PMID: 36911890 Free PMC article.
-
Best Practices for COVID-19 Vaccination and Testing: Environmental Scan Report: ASPE Report [Internet].Washington (DC): Office of the Assistant Secretary for Planning and Evaluation (ASPE); 2023 Apr. Washington (DC): Office of the Assistant Secretary for Planning and Evaluation (ASPE); 2023 Apr. PMID: 38691033 Free Books & Documents. Review. No abstract available.
Cited by
-
Community-Based Organizations Leading Research Efforts: Preliminary Findings from the Chicagoland CEAL Program's COVID-19 Vaccine Uptake and Intention Survey.J Racial Ethn Health Disparities. 2025 Feb;12(1):22-31. doi: 10.1007/s40615-023-01846-5. Epub 2024 Feb 21. J Racial Ethn Health Disparities. 2025. PMID: 38383838
References
-
- Larsen K. Bay area lands on CDC’s emerging COVID hot spot list as cases surge among unvaccinated. Abc7 News. July 12, 2021 https://abc7news.com/covid-hot-spot-cdc-spots-coronavirus-bay-are-19-in-... Accessed September 16, 2021.
Grants and funding
LinkOut - more resources
Full Text Sources
Miscellaneous
