Review
. 2023;5(3):157-169.
doi: 10.1038/s42254-023-00558-3. Epub 2023 Feb 3.

Quantum sensors for biomedical applications

Affiliations
Review

Quantum sensors for biomedical applications

Nabeel Aslam et al. Nat Rev Phys. 2023.

Abstract

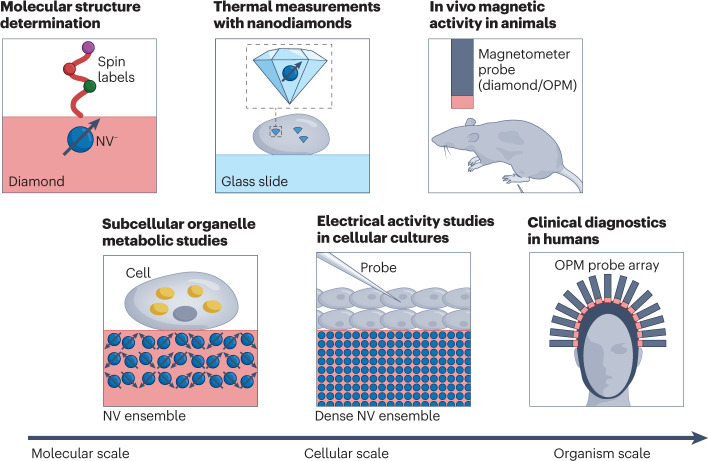
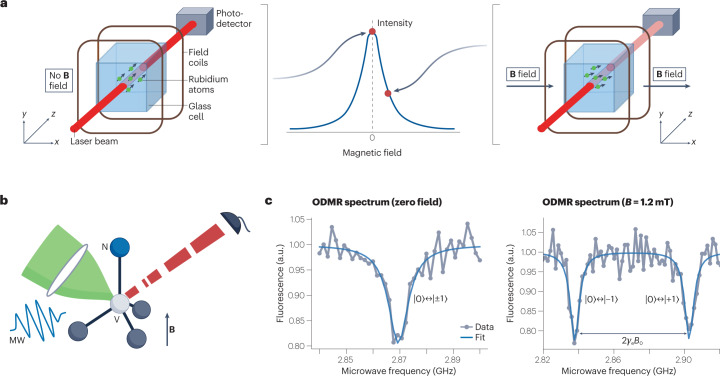
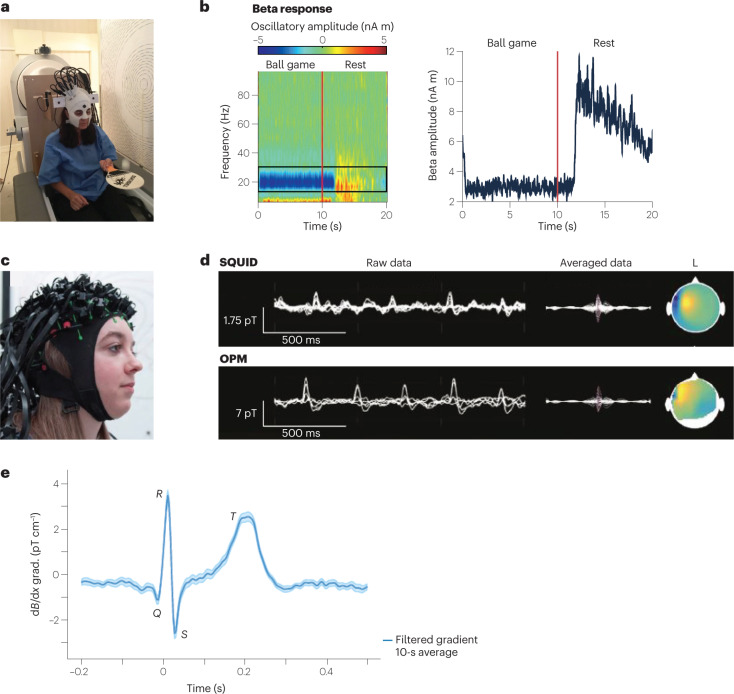
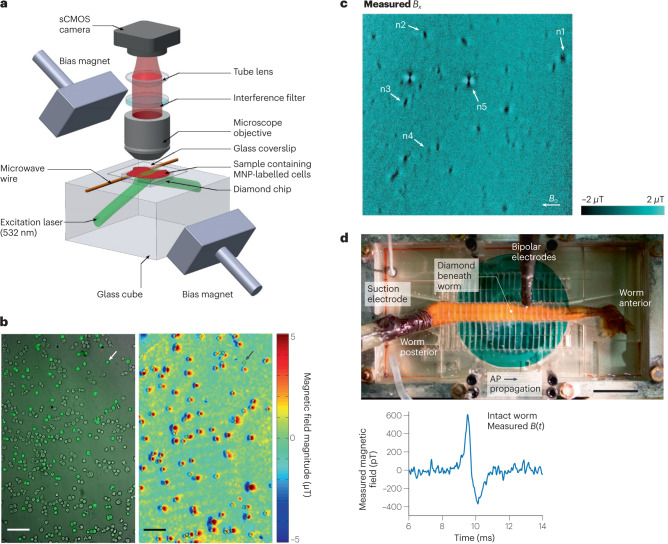
Quantum sensors are finding their way from laboratories to the real world, as witnessed by the increasing number of start-ups in this field. The atomic length scale of quantum sensors and their coherence properties enable unprecedented spatial resolution and sensitivity. Biomedical applications could benefit from these quantum technologies, but it is often difficult to evaluate the potential impact of the techniques. This Review sheds light on these questions, presenting the status of quantum sensing applications and discussing their path towards commercialization. The focus is on two promising quantum sensing platforms: optically pumped atomic magnetometers, and nitrogen-vacancy centres in diamond. The broad spectrum of biomedical applications is highlighted by four case studies ranging from brain imaging to single-cell spectroscopy.

Keywords: Confocal microscopy; Imaging and sensing; Nanosensors; Quantum metrology; Solution-state NMR.


Conflict of interest statement

Competing interestsThe authors declare the following competing interests: R.L.W., M.D.L. and H.P. are scientific co-founders of QDTI Inc.

Figures

Fig. 1
Fig. 1. Quantum sensors will have an impact in biomedical research on different length scales.
Nitrogen–vacancy (NV) centres in diamond are suited for structure determination of single molecules. On the cellular scale, NV centres could help study metabolism and probe electrical activity of neurons. Such quantum sensors can also be integrated into nanodiamonds and serve as in vivo nanoscale temperature sensors. Detection of biomagnetic signal from animals and humans is another promising application of quantum sensors. In this regard, optically pumped magnetometers (OPM) are well suited due to their high magnetic field sensitivity.
Fig. 2
Fig. 2. Operating principles of optically pumped magnetometers (OPMs) and nitrogen–vacancy (NV) magnetometers.
a, In an OPM, rubidium atoms (as an example out of the various alkali atoms being used) in a glass cell are optically spin-polarized. In zero magnetic field, the transmission of a probe laser is at its maximum (left). The presence of a magnetic field leads to Larmor precession of the spins, which reduces transmission of the probe laser (right). b, The NV centre in the diamond lattice has its spin state initialized and interrogated via green excitation light, microwave (MW) resonant fields and red fluorescence, in the presence of magnetic fields (B). c, Optically detected magnetic resonance (ODMR) spectrum of the NV centre at zero field (left) and at B = 1.2 mT (right), where γ is the electron gyromagnetic ratio and |0⟩, |±1⟩ stand for the electron spin states m= 0, ±1, respectively. Part a adapted with permission from ref. , Springer Nature Ltd.
Fig. 3
Fig. 3. Optically pumped magnetometer (OPM)-based magnetoencephalography (MEG).
a, Prototype wearable OPM-MEG. The subject can move their head during the measurement, as exemplified by the subject bouncing a tennis ball off a bat. b, Beta band oscillations recorded as a frequency spectrogram (left) and amplitude (right) during ball game and rest. c, Flexible wearable OPM-MEG helmet with 63 sensor mounts. d, SQUID-MEG (top) and OPM-MEG (bottom) recording of 11-year-old patient with refractory focal epilepsy. Left: superimposed data of multiple sensors showing filtered background brain activity and interictal epileptiform discharges (IEDs). Right: averaged IED data and magnetic field topography at the spike peak. e, OPM-magnetocardiography (MCG) measured at ambient conditions with a 87Rb magnetic gradiometer. Parts a,b adapted with permission from ref. , Springer Nature Ltd. Part c adapted with permission from ref. under a Creative Commons licence CC BY 4.0. Part d adapted with permission from ref. , RSNA. Part e adapted with permission from ref. , APS.
Fig. 4
Fig. 4. Nitrogen–vacancy (NV)-centre-based magnetic sensing of biological samples.
a, Wide-field NV-diamond microscope for magnetic imaging of cells. sCMOS, scientific complementary metal–oxide–semiconductor. b, Wide-field imaging of biomarkers. Left: bright-field image overlayed with fluorescence image of SKBR3 cancer cells labelled with magnetic nanoparticles (MNPs) and stained with fluorescence dyes. Right: same field of view showing NV magnetic imaging of MNP-labelled cells. Scale bar, 100 µm. c, Magnetic field image of natural haemozoin crystals acquired with a NV-diamond microscope. Field of view is 39 × 39 µm². d, Top: image of NV-diamond set-up for single-neuron action potential (AP) magnetic measurement of a living specimen of Myxicola infundibulum (worm). Bottom: time trace of the magnetic field signal coming from a single-neuron action potential of M. infundibulum detected with the NV-diamond set-up. Part a adapted with permission from ref. , Springer Nature Ltd. Part b adapted with permission from ref. , Springer Nature Ltd. Part c adapted with permission from ref.  under a Creative Commons licence CC BY 4.0. Part d adapted with permission from ref. , PNAS.
Fig. 5
Fig. 5. Nuclear magnetic resonance (NMR) with nitrogen–vacancy (NV) centres.
a, Single-NV and NV-ensemble NMR set-ups. b,c, Pulse sequences used for NMR detection with NV centres: XY8-k (XY8 is a sequence of microwave pulses with X and Y phase shifts and is repeated k times, part b) and coherently averaged synchronized readout (CASR, part c). d, NMR spectrum detected by NV ensembles showing resolved chemical shift. e, Inset: image of a grating etched on a fluorine-enriched microsphere on an atomic force microscope tip. Main image: line scan of the NMR spectrum detected by a single NV centre as the sphere is moved over the NV centre. Parts a,b adapted with permission from ref. , Springer Nature Ltd. Parts c,d adapted with permission from ref. ,  Springer Nature Ltd. Part e adapted with permission from ref. ,  Springer Nature Ltd.
Fig. 6
Fig. 6. Thermometry with nitrogen–vacancy (NV) centres in nanodiamonds.
a, NV energy-level diagram with spin quantum number ms = 0,±1 and temperature-dependent zero-field splitting, D(T), which is typically used for thermometry. b, Four-point measurement scheme for noise-robust determination of temperature using NVs. c, Heat gradients between two cells AB and P1 at the early embryo stage, generated by localized heating using an infrared (IR) laser. Parts b,c adapted with permission from ref. , PNAS.

Similar articles

Cited by

References

    1. Arute F, et al. Quantum supremacy using a programmable superconducting processor. Nature. 2019;574:505–510. doi: 10.1038/s41586-019-1666-5. - DOI - PubMed
    1. Zhong H-S, et al. Quantum computational advantage using photons. Science. 2020;370:1460–1463. doi: 10.1126/science.abe8770. - DOI - PubMed
    1. Bhaskar MK, et al. Experimental demonstration of memory-enhanced quantum communication. Nature. 2020;580:60–64. doi: 10.1038/s41586-020-2103-5. - DOI - PubMed
    1. Boto E, et al. Moving magnetoencephalography towards real-world applications with a wearable system. Nature. 2018;555:657–661. doi: 10.1038/nature26147. - DOI - PMC - PubMed
    1. Aslam N, et al. Nanoscale nuclear magnetic resonance with chemical resolution. Science. 2017;357:67–71. doi: 10.1126/science.aam8697. - DOI - PubMed

LinkOut - more resources