

Generation of mesenchymal stromal cells from urine-derived iPSCs of pediatric brain tumor patients
- PMID: 36776860
- PMCID: PMC9910217
- DOI: 10.3389/fimmu.2023.1022676
Generation of mesenchymal stromal cells from urine-derived iPSCs of pediatric brain tumor patients
Abstract
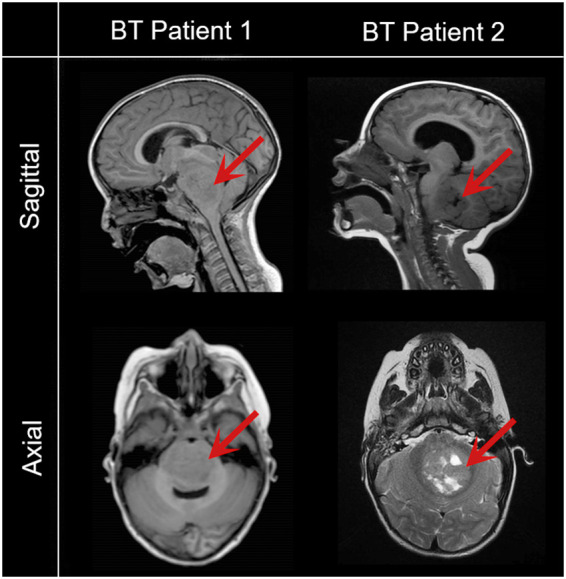
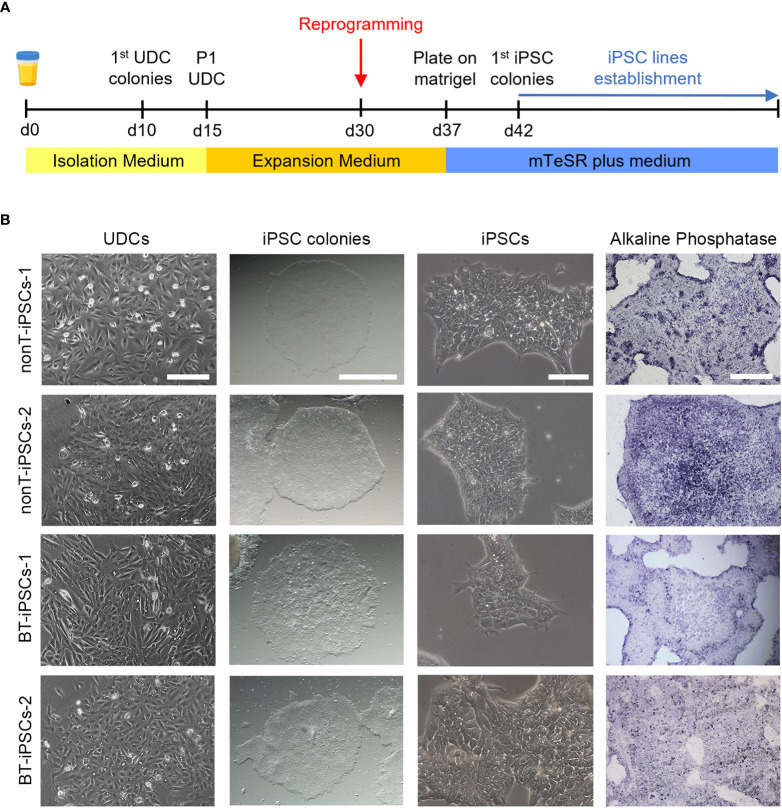
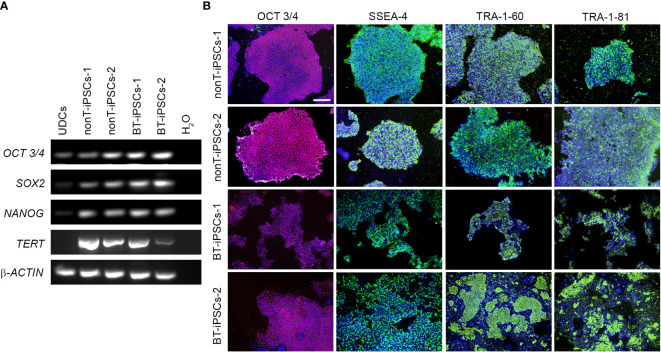
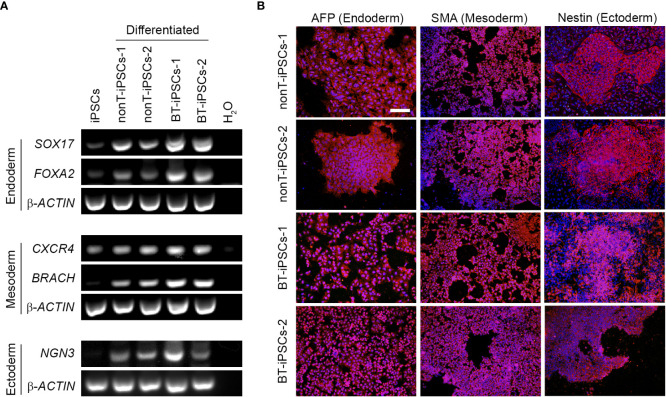
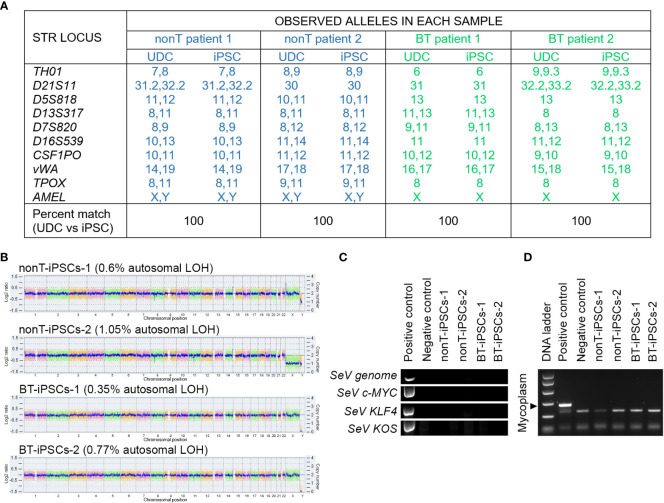
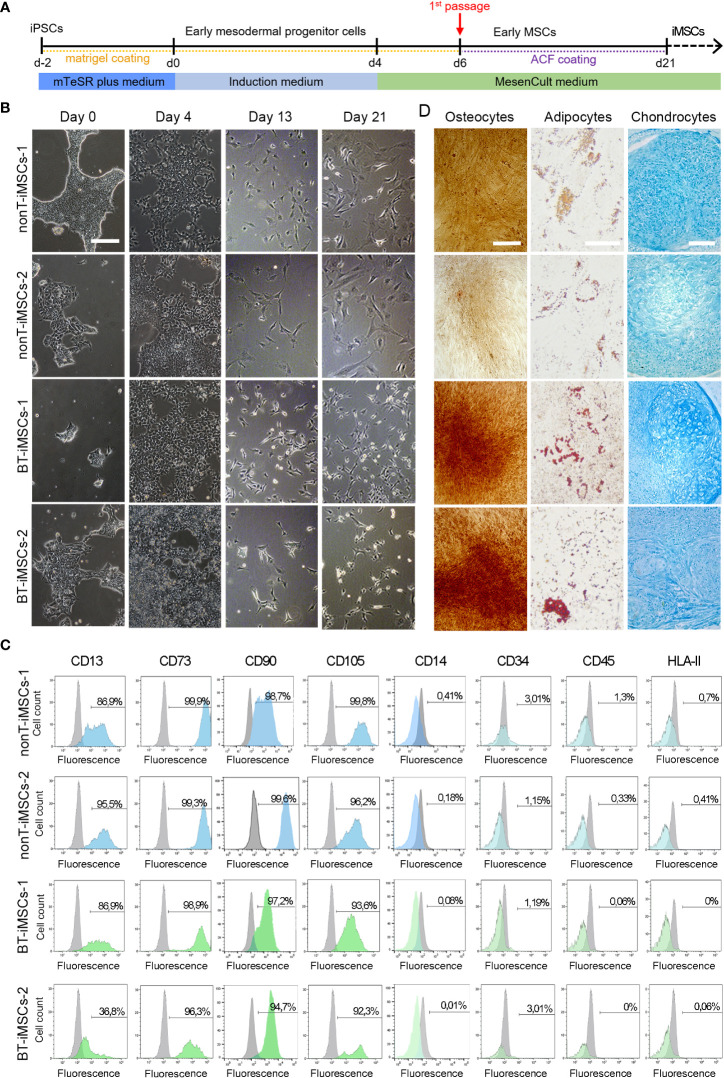
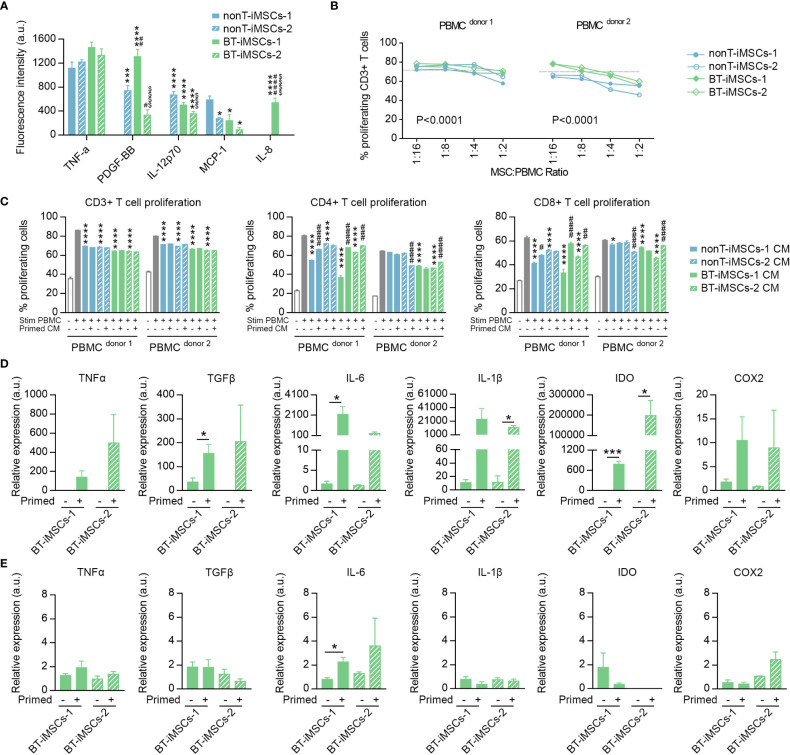
Human induced pluripotent stem cells (iPSCs) provide a virtually inexhaustible source of starting material for next generation cell therapies, offering new opportunities for regenerative medicine. Among different cell sources for the generation of iPSCs, urine cells are clinically relevant since these cells can be repeatedly obtained by non-invasive methods from patients of any age and health condition. These attributes encourage patients to participate in preclinical and clinical research. In particular, the use of urine-derived iPSC products is a convenient strategy for children with brain tumors, which are medically fragile patients. Here, we investigate the feasibility of using urine samples as a source of somatic cells to generate iPSC lines from pediatric patients with brain tumors (BT-iPSC). Urinary epithelial cells were isolated and reprogrammed using non-integrative Sendai virus vectors harboring the Yamanaka factors KLF4, OCT3/4, SOX2 and C-MYC. After reprogramming, BT-iPSC lines were subject to quality assessment and were compared to iPSCs obtained from urine samples of non-tumor pediatric patients (nonT-iPSC). We demonstrated that iPSCs can be successfully derived from a small volume of urine obtained from pediatric patients. Importantly, we showed that BT-iPSCs are equivalent to nonT-iPSCs in terms of morphology, pluripotency, and differentiation capacity into the three germ layers. In addition, both BT-iPSCs and nonT-iPSCs efficiently differentiated into functional mesenchymal stem/stromal cells (iMSC) with immunomodulatory properties. Therefore, this study provides an attractive approach to non-invasively generate personalized iMSC products intended for the treatment of children with brain tumors.
Keywords: cancer; cell reprogramming; cell therapy; central nervous system cancer; children; iPSC; mesenchymal stem/stromal cells (MSC); oncology.
Copyright © 2023 Baliña-Sánchez, Aguilera, Adán, Sierra-Párraga, Olmedo-Moreno, Panadero-Morón, Cabello-Laureano, Márquez-Vega, Martín-Montalvo and Capilla-González.
Conflict of interest statement
The authors declare that the research was conducted in the absence of any commercial or financial relationships that could be construed as a potential conflict of interest.
Figures
Similar articles
-
Footprint-free induced pluripotent stem cells can be successfully differentiated into mesenchymal stromal cells in the feline model.Stem Cell Res Ther. 2025 Apr 20;16(1):195. doi: 10.1186/s13287-025-04325-2. Stem Cell Res Ther. 2025. PMID: 40254569 Free PMC article.
-
Generation of two induced pluripotent stem cells lines from a Mucopolysaccharydosis IIIB (MPSIIIB) patient.Stem Cell Res. 2018 Dec;33:180-184. doi: 10.1016/j.scr.2018.10.019. Epub 2018 Nov 1. Stem Cell Res. 2018. PMID: 30408744
-
Osteopetrotic induced pluripotent stem cells derived from patients with different disease-associated mutations by non-integrating reprogramming methods.Stem Cell Res Ther. 2019 Jul 17;10(1):211. doi: 10.1186/s13287-019-1316-8. Stem Cell Res Ther. 2019. PMID: 31315669 Free PMC article.
-
Tissue-Restricted Stem Cells as Starting Cell Source for Efficient Generation of Pluripotent Stem Cells: An Overview.Adv Exp Med Biol. 2022;1376:151-180. doi: 10.1007/5584_2021_660. Adv Exp Med Biol. 2022. PMID: 34611861 Review.
-
Patient-derived induced pluripotent stem cells for models of cancer and cancer stem cell research.J Formos Med Assoc. 2018 Dec;117(12):1046-1057. doi: 10.1016/j.jfma.2018.06.013. Epub 2018 Aug 29. J Formos Med Assoc. 2018. PMID: 30172452 Review.
Cited by
-
Application prospects of urine-derived stem cells in neurological and musculoskeletal diseases.World J Orthop. 2024 Oct 18;15(10):918-931. doi: 10.5312/wjo.v15.i10.918. eCollection 2024 Oct 18. World J Orthop. 2024. PMID: 39473520 Free PMC article. Review.
-
Comparison of Natural Killer Cells Differentiated from Various Pluripotent Stem Cells.Int J Mol Sci. 2024 Jul 27;25(15):8209. doi: 10.3390/ijms25158209. Int J Mol Sci. 2024. PMID: 39125777 Free PMC article.
-
Exploring the promising potential of induced pluripotent stem cells in cancer research and therapy.Mol Cancer. 2023 Nov 28;22(1):189. doi: 10.1186/s12943-023-01873-0. Mol Cancer. 2023. PMID: 38017433 Free PMC article. Review.
-
Induced Mesenchymal Stem Cells: An Emerging Source for Regenerative Medicine Applications.J Clin Med. 2025 Mar 18;14(6):2053. doi: 10.3390/jcm14062053. J Clin Med. 2025. PMID: 40142860 Free PMC article. Review.
-
Prospects of induced pluripotent stem cells in treating advancing Alzheimer's disease: A review.Histol Histopathol. 2025 Feb;40(2):157-170. doi: 10.14670/HH-18-766. Epub 2024 May 21. Histol Histopathol. 2025. PMID: 38847077 Review.
References
-
- Sun YQ, Zhang Y, Li X, Deng MX, Gao WX, Yao Y, et al. . Insensitivity of human iPS cells-derived mesenchymal stem cells to interferon-gamma-induced HLA expression potentiates repair efficiency of hind limb ischemia in immune humanized NOD scid gamma mice. Stem Cells (2015) 33:3452–67. doi: 10.1002/stem.2094 - DOI - PubMed
-
- Huang J, Kin Pong U, Yang F, Ji Z, Lin J, Weng Z, et al. . Human pluripotent stem cell-derived ectomesenchymal stromal cells promote more robust functional recovery than umbilical cord-derived mesenchymal stromal cells after hypoxic-ischaemic brain damage. Theranostics (2022) 12:143–66. doi: 10.7150/thno.57234 - DOI - PMC - PubMed
Publication types
MeSH terms
LinkOut - more resources
Full Text Sources
Molecular Biology Databases
Research Materials