. 2023 Jan 27:14:1087551.
doi: 10.3389/fimmu.2023.1087551. eCollection 2023.

Network analyses of upper and lower airway transcriptomes identify shared mechanisms among children with recurrent wheezing and school-age asthma

Affiliations

Network analyses of upper and lower airway transcriptomes identify shared mechanisms among children with recurrent wheezing and school-age asthma

Zhili Wang et al. Front Immunol. .

Abstract

Background: Predicting which preschool children with recurrent wheezing (RW) will develop school-age asthma (SA) is difficult, highlighting the critical need to clarify the pathogenesis of RW and the mechanistic relationship between RW and SA. Despite shared environmental exposures and genetic determinants, RW and SA are usually studied in isolation. Based on network analysis of nasal and tracheal transcriptomes, we aimed to identify convergent transcriptomic mechanisms in RW and SA.

Methods: RNA-sequencing data from nasal and tracheal brushing samples were acquired from the Gene Expression Omnibus. Combined with single-cell transcriptome data, cell deconvolution was used to infer the composition of 18 cellular components within the airway. Consensus weighted gene co-expression network analysis was performed to identify consensus modules closely related to both RW and SA. Shared pathways underlying consensus modules between RW and SA were explored by enrichment analysis. Hub genes between RW and SA were identified using machine learning strategies and validated using external datasets and quantitative reverse transcription-polymerase chain reaction (qRT-PCR). Finally, the potential value of hub genes in defining RW subsets was determined using nasal and tracheal transcriptome data.

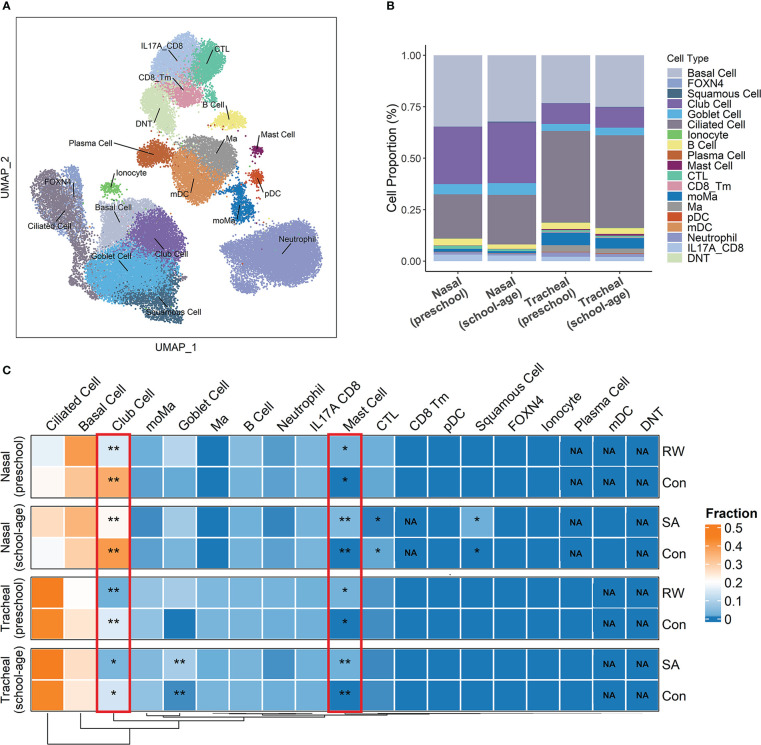
Results: Co-expression network analysis revealed similarities in the transcriptional networks of RW and SA in the upper and lower airways. Cell deconvolution analysis revealed an increase in mast cell fraction but decrease in club cell fraction in both RW and SA airways compared to controls. Consensus network analysis identified two consensus modules highly associated with both RW and SA. Enrichment analysis of the two consensus modules indicated that fatty acid metabolism-related pathways were shared key signals between RW and SA. Furthermore, machine learning strategies identified five hub genes, i.e., CST1, CST2, CST4, POSTN, and NRTK2, with the up-regulated hub genes in RW and SA validated using three independent external datasets and qRT-PCR. The gene signatures of the five hub genes could potentially be used to determine type 2 (T2)-high and T2-low subsets in preschoolers with RW.

Conclusions: These findings improve our understanding of the molecular pathogenesis of RW and provide a rationale for future exploration of the mechanistic relationship between RW and SA.

Keywords: RNA-seq; cell deconvolution; gene co-expression network; machine learning; recurrent wheezing; scRNA-seq; school-age asthma.


Conflict of interest statement

The authors declare that the research was conducted in the absence of any commercial or financial relationships that could be construed as a potential conflict of interest.

Figures

Figure 1
Figure 1
Identification and validation of hub genes shared by RW and SA. Process of identifying hub genes using random forest (RF) algorithm across nasal (A) and tracheal samples (B). Identifying hub genes based on support vector machine-recursive feature elimination (SVM-RFE) across nasal (C) and tracheal samples (D). X-axis denotes number of feature genes; y-axis represents classification accuracy. Annotated numbers represent number of feature genes corresponding to maximum classification accuracy. (E) UpSet diagram showing 16 overlapping hub genes between co-DEGs and candidate hub genes screened by two machine learning algorithms. (F) qRT-PCR validation of POSTN, CST1, CST2, CST4, and NTRK2 expression in bronchoalveolar lavage (BAL) cells from controls, patients with SA, and preschoolers with RW. Statistical significance was assessed using Wilcoxon rank-sum test. Asterisks indicate P-values for RW or SA versus control. *P < 0.05, **P < 0.01, ***P < 0.001. (G) ROC curves evaluating discriminatory power of hub genes for children with RW. AUC, area under ROC curve; co-DEGs, common differentially expressed genes; con, control; N, nasal; qRT-PCR, quantitative reverse-transcription polymerase chain reaction; ROC, receiver operating characteristic; RW, recurrent wheezing; T, tracheal.
Figure 2
Figure 2
Identification of RW patient subsets using expression profiles of hub genes. Heatmap of hierarchical clustering of POSTN, CST1, CST2, CST4, and NTRK2 expression levels across all subjects with RW in nasal (A) and tracheal samples (B), respectively. Comparison of gene expression levels of 12 T2 inflammatory markers between high- and low-hub expression groups of all RW patients across nasal (C) and tracheal samples (D). Statistical significance was assessed using Wilcoxon rank-sum test. Asterisks indicate P-values for hub high-expression versus hub low-expression. *P < 0.05, **P < 0.01. Correlation heatmaps showing associations between hub genes (row) and 12 T2 inflammatory markers (column) across nasal (E) and tracheal samples (F). Boxplot above heatmap showing correlation coefficients obtained by Pearson correlation analyses between each T2 inflammatory genes and hub genes. Blue to orange gradient coloration implies increased Pearson correlation coefficient. Correlation coefficients (r) and P-values were obtained by Pearson correlation analysis. *P < 0.05, **P < 0.01. NS, no significance; RW, recurrent wheezing; T2, type 2.
Figure 3
Figure 3
Deconvolution of airway transcriptome data to infer critical cell components shared by RW and SA. (A) Overall cell-type composition of 38 399 cells from 18 healthy children visualized using UMAP. CD8_Tm, memory CD8+ T cells; CTL, cytotoxic T cells; DNT, double-negative T cells; FOXN4, FOXN4+ cells; IL-17A_CD8, IL-17A-expressing CD8+ T cells; mDC, myeloid dendritic cells; Ma, macrophages; moMa, monocyte-derived macrophages; pDCs, plasmacytoid dendritic cells. (B) Histogram displaying proportion of each cell type in preschool and school-age subjects across nasal and tracheal samples. (C) Heatmap of proportion of each cell type across upper and lower airways of RW, SA and healthy controls inferred by cell deconvolution analysis. NA indicates P-value could not be calculated because corresponding cellular components were not detected by CIBERSORTx. Statistical significance was assessed using Wilcoxon rank-sum test. Asterisks indicate P-values for RW or SA versus control. *P < 0.05, **P < 0.01. Con, control; NA, not applicable; RW, recurrent wheezing; SA, school-age asthma.
Figure 4
Figure 4
Identification of co-DEGs shared by RW and SA across upper and lower airways. (A) Volcano plots showing DEGs between healthy controls and children with RW/SA. (B) UpSet diagram showing overlapping DEGs between RW and SA across nasal and tracheal samples. In total, 16 co-DEGs were shared by RW and SA across nasal and tracheal samples. (C) Heatmap visualization of differential expression changes (colors in inner circle indicates corresponding log2FC) and significance values (colors in outer circle represent corresponding -log10P-value) for 16 co-DEGs derived from integrated analysis. (D) GO term enrichment analysis of co-DEGs. (E) KEGG pathway enrichment analysis of co-DEGs. co-DEGs, common DEGs; DEGs, differentially expressed genes; FC, fold-change; GO, Gene Ontology; KEGG, Kyoto Encyclopedia of Genes and Genomes; N, nasal; RW, recurrent wheezing; SA, school-age asthma; T, tracheal.
Figure 5
Figure 5
Consensus module-trait relationships across RW and SA in nasal (A, B) tracheal networks. Each module is represented by its eigengene value and Pearson correlation analysis between eigengene values and clinical traits was performed. Each color represents one consensus gene module. Each row corresponds to a module eigengene, and each column to a clinical trait. Each cell contains corresponding Pearson correlation coefficient (first number) and P-value (number in parenthesis). Green to purple gradient coloration implies increased Pearson correlation coefficient. Nasal orange module and tracheal plum module were significantly positively associated with RW, SA, atopy, and mast cells. RW, recurrent wheezing; SA, school-age asthma.
Figure 6
Figure 6
Key consensus module gene signatures can distinguish RW and SA from controls across both upper and lower airway samples. Heatmaps of expression patterns of 66 genes in nasal orange consensus module across all nasal samples (A) and 98 genes in tracheal plum consensus module across all tracheal samples (B), where genes and samples were ranked using hierarchical clustering. PCA across all nasal samples based on 66 genes in nasal orange module (C) and across all tracheal samples based on 98 genes in tracheal plum module (D). Dot plot showing enriched GO terms (BP, CC, and MF) and KEGG pathways for nasal orange module (E) and tracheal plum module (F), respectively. BP, biological process; CC, cellular component; KEGG, Kyoto Encyclopedia of Genes and Genomes; MF, molecular function; PCA, principal component analysis; RW, recurrent wheezing; SA, school-age asthma.

Similar articles

Cited by

References

    1. Bloom CI, Franklin C, Bush A, Saglani S, Quint JK. Burden of preschool wheeze and progression to asthma in the UK: Population-based cohort 2007 to 2017. J Allergy Clin Immunol (2021) 147(5):1949–58. doi: 10.1016/j.jaci.2020.12.643 - DOI - PubMed
    1. Martinez FD, Wright AL, Taussig LM, Holberg CJ, Halonen M, Morgan WJ. Asthma and wheezing in the first six years of life. the group health medical associates. N Engl J Med (1995) 332(3):133–8. doi: 10.1056/nejm199501193320301 - DOI - PubMed
    1. Stevens CA, Turner D, Kuehni CE, Couriel JM, Silverman M. The economic impact of preschool asthma and wheeze. Eur Respir J (2003) 21(6):1000–6. doi: 10.1183/09031936.03.00057002 - DOI - PubMed
    1. Luo G, Nkoy FL, Stone BL, Schmick D, Johnson MD. A systematic review of predictive models for asthma development in children. BMC Med Inform Decis Mak. (2015) 15:99. doi: 10.1186/s12911-015-0224-9 - DOI - PMC - PubMed
    1. Kwong CG, Bacharier LB. Phenotypes of wheezing and asthma in preschool children. Curr Opin Allergy Clin Immunol (2019) 19(2):148–53. doi: 10.1097/aci.0000000000000516 - DOI - PMC - PubMed

Publication types