. 2023 Jan 26:14:1051506.
doi: 10.3389/fimmu.2023.1051506. eCollection 2023.

DOG1 as a novel antibody-drug conjugate target for the treatment of multiple gastrointestinal tumors and liver metastasis

Affiliations

DOG1 as a novel antibody-drug conjugate target for the treatment of multiple gastrointestinal tumors and liver metastasis

Yangping Wu et al. Front Immunol. .

Abstract

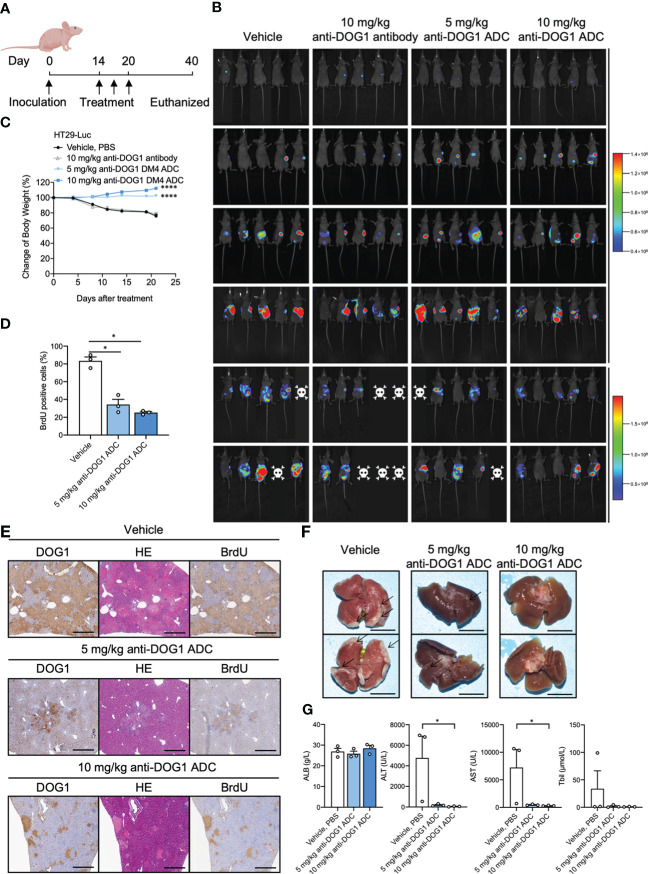
Discovered On Gastrointestinal stromal tumors protein 1 (DOG1), a major calcium-activated chloride channel, has been used as a common diagnostic marker for gastrointestinal stromal tumors. However, the therapeutic application of DOG1 was not well defined. Here, we aim to investigate its potential as a therapeutic target for an antibody-drug conjugate (ADC) in various cancers of the alimentary tract and metastasis. The DOG1 expression profile was determined among TCGA samples and tissue microarrays. High levels of DOG1 expression were ubiquitously observed in multiple cancer samples from the alimentary tract determined by TCGA samples and tissue microarrays. Circulating tumor cells isolated from metastatic colon cancer patients were also positive for DOG1 expression. The mechanisms of anti-DOG1 antibody were investigated by dual-luciferase reporter assay. The anti-DOG1 antibody could inhibit proliferation and metastasis via p53 signaling in limited cancer cell lines. The anti-DOG1 antibody was conjugated with a microtubule inhibitor DM4, to construct a new anti-DOG1-DM4-ADC to strengthen its activity. The anti-DOG1-DM4-ADC showed cytotoxicity at the nanomolar level in vitro. In the murine xenograft tumor models, treatment of anti-DOG1-DM4-ADC achieved a significant tumor growth inhibition rate. Our study indicates that anti-DOG1-DM4-ADC may be promising therapeutic molecules for DOG1-positive alimentary tract tumors and may be effective in inhibiting recurrence after curative resection of liver metastases of colorectal origin.

Keywords: DOG1; GIST; alimentary tract cancers; antibody-drug conjugate; liver metastasis.


Conflict of interest statement

The authors declare that the research was conducted in the absence of any commercial or financial relationships that could be construed as a potential conflict of interest.

Figures

Figure 1
Figure 1
DOG1 expression analysis at the gene and protein levels in tumor tissues and CTCs. (A) Venn diagram showing the overlaps between the overexpressed target sets for COAD: Colon adenocarcinoma, ESCA: Esophageal carcinoma, STAD: Stomach adenocarcinoma and MP: Membrane protein; (B) RNA-seq data of multiple gastrointestinal cancers from TCGA analyzed by UCSC Xena (the University of California, Santa Cruz) showed DOG1 RNA expression in primary tumors compared to normal tissues adjacent to the tumor. Axis units are log2 (normalized count+1). Student’s t test; (C) Representative immunohistochemical images for DOG1 protein expression in primary tumors. Positive IHC staining for DOG1 is indicated by a brown precipitate. Scale bar, 50 µm; (D) Representative IHC for DOG1in tissue samples from colon cancer patients with liver metastasis. Scar bar is 200 µm (left) and 100 µm (right); (E) DOG1 IHC scores of tissue samples from colon cancer patients with liver metastasis in (D–F) Immunoblot of DOG1 expression in tissue samples from colon cancer patients with liver metastasis by western blot. Quantitative analysis of DOG1 protein expression in tissue samples from colon cancer patients with liver metastasis by western blot (n=3). Commercial anti-DOG1 antibody sp31 used in (A-F) (G) Detection of DOG1+ CTCs from colon cancer patient by flow cytometry. Erythrocytes were lysed and cells were stained with an antibody cocktail against CD45, EpCam, Pan Cytokeratin (CK10, 14, 15, 16 and 19) and DOG1 (commercial antibody NBP2-34812AF405). EpCam+ CK+ CD45 tumor cells were detected by flow cytometry by first gating out the cell debris and cell clumps in the forward/side scatter plot (gate A). Then, the CD45+ (FITC) cells were excluded by gating at the CD45 cell population (gate B). The thresholds for specific EpCam (APC) and cytokeratin (PE) signals were determined using the sample stained with the isotype control antibodies (gate C). Gates were set to have no positive events above these thresholds in the control sample (gate C++); (H) The same gating strategy was then applied for detecting EpCam+ CK+ CD45 cells in the sample stained with the specific antibodies. DOG1+ (PB450) cells were sellected in gate (D) In this plasma sample of colon cancer patient with liver metastasis, 100% (1/1) DOG1+ cells were selected out in CTCs; (I) Kaplan–Meier survival curves for patients with cardia adenocarcinoma, gastric adenocarcinoma, hepatocellular carcinoma and colon adenocarcinoma with DOG1+/− staining are shown. Log-rank test. Comparison within groups: *P < 0.05; **P <0.01; ***P <0.001; ****P <0.0001.
Figure 2
Figure 2
DOG1 was expressed on the cell surface. (A) Representative graphs of DOG1 surface expression analyzed by flow cytometry. Blue is the isotype control group, and red is the anti-DOG1 antibody group; (B) Flow cytometric detection of DOG1 protein expression on the surface in various tumor cell lines, including GIST cells and colon, esophageal, liver and gastric cancer cells. Three independent experiments were performed; (C) DOG1 mRNA expression in various tumor cell lines, including GIST cells and colon, esophageal, liver and gastric cancer cells, were detected by qPCR. Three independent experiments were performed.
Figure 3
Figure 3
Anti-DOG1 antibody induced cell apoptosis and inhibited cell migration and invasion through p53 signaling pathway in HT-29 colon cancer cells. (A) The wound closure for HT-29 and GIST-882 was quantified at every 24 h post-wound (mean ± S.E.M., n = 6); (B) Representative image of wound healing assay in HT-29 cells at 0 h, 24 h and 48 h post wounding. The cells were treated with 100 nM and 200 nM anti-DOG1 antibody. Scale bar, 500 μm; (C) Migration (without Matrigel) and invasion (with Matrigel) of HT-29 cells were suppressed by the anti-DOG1 antibody compared with the control as shown by Transwell assays. Representative images are shown. Scale bar, 100 µm. Bar graphs of panel C are shown. Values are the mean ± SD; n=6; (D) Anti-DOG1 antibody-induced apoptosis in HT-29 cells. Apoptotic cells were quantified by Annexin V/PI double staining assay. HT-29 cells are treated with vehicle, 100 nM and 200 nM anti-DOG1 antibody for 48 h. Analysis on cell apoptosis results of I (n=3); (E) Flow cytometric analysis of the cell cycle distribution in HT-29 cells treated with vehicle, 100 nM and 200 nM anti-DOG1 antibody for 48 h. Bar graphs showing an increase of G1 phase and a decrease of S phase in cell cycle for the percentage of indicated cells in K (n=3), but without statistical significance; (F) Expression levels of 10 major cell signaling pathways in HT-29 cells treated with anti-DOG1 antibody. Values are the mean ± SD; n=3; (G) Relative mRNA-level of p53, Notch and TGFβ signaling of HT-29 cells after 48 h treatment with vehicle, 20 μM T16ainh-A01 and 200 nM anti-DOG1 antibody as determined by qRT-PCR. Data are normalized to the respective vehicle control and represent the mean ± SD; n=3; (H) Immunoblots of lysates from the HT-29 cell lines after 48 h treatment with vehicle, 20 μM T16ainh-A01, 100nM and 200 nM anti-DOG1 antibody. β-actin was used as control; (I) Bar graph showing quantitative analysis of protein expressions (n=3). Data were normalized by β-actin. Compared with the control group by one-way ANOVA. *P < 0.05; **P <0.01; ***P <0.001; ****P <0.0001.
Figure 4
Figure 4
DOG1 could mediate the internalization of anti-DOG1 antibodies. (A) The internalization rate of the anti-DOG1 antibody was calculated using the formula [1-MFItime/MFIcontrol]×100%. DOG1 on the cell surface was detected by flow cytometry (n=3); (B) Immunofluorescence microscopy observation of the endocytosis of Cy5.5-labeled anti-DOG1 DM4 ADC mediated by DOG1 protein in GIST882, HT-29, HepG2, and AGS cell lines. The results are from 0 h, 1 h, 4 h and 8 h. Antibodies were stained with Cy5.5, rhodamine-labeled phalloidin was used to visualize the actin cytoskeleton (green), and Hoechst (blue) was used for nuclear staining. Scale bar, 25 µm; (C) Bar graph showing quantitative analysis of protein expressions internalization rate of the immunofluorescence images (n=3). ***, P <0.001; ****, P <0.0001.
Figure 5
Figure 5
Anti-DOG1 ADCs showed potent in vitro and in vivo anti-tumor efficacy in multiple types of gastrointestinal tumor. (A) GIST882 and IM-resistant GIST882 cell lines were incubated with increasing concentrations of IM, unconjugated anti-DOG1 antibodies and anti-DOG1ADCs for 72 h. HT-29, HCT-116, LoVo, HepG2, HCC-LM3, MGC-803, and Kyse-410 cell lines were incubated with increasing concentrations of unconjugated anti-DOG1 antibodies and anti-DOG1 ADCs for 72 h. The cytotoxicity was calculated by IC50. NA: not active; (B) GIST PDX model (n=5); (C) HT-29 CDX model (n=5); (D) HepG2 CDX model (n=7); (E) MGC-803 CDX model (n=5); (F) Kyse-410 CDX model (n=5) were i.v. dosed Q3Dx3 as indicated (arrow) with vehicle, unconjugated anti-DOG1 antibodies at 10 mg/kg and anti-DOG1 ADCs at 5 or 10 mg/kg. Data from the tumor growth studies are depicted as the mean ± SEM. Compared with the control group by one-way ANOVA. ***P <0.001; ****P <0.0001. The body weight data are depicted as the mean ± SEM.
Figure 6
Figure 6
Anti-DOG1 antibody inhibited the experimental liver metastasis model of colon cancer. (A) Timeline of drug administration of the treated mice; (B) Bioluminescence on Day 1 to 35 post-HT-29-Luc cell injection; (C) The change in body weight during the experiment was calculated as the percent change in weight compared with the baseline measurement. Values are the mean ± SEM; n =5 mice per group; compared with the control group by one-way ANOVA; (D) BrdU positive rate of liver tissue on Day 35. Values are the mean ± SEM; n=3 mice per group; compared with the control group by one-way ANOVA; (E) DOG1, HE and BrdU IHC staining for liver tissue on Day 35; (F) Representative images of liver in the HT-29-Luc-bearing mice on Day 35; (G) The graph depicted ALB, ALT, AST Tbil on Day 40 after the inoculation. Values are the mean ± SEM; n=3 mice per group; compared with the control group by Friedman test or Kruskal-Wallis test. *P < 0.05; ****P <0.0001.

Similar articles

Cited by

References

    1. Bill A, Gaither LA. Ano1 as a novel drug target. Transporters as Drug Targets (2017), 231–52. doi: 10.1002/9783527679430.ch10 - DOI
    1. Huang F, Zhang H, Wu M, Yang H, Kudo M, Peters CJ, et al. . Calcium-activated chloride channel Tmem16a modulates mucin secretion and airway smooth muscle contraction. Proc Natl Acad Sci USA (2012) 109(40):16354–9. doi: 10.1073/pnas.1214596109 - DOI - PMC - PubMed
    1. Yu K, Jiang T, Cui Y, Tajkhorshid E, Hartzell HC. A network of phosphatidylinositol 4, 5-bisphosphate binding sites regulates gating of the Ca2+-activated cl– channel Ano1 (Tmem16a). Proc Natl Acad Sci (2019) 116(40):19952–62. doi: 10.1073/pnas.1904012116 - DOI - PMC - PubMed
    1. Tian Y, Schreiber R, Kunzelmann K. Anoctamins are a family of Ca2+-activated cl- channels. J Cell Sci (2012) 125(Pt 21):4991–8. doi: 10.1242/jcs.109553 - DOI - PubMed
    1. Yang YD, Cho H, Koo JY, Tak MH, Cho Y, Shim WS, et al. . Tmem16a confers receptor-activated calcium-dependent chloride conductance. Nature (2008) 455(7217):1210–5. doi: 10.1038/nature07313 - DOI - PubMed

Publication types

MeSH terms