. 2023 Feb;9(2):e13545.
doi: 10.1016/j.heliyon.2023.e13545. Epub 2023 Feb 5.

A multistate model and its standalone tool to predict hospital and ICU occupancy by patients with COVID-19

Affiliations

A multistate model and its standalone tool to predict hospital and ICU occupancy by patients with COVID-19

Miguel Lafuente et al. Heliyon. 2023 Feb.

Abstract

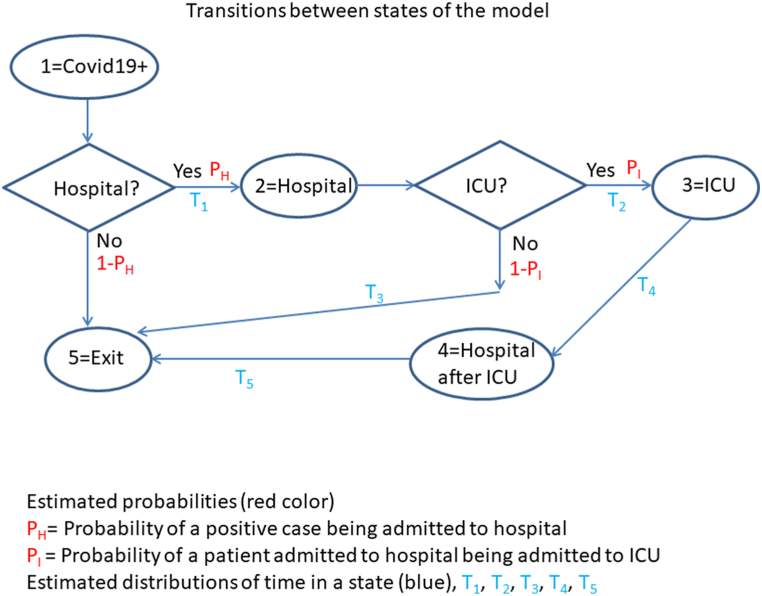
Objective: This study aims to build a multistate model and describe a predictive tool for estimating the daily number of intensive care unit (ICU) and hospital beds occupied by patients with coronavirus 2019 disease (COVID-19).

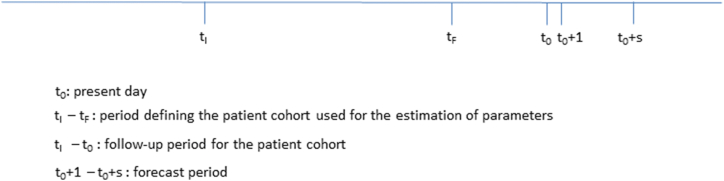
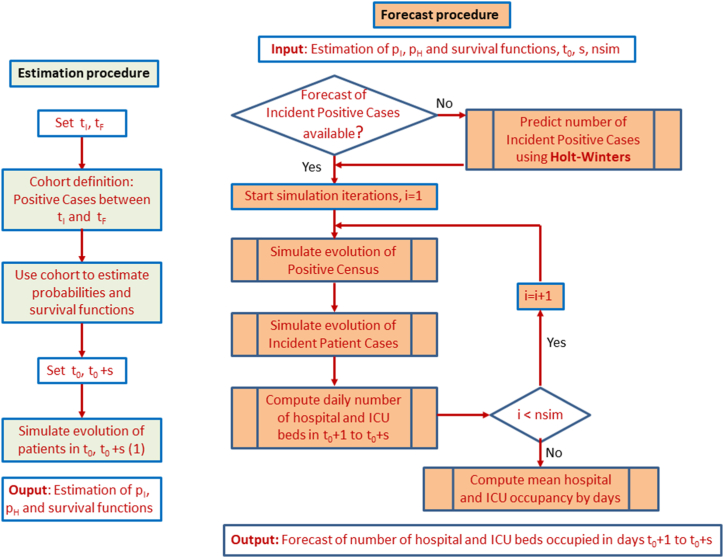
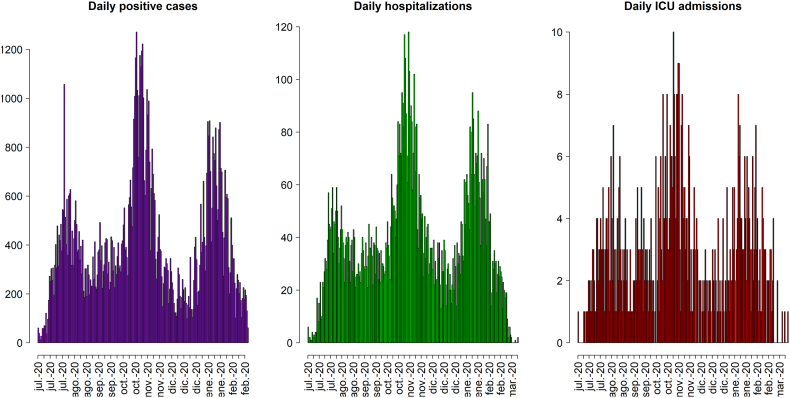
Material and methods: The estimation is based on the simulation of patient trajectories using a multistate model where the transition probabilities between states are estimated via competing risks and cure models. The input to the tool includes the dates of COVID-19 diagnosis, admission to hospital, admission to ICU, discharge from ICU and discharge from hospital or death of positive cases from a selected initial date to the current moment. Our tool is validated using 98,496 cases positive for severe acute respiratory coronavirus 2 extracted from the Aragón Healthcare Records Database from July 1, 2020 to February 28, 2021.

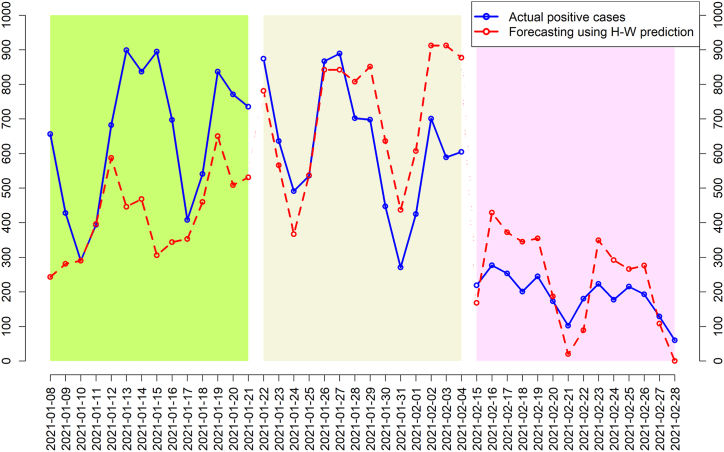
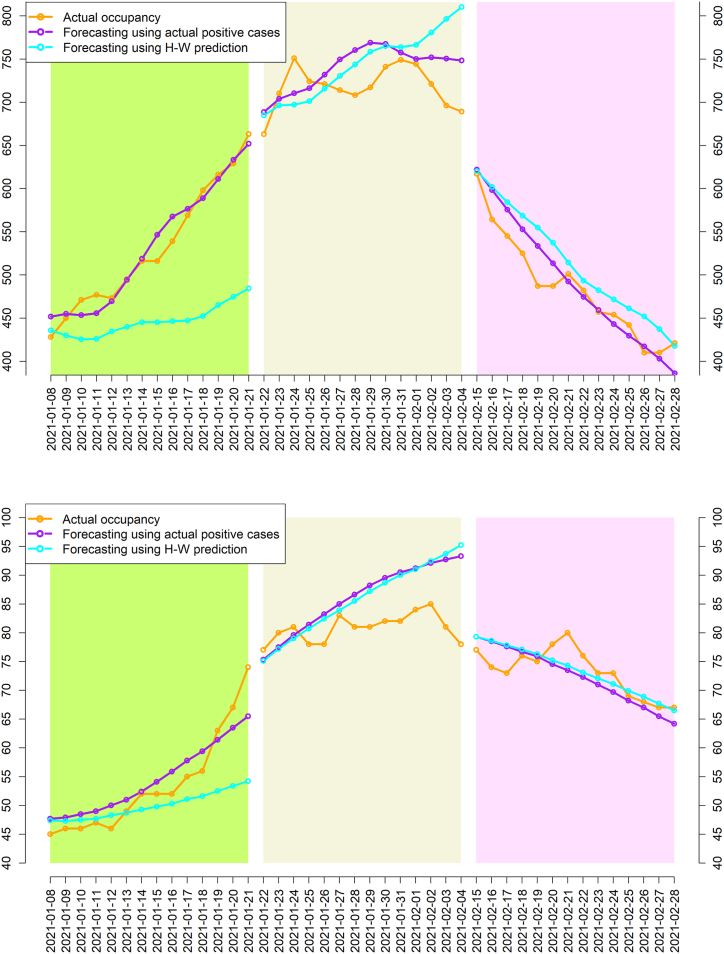
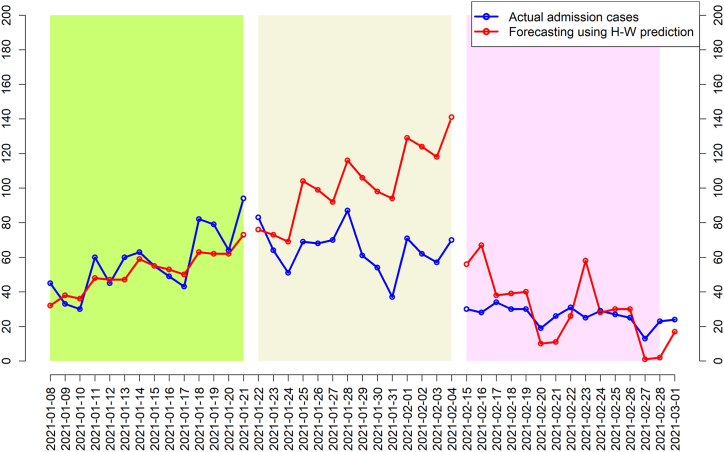
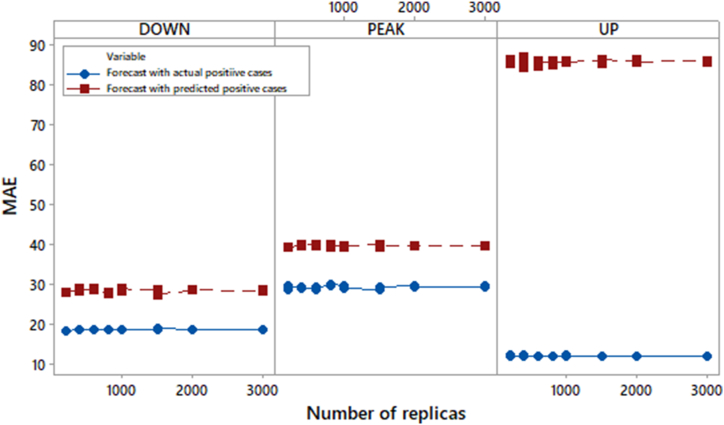
Results: The tool demonstrates good performance for the 7- and 14-days forecasts using the actual positive cases, and shows good accuracy among three scenarios corresponding to different stages of the pandemic: 1) up-scenario, 2) peak-scenario and 3) down-scenario. Long term predictions (two months) also show good accuracy, while those using Holt-Winters positive case estimates revealed acceptable accuracy to day 14 onwards, with relative errors of 8.8%.

Discussion: In the era of the COVID-19 pandemic, hospitals must evolve in a dynamic way. Our prediction tool is designed to predict hospital occupancy to improve healthcare resource management without information about clinical history of patients.

Conclusions: Our easy-to-use and freely accessible tool (https://github.com/peterman65) shows good performance and accuracy for forecasting the daily number of hospital and ICU beds required for patients with COVID-19.

Keywords: COVID-19; Health resources; Hospital and ICU occupancy; Multistate models; Predictive tool.


Conflict of interest statement

The authors declare no conflict of interest.

Figures

Fig. 1
Fig. 1
Multistate structure.
Fig. 2
Fig. 2
Periods defined in the estimation and forecast procedures.
Fig. 3
Fig. 3
Methodology flow chart to predict occupancy.
Fig. 4
Fig. 4
Actual positive cases, hospital and ICU bed occupancy between July 1, 2020 to February 28, 2021.
Fig. 5
Fig. 5
Actual positive cases and Holt-Winters positive cases estimation in 1: Up-scenario, cohort period: July 1, 2020 to January 7, 2021. Forecasting period: January 8, 2021 to January 21, 2021.2: Peak-scenario: cohort period: July 1, 2020 to January 21, 2021. Forecasting period: January 22, 2021 to February 4, 2021.3: Down-scenario: cohort period: July 1, 2020 to February 14, 2021. Forecasting period: February 15, 2021 to February 28, 2021. H–W: Holt-Winters.
Fig. 6
Fig. 6
Actual mean occupancy and predicted occupancy in hospital (top panel) and in ICU (bottom panel) in 1: Up-scenario, cohort period: July 1, 2020 to January 7, 2021. Forecasting period: January 8, 2021 to January 21, 2021.2: Peak-scenario: cohort period: July 1, 2020 to January 21, 2021. Forecasting period: January 22, 2021 to February 4, 2021.3: Down-scenario: cohort period: July 1, 2020 to February 14, 2021. Forecasting period: February 15, 2021 to February 28, 2021. H–W: Holt-Winters.
Fig. 7
Fig. 7
Actual hospital admission cases and Holt-Winters cases estimation in 1: Up-scenario, cohort period: July 1, 2020 to January 7, 2021. Forecasting period: January 8, 2021 to January 21, 2021.2: Peak-scenario: cohort period: July 1, 2020 to January 21, 2021. Forecasting period: January 22, 2021 to February 4, 2021.3: Down-scenario: cohort period: July 1, 2020 to February 14, 2021. Forecasting period: February 15, 2021 to February 28, 2021. H–W: Holt-Winters.
Fig. 8
Fig. 8
Sensitivity analysis of MAE depending on number of replications (nsim) in the simulation process.

Similar articles

Cited by

References

    1. Butler C.R., Wong S.P., Wightman A.G., O'Hare A.M. US clinicians' experiences and perspectives on resource limitation and patient care during the COVID-19 pandemic. JAMA Netw. Open. 2020;3(11) doi: 10.1001/jamanetworkopen.2020.27315. - DOI - PMC - PubMed
    1. Bertsimas D., Boussioux L., Cory-Wright R., Delarue A., Digalakis V., et al. From predictions to prescriptions: a data-driven response to COVID-19. Health Care Manag. Sci. 2021;24:253–272. doi: 10.1007/s10729-020-09542-0. - DOI - PMC - PubMed
    1. Larabi-Marie-Sainte S., Alhalawani S., Shaheen S., Almustafa K., Saba T., et al. Forecasting COVID19 parameters using time-series: KSA, USA, Spain and Brazil comparative case study. Heliyon. 2022;8 doi: 10.1016/j.heliyon.2022.e09578. - DOI - PMC - PubMed
    1. Gnanvi J.E., Salako K.V., Kotanmi G.B., Kakaï R.G. On the reliability of predictions on COVID-19 dynamics: a systematic and critical review of modelling techniques. Infect Dis Model. 2021;6:258–272. doi: 10.1016/j.idm.2020.12.008. - DOI - PMC - PubMed
    1. Zhang W., Liu S., Osgood N., Zhu H., Qian Y Y., Jia P. Using simulation modelling and systems science to help contain COVID-19: a systematic review. Syst. Res. Behav. Sci. 2022:1–28. doi: 10.1002/sres.2897. - DOI - PMC - PubMed

LinkOut - more resources