. 2022 Mar;3(1):41-60.
doi: 10.3390/neuroglia3010003. Epub 2022 Mar 6.

Unique Astrocyte Cytoskeletal and Nuclear Morphology in a Three-Dimensional Tissue-Engineered Rostral Migratory Stream

Affiliations

Unique Astrocyte Cytoskeletal and Nuclear Morphology in a Three-Dimensional Tissue-Engineered Rostral Migratory Stream

Erin M Purvis et al. Neuroglia. 2022 Mar.

Abstract

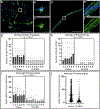
Neural precursor cells (NPCs) are generated in the subventricular zone (SVZ) and travel through the rostral migratory stream (RMS) to replace olfactory bulb interneurons in the brains of most adult mammals. Following brain injury, SVZ-derived NPCs can divert from the RMS and migrate toward injured brain regions but arrive in numbers too low to promote functional recovery without experimental intervention. Our lab has biofabricated a "living scaffold" that replicates the structural and functional features of the endogenous RMS. This tissue-engineered rostral migratory stream (TE-RMS) is a new regenerative medicine strategy designed to facilitate stable and sustained NPC delivery into neuron-deficient brain regions following brain injury or neurodegenerative disease and an in vitro tool to investigate the mechanisms of neuronal migration and cell-cell communication. We have previously shown that the TE-RMS replicates the basic structure and protein expression of the endogenous RMS and can direct immature neuronal migration in vitro and in vivo. Here, we further describe profound morphological changes that occur following precise physical manipulation and subsequent self-assembly of astrocytes into the TE-RMS, including significant cytoskeletal rearrangement and nuclear elongation. The unique cytoskeletal and nuclear architecture of TE-RMS astrocytes mimics astrocytes in the endogenous rat RMS. Advanced imaging techniques reveal the unique morphology of TE-RMS cells that has yet to be described of astrocytes in vitro. The TE-RMS offers a novel platform to elucidate astrocyte cytoskeletal and nuclear dynamics and their relationship to cell behavior and function.

Keywords: astrocyte; cell morphology; cytoskeleton; nuclear morphology; nucleus; rostral migratory stream; tissue engineering.


Conflict of interest statement

Conflicts of Interest: There are no other potential conflicts of interest to disclose.

Figures
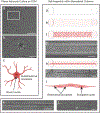
Figure 1.
Figure 1.
Tissue-engineered rostral migratory stream astrocytes possess unique cellular morphology compared to planar astrocytes. Phase microscope image of planar astrocytes in culture (a) with magnified view depicting planar astrocyte morphology in higher detail (b). Planar astrocytes possess round nuclei and have multidirectional processes that extend radially around the cell (c). TE-RMSs are fabricated in hollow agarose microcolumns (d) that are loaded with collagen (e) and then following collagen polymerization are seeded with a concentrated astrocyte suspension (f,g). Astrocytes pull the polymerized collagen off the inner lumen of the microcolumn and use it to align themselves in longitudinal bundles tethered to either end of the microcolumn (h,i). TE-RMS astrocytes possess elongated nuclei and bidirectional processes that preferentially extend in parallel with the microcolumn (j). Magnified phase images depict these longitudinally aligned bundles of astrocytes exhibiting this unique morphology (k,l). Scale bars: 200 microns (a,g,k), 50 microns (b), 500 microns (i), 100 microns (l).
Figure 2.
Figure 2.
Quantification of nuclear and cytoskeletal measurements. Representative fluorescent image of single planar astrocyte (a) depicting nuclear (Hoechst, blue) and cytoskeleton (GFAP, green) labels. To perform nuclear length measurements, Hoechst channel was isolated (b) and FIJI “find edges” function was applied (c). To measure the long nuclear axis, a line was drawn across the longest distance from one edge of the nucleus to another (d). To measure the short nuclear axis, a line was drawn from one edge of the nucleus to the other and perpendicular to the long nuclear axis (e). GFAP channel was isolated (f). Main processes were GFAP extensions arising directly from the nucleus (g) and branch points were GFAP extensions arising from other GFAP extensions (h). To perform angle measurements, long and short nuclear axes were viewed in image depicting Hoechst and GFAP channels (i). An angle was drawn with the first point of the angle placed on the cell process (at the point where the process contacted the cell body), the second point (middle) of the angle was placed on the intersection of the cell’s long and short nuclear axes, and the third point of the angle placed on the end of the long nuclear axis (the end closer to the cell process) (j,k). Scale bar: 50 microns (a). *: main processes (g) and branch points (h).
Figure 3.
Figure 3.
TE-RMS astrocytes exhibit distinct cytoskeletal architecture compared to planar astrocytes. Representative 20× fluorescent image of planar astrocyte culture (a) with zoom-in on one single astrocyte depicting nuclear (Hoechst, blue) and cytoskeleton (GFAP, green) labels (b) and just the cytoskeleton label (c). Representative 20× fluorescent image of TE-RMS (d) with zoom-in on one single astrocyte depicting nuclear (Hoechst) and cytoskeleton (GFAP) labels (e) and just the cytoskeleton label (f). Nested t-test analysis of number of main cell processes in independent planar (n = 6) versus TE-RMS (n = 9) cultures (g). Each point represents a single cell and bars represent the median of each group. Nested t-test analysis of number of branch points in independent planar and TE-RMS cultures (h). Each point represents a single cell and bars represent the median of each group. The angle of each main process was measured as it deviates from the long nuclear axis. Nested t-test analysis with each point representing the median angle from each cell and the graph bars representing the median of each group (i). All quantified angles (n = 1069 planar; n = 644 TE-RMS) (j). **** p < 0.0001. Scale bars: 200 microns (a,d), 50 microns (b,c,e,f).
Figure 4.
Figure 4.
Endogenous RMS astrocytes exhibit distinct cytoskeletal architecture compared to surrounding protoplasmic astrocytes. Schematic depicting sagittal rat brain slice (a) and the subventricular zone-rostral migratory stream-olfactory bulb pathway (b). Representative fluorescent image of a sagittal rat brain slice with nuclear Hoechst stain (blue) and immunostaining for GFAP (green) at 20× magnification (c). Call out boxes highlight the cytoskeleton of a protoplasmic astrocyte (d) and RMS astrocytes (e). Nested t-test analysis of the number of main cell process possessed by protoplasmic versus RMS astrocytes (n = 5, within-subjects) (f). Each point represents a single cell and bars represent the median of each group. Nested t-test analysis of the number of branch points possessed by protoplasmic and RMS astrocytes (g). Each point represents a single cell and bars represent the median of each group. The angle of each main process was measured as it deviates from the long nuclear axis. Nested t-test analysis with each point representing the median angle from each cell and the graph bars representing the median of each group (h). Each point represents the median of each cell and bars represent the median of each group. All quantified angles (n = 585 protoplasmic; n = 303 RMS) (i). **** p < 0.0001, ** p < 0.01. Scale bars: 200 microns (c), 40 microns (d,e).
Figure 5.
Figure 5.
TE-RMS astrocytes have elongated nuclei compared to planar astrocytes. Representative 20× fluorescent image of planar astrocyte culture (a) with zoom-in on one single astrocyte depicting nuclear (Hoechst, blue) and cytoskeleton (GFAP, green) labels (b) and just nuclear label (c). Representative 20× fluorescent image of TE-RMS (d) with zoom-in on one single astrocyte depicting nuclear (Hoechst) and cytoskeleton (GFAP) labels (e) and just nuclear label (f). Example planar nucleus (c) and non-overlapping TE-RMS nuclei (f) are outlined in white. Nested t-test analysis of nuclear aspect ratio of planar astrocytes versus TE-RMS astrocytes (g). Each point represents a single cell and bars represent the median of each group. Frequency distribution of the nuclear aspect ratio of planar and TE-RMS astrocytes (h). **** p < 0.0001. Scale bars: 200 microns (a,d), 50 microns (b,c,e,f).
Figure 6.
Figure 6.
Endogenous RMS astrocytes have elongated nuclei compared to surrounding protoplasmic astrocytes. Representative fluorescent image of a sagittal rat brain slice with nuclear Hoechst stain (blue) and immunostaining for GFAP (green) at 20× magnification (a) highlighting the nuclei of a protoplasmic astrocyte (b) and several RMS astrocytes (c). Example nuclei are outlined in white (b,c). Nested t-test analysis of nuclear aspect ratios of protoplasmic astrocytes versus RMS astrocytes (d). Each point represents a single cell and bars represent the median of each group. Frequency distribution of the nuclear aspect ratio of endogenous protoplasmic and RMS astrocytes (e). *** p = 0.0007. Scale bars: 200 microns (a), 40 microns (b,c).
Figure 7.
Figure 7.
High magnification fluorescent imaging depicting novel astrocyte morphology. High magnification (100×) fluorescent imaging highlighting differences in nuclear shape and intermediate filament arrangement between single planar astrocytes (af) and TE-RMS astrocytes (g,h). Nuclei (Hoechst) depicted in blue and intermediate filaments (GFAP) in green. All images are compressed confocal z-stacks. Scale bars: 50 microns (ah).
Figure 8.
Figure 8.
Scanning electron microscopy imaging depicting novel astrocyte morphology. SEM imaging of planar astrocytes (ac) and TE-RMSs (di). Single planar astrocytes (ac) display process complexity and heterogeneity in morphology. Full length TE-RMS (d) with magnified view (e) depicting longitudinally aligned, bundled astrocyte processes coated in a fine meshwork of collagen. Single elongated cell with bidirectional processes visible within TE-RMS bundle (f). TE-RMS with four distinct astrocytes with visibly connected processes (g). Magnified views (h,i) depicting two cells (h) and one cell (i) visible on top of collagen network that encompasses TE-RMS construct. Black arrows (fi) indicate individual cell bodies visible within the TE-RMS, highlighting their distinct morphology. Scale bars: 10 microns (i), 30 microns (h), 50 microns (a,b,e,f), 100 microns (c,g), 1 mm (d).

Similar articles

Cited by

References

    1. Ming G-L; Song H. Adult Neurogenesis in the Mammalian Brain: Significant Answers and Significant Questions. Neuron 2011, 70, 687–702. - PMC - PubMed
    1. Zhao C; Deng W; Gage FH Mechanisms and Functional Implications of Adult Neurogenesis. Cell 2008, 132, 645–660. - PubMed
    1. Lledo P-M; Merkle FT; Alvarez-Buylla A. Origin and Function of Olfactory Bulb Interneuron Diversity. Trends Neurosci. 2008, 31, 392–400. - PMC - PubMed
    1. Lim DA; Alvarez-Buylla A. The Adult Ventricular-Subventricular Zone (V-SVZ) and Olfactory Bulb (OB) Neurogenesis. Cold Spring Harb. Perspect. Biol 2016, 8, a018820. - PMC - PubMed
    1. Lazarini F; Lledo P-M Is Adult Neurogenesis Essential for Olfaction? Trends Neurosci. 2011, 34, 20–30. - PubMed

LinkOut - more resources