. 2023 Jan 26:14:1040425.
doi: 10.3389/fphys.2023.1040425. eCollection 2023.

Peripheral blood flow estimated by laser doppler flowmetry provides additional information about sleep state beyond that provided by pulse rate variability

Affiliations

Peripheral blood flow estimated by laser doppler flowmetry provides additional information about sleep state beyond that provided by pulse rate variability

Zhiwei Fan et al. Front Physiol. .

Abstract

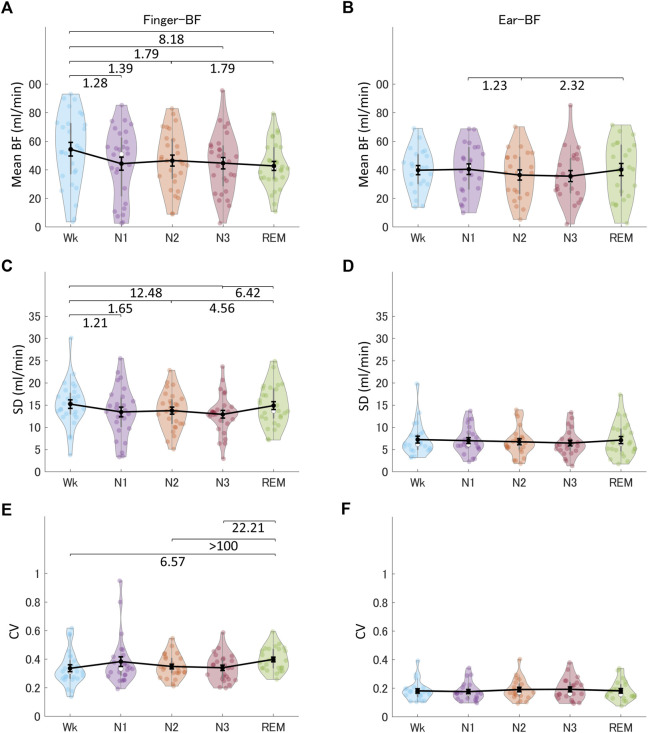
Pulse rate variability (PRV), derived from Laser Doppler flowmetry (LDF) or photoplethysmography, has recently become widely used for sleep state assessment, although it cannot identify all the sleep stages. Peripheral blood flow (BF), also estimated by LDF, may be modulated by sleep stages; however, few studies have explored its potential for assessing sleep state. Thus, we aimed to investigate whether peripheral BF could provide information about sleep stages, and thus improve sleep state assessment. We performed electrocardiography and simultaneously recorded BF signals by LDF from the right-index finger and ear concha of 45 healthy participants (13 women; mean age, 22.5 ± 3.4 years) during one night of polysomnographic recording. Time- and frequency-domain parameters of peripheral BF, and time-domain, frequency-domain, and non-linear indices of PRV and heart rate variability (HRV) were calculated. Finger-BF parameters in the time and frequency domains provided information about different sleep stages, some of which (such as the difference between N1 and rapid eye movement sleep) were not revealed by finger-PRV. In addition, finger-PRV patterns and HRV patterns were similar for most parameters. Further, both finger- and ear-BF results showed 0.2-0.3 Hz oscillations that varied with sleep stages, with a significant increase in N3, suggesting a modulation of respiration within this frequency band. These results showed that peripheral BF could provide information for different sleep stages, some of which was complementary to the information provided by PRV. Furthermore, the combination of peripheral BF and PRV may be more advantageous than HRV alone in assessing sleep states and related autonomic nervous activity.

Keywords: autonomic nervous activity; blood flow; heart rate variability; pulse rate variability; respiration; sleep stages.


Conflict of interest statement

Authors SH, JE, and TW are employed by KYOCERA Corporation, Japan. The authors declare that this study received funding from KYOCERA Corporation. The funder had the following involvement in the study: study design and decision to publish. The remaining authors declare that the research was conducted in the absence of any commercial or financial relationships that could be construed as a potential conflict of interest.

Figures

FIGURE 1
FIGURE 1
The devices used to measure finger- and ear- BF.
FIGURE 2
FIGURE 2
The indices of finger-BF and ear-BF in the time domain, including the mean (A, B), SD (C, D), and CV (E, F) of BF, across the different sleep stages. The violin plot with dots shows the distribution of the individual data points. The line chart with error bars shows the group mean and the ±1 standard error of the mean. The numerical values are the Bayes factors. The values show anecdotal (1–3), moderate (3–10), strong (10–30), or extreme evidence (>100) against the H0 of no difference between pairs of sleep stages (for other information, see Supplementary Table S6). Bayes factors <1 are not listed. BF, blood flow; SD, standard deviation; CV, coefficient of variance.
FIGURE 3
FIGURE 3
The indices of finger-BF and ear-BF in the frequency domain, including the LFn (A, B), HFn (C, D), and LF/HF (E, F) of BF, across the different sleep stages. The violin plot with dots shows the distribution of the individual data points. The line chart with error bars shows the group mean and the ±1 standard error of the mean. The numerical values are the Bayes factors. The values show anecdotal (1–3), moderate (3–10), strong (10–30), very strong (30–100), or extreme (>100) evidence against the H0 of no difference between the pairs of sleep stages (for other information, see Supplementary Table S6). Bayes factors <1 are not listed. LFn, normalized low-frequency power; HFn, normalized high-frequency power; LF, low-frequency power; HF, high-frequency power; BF, blood flow; AF, airflow.
FIGURE 4
FIGURE 4
BF modulated by oscillations within the 0.2–0.3 Hz band (A) A representative epoch of the raw BF signal modulated by 0.2–0.3 Hz oscillations during N3 recorded from a representative participant. The red dotted curve represents the oscillating signal filtered from the raw BF signal with a band-pass frequency of 0.2–0.3 Hz; however, it has been shifted upwards to make it easier to read. The blue curve is the raw BF signal (B) The normalized power spectrum of a representative participant at different sleep stages. It shows a peak in the 0.2–0.3 Hz frequency band during N3. BF, blood flow.
FIGURE 5
FIGURE 5
The normalized power spectra and the normalized power in the 0.2–0.3 Hz band of finger-BF, ear-BF, and AF, across the different sleep stages (A–C) The normalized power spectra for finger-BF (A), ear-BF (B), and AF (C) (D–F) The normalized power of the 0.2–0.3 Hz band for finger-BF (D), ear-BF (E), and AF (F). There was a linear trend of power increase in the 0.2–0.3 Hz band with the deepening of sleep from N1 to N3 for both finger- and ear- BF. The violin plot with dots shows the distribution of the individual data points. The line chart with error bars shows the group mean and the ±1 standard error of the mean. The numerical values are the Bayes factors. The values show anecdotal (1–3), moderate (3–10), very strong (30–100), or extreme (>100) evidence against the H0 of no difference between pairs of sleep stages (for other information, see Supplementary Table S6). Bayes factors <1 are not listed. BF, blood flow; HF, high-frequency power.
FIGURE 6
FIGURE 6
Mean IBIs across the different sleep stages for the heart (A), the finger (B), and the ear (C). The violin plot with dots shows the distribution of the individual data points. The line chart with error bars shows the group mean and the ±1 standard error of the mean. The numerical values are the Bayes factors. The values show anecdotal (1–3), moderate (3–10), strong (10–30), very strong (30–100), or extreme (>100) evidence against the H0 of no difference between pairs of sleep stages (for other information, see Supplementary Table S6). Bayes factors <1 are not listed. IBI, inter-beat interval.
FIGURE 7
FIGURE 7
The indices of HRV (A, D, G), finger-PRV (B, E, H), and ear-PRV (C, F, I) in the time domain, including SDNN (A–C), RMSSD (D–F), and pNN50 (G–I), across the different sleep stages. The violin plot with dots shows the distribution of the individual data points. The line chart with error bars shows the group mean and the ±1 standard error of the mean. The numerical values are the Bayes factors. The values show anecdotal (1–3), moderate (3–10), strong (10–30), very strong (30–100), or extreme (>100) evidence against the H0 of no difference between pairs of sleep stages (for other information, see Supplementary Table S6). Bayes factors <1 are not listed. HRV, heart rate variability; PRV, pulse rate variability; SDNN, standard deviation of all the normal-to-normal (NN) intervals; RMSSD, root mean square of successive differences between adjacent NN intervals; pNN50, percentage of pairs of adjacent NN intervals differing by more than 50 ms; IBI, inter-beat interval.
FIGURE 8
FIGURE 8
The indices of HRV (A, D, G), finger-PRV (B, E, H), and ear-PRV (C, F, I) in the frequency domain, including LFn (A–C), HFn (D–F), and LF/HF (G–I), across the different sleep stages. The violin plot with dots shows the distribution of the individual data points. The line chart with error bars shows the group mean and the ±1 standard error of the mean. The numerical values are the Bayes factors. The values show anecdotal (1–3), moderate (3–10), strong (10–30), very strong (30–100), or extreme (>100) evidence against the H0 of no difference between pairs of sleep stages (for other information, see Supplementary Table S6). Bayes factors <1 are not listed. HRV, heart rate variability; PRV, pulse rate variability; LF, low-frequency power; HF, high-frequency power; LFn, normalized low-frequency power; HFn, normalized high-frequency power; IBI, inter-beat interval.
FIGURE 9
FIGURE 9
The indices of HRV (A, D, G), finger-PRV (B, E, H), and ear-PRV (C, F, I) in non-linear measurements, including ApEn (A–C), DFA1 (D–F), and DFA2 (G–I), across the different sleep stages. The violin plot with dots shows the distribution of the individual data points. The line chart with error bars shows the group mean and the ±1 standard error of the mean. The numerical values are the Bayes factors. The values show anecdotal (1–3), moderate (3–10), strong (10–30), very strong (30–100), or extreme (>100) evidence against the H0 of no difference between pairs of sleep stages (for other information, see Supplementary Table S6). Bayes factors <1 are not listed. HRV, heart rate variability; PRV, pulse rate variability; ApEn, approximate entropy; DFA, detrended fluctuation analysis; IBI, inter-beat interval.

Similar articles

References

    1. Allen J. (2007). Photoplethysmography and its application in clinical physiological measurement. Physiol. Meas. 28, R1–R39. 10.1088/0967-3334/28/3/R01 - DOI - PubMed
    1. Altini M., Casale P., Penders J., Ten Velde G., Plasqui G., Amft O. (2016). Cardiorespiratory fitness estimation using wearable sensors: Laboratory and free-living analysis of context-specific submaximal heart rates. J. Appl. Physiol. 120, 1082–1096. 10.1152/japplphysiol.00519.2015 - DOI - PubMed
    1. Altini M., Kinnunen H. (2021). The promise of sleep: A multi-sensor approach for accurate sleep stage detection using the oura ring. Sensors (Basel). 21, 4302–4321. 10.3390/s21134302 - DOI - PMC - PubMed
    1. Barnett W. H., Latash E. M., Capps R. A., Dick T. E., Wehrwein E. A., Molkov Y. I. (2020). Traube–Hering waves are formed by interaction of respiratory sinus arrhythmia and pulse pressure modulation in healthy men. J. Appl. Physiol. 129, 1193–1202. 10.1152/japplphysiol.00452.2020 - DOI - PMC - PubMed
    1. Bayer L., Constantinescu I., Perrig S., Vienne J., Vidal P. P., Muhlethaler M., et al. (2011). Rocking synchronizes brain waves during a short nap. Curr. Biol. 21, R461–R462. 10.1016/j.cub.2011.05.012 - DOI - PubMed