. 2023 Jan 26:14:1124355.
doi: 10.3389/fphys.2023.1124355. eCollection 2023.

Impact of exogenous hydrogen peroxide on osteogenic differentiation of broiler chicken compact bones derived mesenchymal stem cells

Affiliations

Impact of exogenous hydrogen peroxide on osteogenic differentiation of broiler chicken compact bones derived mesenchymal stem cells

Y H Tompkins et al. Front Physiol. .

Abstract

The effects of hydrogen peroxide (H2O2) on the osteogenic differentiation of primary chicken mesenchymal stem cells (MSCs) were investigated. MSCs were subjected to an osteogenic program and exposed to various concentrations of H2O2 for 14 days. Results showed that high concentrations of H2O2 (200 and 400 nM) significantly increased pro-apoptotic marker CASP8 expression and impaired osteogenic differentiation, as indicated by decreased mRNA expression levels of osteogenesis-related genes and reduced in vitro mineralization. In contrast, long-term H2O2 exposure promoted basal expression of adipogenic markers at the expense of osteogenesis in MSCs during osteogenic differentiation, and increased intracellular reactive oxygen species (ROS) production, as well as altered antioxidant enzyme gene expression. These findings suggest that long-term H2O2-induced ROS production impairs osteogenic differentiation in chicken MSCs under an osteogenic program.

Keywords: bone health; cell differentiation; cellular ROS; chicken MSCs; oxidative stress.


Conflict of interest statement

The authors declare that the research was conducted in the absence of any commercial or financial relationships that could be construed as a potential conflict of interest.

Figures

FIGURE 1
FIGURE 1
Effects of H2O2 on the cell viability. Cells were treated with the indicated concentrations of H2O2 for 6 h (A), 24 h (B) and 48 h (C). The graphs show changes in cellular growth as assessed by MTT assays. The MTT assay showed that exposure to concentrations higher than 400 nM of H2O2 can reduce cell viability. Therefore, the appropriate H2O2 concentration was screened out and final treatment concentrations of 100 nM, 200 nM and 400 nM of H2O2 were selected as the treatments dose for the following experiments. a, b Treatments with different letters indicate a significantly difference between treatments using Tukey’s HSD test, p < 0.05; data are shown as mean ± SEM of four independent replicates (n = 4).
FIGURE 2
FIGURE 2
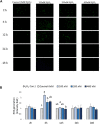
Effects of H2O2-induced reactive oxygen species (ROS) production in chicken MSCs. 3 × 10⁴ cells were seeded in a black clear-flat-bottom 96-well microplate and allowed to adhere overnight. Cells were then treated with the indicated concentrations of H2O2 for 2 h, 6 h, 12 h, 24 h and 48 h. ROS levels in MSCs were measured using a DCFDA/H2DCFDA cellular ROS assay kit. MSCs cultured without H2O2 but PBS (osteogenic differentiation medium with 0 nM H2O2) were used as the control. (A) Figures were selected as representative images from the DCFDA/H2DCFDA cellular ROS assay at different time points. MSCs cultured without any treatments or DCFDA/H2DCFDA was used to set the background adjustment. (B) Quantitative analysis was performed by measuring fluorescence intensity. Each value represents the mean ± SEM of three independent replicates (n = 3). MSCs cultured in osteogenic differentiation medium without H2O2 treatment (0 nM H2O2) were used as the control, and data were present as fold-change normalized to the fluorescence intensity level of the control. a, ab, b, c Treatments with different letters indicate a significantly difference between treatments using Tukey’s HSD test, p < 0.05.
FIGURE 3
FIGURE 3
Effects of H2O2 on mRNA expression of apoptosis markers in chicken MSCs. Differentiation cells were treated with the indicated concentrations of H2O2 for 6 h, 24 h, 48 h, 72 h, 96 h, 5 days, 6 days, 10 days and 14 days. Each value represents the mean ± SEM of three independent experiments (n = 3). CASP3: caspase three; CASP6: caspase six; CASP8: caspase eight; a, ab, b, c Treatments with different letters indicate a significantly difference between treatments using Tukey’s HSD test, p < 0.05.
FIGURE 4
FIGURE 4
Effects of H2O2 on mRNA expression of antioxidant enzymes in chicken MSCs. Cells were treated with the indicated concentrations of H2O2 for 6 h, 24 h, 48 h, 72 h, 96 h, 5 days, 6 days, 10 days and 14 days. The expression of SOD2, GSTa and NRF2 was not detected on day 10 and day 14 of differentiation. Each value represents the mean ± SEM of three independent experiments (n = 3). CAT: catalase; SOD1: superoxide dismutase one; SOD2: superoxide dismutase two; GPX1: glutathione peroxidase one; NOS2: nitric oxide synthase two; NFR2: GA binding protein transcription factor alpha subunit (GABP2); GSTa: glutathione S-transferase alpha two; a, ab, b Treatments with different letters indicate a significantly difference between treatments using Tukey’s HSD test, p < 0.05.
FIGURE 5
FIGURE 5
Effects of H2O2 on mRNA expression of osteogenic differentiation markers in chicken MSCs. Cells were treated with the indicated concentrations of H2O2 in differentiation medium for 6 h, 24 h, 48 h, 72 h, 96 h, 5 days, 6 days, 10 days and 14 days. Each value represents the mean ± SEM of three independent experiments (n = 3). SPP1: secreted phosphoprotein, osteopontin; BMP2: bone morphogenetic protein two; BGLAP: bone gamma-carboxyglutamic acid-containing protein (osteocalcin); RUNX2: runt-related transcription factor 2; ALP: alkaline phosphatase, biomineralization associated; Col1A2: collagen type I alpha two chain. a, ab, b, c Treatments with different letters indicate a significantly difference between treatments using Tukey’s HSD test, p < 0.05.
FIGURE 6
FIGURE 6
Alizarin red S staining for mineralization on day 6, day 10 and day 14. Images were randomly acquired at ×2 magnification. The calcified nodules appeared bright red in color. Mineral deposit quantification was conducted, with each value representing the mean ± SEM of three independent experiments (n = 3). a, b Treatments with different letters indicate a significantly difference between treatments using Tukey’s HSD test at each time points, respectively, p < 0.05.
FIGURE 7
FIGURE 7
The von Kossa staining results for mineralization on day 6, day 10 and day 14. (A) Images were randomly acquired in ×4 magnification for day 6 and 10 images. On day 14, the figure was acquired at ×2 magnification due to mineralization interrupting autofocus using higher magnification lenses. Four images per well were analyzed. Black objects indicates phosphate and calcium deposition. ImageJ analysis quantified the percent area fraction for each treatment based on three independently sampled experiments of each species, with each value representing the mean ± SEM of three independent experiments (n = 3). a, b Treatments with different letters indicate a significantly difference between treatments using Tukey’s HSD test at each time points, respectively; p < 0.05.

Similar articles

Cited by

References

    1. Adhikari R., Chen C., Waters E., West F. D., Kim W. K. (2018). Isolation and differentiation of mesenchymal stem cells from broiler chicken compact bones. Front. Physiol. 9, 1892. 10.3389/fphys.2018.01892 - DOI - PMC - PubMed
    1. Ali Hassan N., Li Z. (2021). Oxidative stress in broiler chicken and its consequences on meat quality. Int. J. Life Sci. Res. Archive 1 (1), 045–054. 10.53771/ijlsra.2021.1.1.0054 - DOI
    1. Altindag O., Erel O., Aksoy N., Selek S., Celik H., Karaoglanoglu M. (2007). Increased oxidative stress and its relation with collagen metabolism in knee osteoarthritis. Rheumatol. Int. 27 (4), 339–344. 10.1007/s00296-006-0247-8 - DOI - PubMed
    1. Atashi F., Modarressi A., Pepper M. S. (2015). The role of reactive oxygen species in mesenchymal stem cell adipogenic and osteogenic differentiation: A review. Stem Cells Dev. 24 (10), 1150–1163. 10.1089/scd.2014.0484 - DOI - PMC - PubMed
    1. Blair H. C., Larrouture Q. C., Li Y., Lin H., Beer-Stoltz D., Liu L., et al. (2017). Osteoblast differentiation and bone matrix formation in vivo and in vitro . Tissue Eng. Part B Rev. 23 (3), 268–280. 10.1089/ten.TEB.2016.0454 - DOI - PMC - PubMed