. 2023 Jan 15;13(1):143-160.
eCollection 2023.

Using PDX animal models to identify and stratify adenoid cystic carcinoma patients presenting an enhanced response to HDAC inhibitors

Affiliations

Using PDX animal models to identify and stratify adenoid cystic carcinoma patients presenting an enhanced response to HDAC inhibitors

Leticia DA Guimarães et al. Am J Cancer Res. .

Abstract

Adenoid cystic carcinoma (ACC) patients face a highly infiltrative and metastatic disease characterized by poor survival rates and suboptimal response to available therapies. We have previously shown that sensitization of ACC tumors to chemotherapy using histone deacetylase inhibitors (HDACi) constitutes a promising therapeutic strategy to manage tumor growth. Here, we used patient-derived xenografts (PDX) from ACC tumors to evaluate the effects of in vivo administration of the HDAC inhibitor Entinostat combined with Cisplatin over tumor growth. RNA from PDX tumor samples receiving the proposed therapy were analyzed using NanoString technology to identify molecular signatures capable of predicting ACC response to the therapy. We also used an RNAseq dataset from 68 ACC patients to validate the molecular signature identified by the NanoString platform. We found that the administration of Entinostat combined with Cisplatin resulted in a potent tumor growth inhibition (TGI) ranging from 38% to 106% of the original tumor mass. Enhanced response to therapy is consistent with the reactivation of tumor suppressor genes, including SFRP1, and the downregulation of oncogenes like FGF8 and CCR7. Nanostring data from PDX tumors identified a genetic signature capable of predicting tumor response to therapy. We further stratified 68 ACC patients containing RNAseq data accordingly to the activity levels of the identified genetic signature. We found that 23% of all patients exhibit a genetic signature consistent with a high ACC tumor response rate to Entinostat and Cisplatin. Our study provides compelling preclinical data supporting the deployment of a powerful systemic anticancer therapy crafted and explicitly tested for ACC tumors.

Keywords: Precision medicine; acetylation; histone; senescence; tumor genome landscape.


Conflict of interest statement

None.

Figures
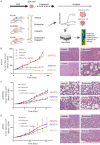
Figure 1
Figure 1
Therapeutic efficacy of Entinostat/Cisplatin in ACC PDX models. (A) Graphical representation of study design. Briefly, patient-derived ACC tumors (ACCX6, ACCX5M1, ACCX9) were transplanted subcutaneously into the dorsal region of severe combined immunodeficient mice (SCID mice). After reaching 200 mm3, each ACC patient-derived xenograft (PDX) was treated with vehicle (control) and the 3 therapeutic arms (i.e., Cisplatin alone, Entinostat alone, or Entinostat/Cisplatin combination therapy). Tumor growth was monitored and measured every 3 days. Tumor growth inhibition (TGI) was calculated by comparing the tumor volume of each therapeutic arm with the vehicle group. Tumor samples were processed for histology and assessment of gene and protein expressions. (B-D) Graphs depict the volume of PDX tumors generated with human ACCX6 (B), ACCX5M1 (C), and ACCX9 (D) treated with each of the 3 therapeutic arms and vehicle (control). TGI is shown next to the therapeutic arm line. Note that the combination therapy displayed the most effective TGI. Data represent mean values (± SEM) of 8 PDX and experimental conditions. Morphological changes of ACC tumors upon each therapeutic arm are depicted H&E. Note changes in the tumor morphology upon administration of Entinostat/Cisplatin for ACCX9.
Figure 3
Figure 3
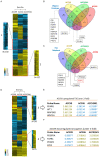
Tree view analysis of ACC tumors receiving combination therapy. A. Gene clustering of ACCX9, ACCX5M1, and ACCX6 receiving Entinostat combined with Cisplatin according to gene expression (baseline) from the vehicle group. The blue color denotes genes downregulated in all ACC tumors (cluster 1), and the yellow color denotes genes upregulated in all ACC tumors following. B. Genes found downregulated (2-fold) in cluster 1. Note that all depicted genes are classified as oncogenes. C. List of genes upregulated in all ACC tumors (cluster 2). Note that depicted genes denote tumor suppressor genes. D. Clusters 3 and 4 represent genes found upregulated (n = 145) and downregulated (n = 79), respectively, in the ACCX9 PDX model characterized by a tumor growth inhibition of 106% upon administration of Entinostat/Cisplatin. E. Table derived from cluster 3 depicts tumor suppressor genes (TSG) presenting 2-fold upregulation on ACCX9 compared with ACCX6 and ACCX5M1 tumors upon administration of Entinostat/Cisplatin. F. Table derived from cluster 4 depicts oncogenes presenting a 2-fold downregulation on ACCX9 compared with ACCX6 and ACCX5M1 tumors upon administration of Entinostat/Cisplatin.
Figure 2
Figure 2
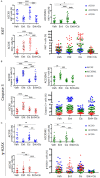
The effect of the therapeutic arms on tumor proliferation, apoptosis, and DNA repair. (A) Cellular proliferation was assessed using Ki67 staining, (B) while the levels of cellular apoptosis from all PDX models were assessed using Caspase 3, and (C) content of DNA damage was assessed using γ-H2AX markers. Quantification of each marker is depicted as positive cells per field for each tumor, or as a combination of all tumors (*P<0.05; **P<0.01; ***P<0.001; ****P<0.0001).
Figure 4
Figure 4
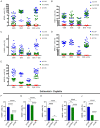
Pharmacological effect of combination therapy on global tumor histone acetylation. Quantification of immunofluorescence staining for histone H3 and H4 at multiple acetylation sites, including histone H3 Lysine 9 (A), histone H4 lysine 5 (B), histone H4 lysine 8 (C), histone H4 lysine 12 (D), histone H4 lysine 16 (E) in tumor samples receiving Entinostat, Cisplatin, and the combination therapy of Entinostat/Cisplatin. (F-J) Comparison between all 3 PDX tumor model responses to Entinostat/Cisplatin. Note the reduced effect of combination therapy over ACCX6 when compared with high acetylation levels observed in ACCX6 and, to some extent, ACCX5M1 (*P<0.05; **P<0.01; ***P<0.001; ****P<0.0001).
Figure 5
Figure 5
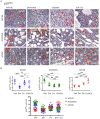
Activation of Cellular Senescence in ACC PDX tumors. A. Immunohistochemical staining of PDX tumors for cellular senescence using p16ink4. Red arrows indicate positive cells for staining. B. Quantification of immunohistochemical staining of PDX tumors for the cellular senescence marker p16ink4. Quantification depicts the percentage of positive cells per field of each PDX model or as a combination of all tumors upon administration of Cisplatin, Entinostat, Entinostat/Cisplatin, or vehicle as control (*P<0.05; **P<0.01; ***P<0.001; ****P<0.0001).
Figure 6
Figure 6
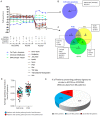
Identifying signaling pathways as genetic signatures for treatment success and validation of findings using a cohort of ACC patients RNAseq database. Nanostring PanCancer Pathway Panel was used to evaluate global genetic modifications advent from all treatment arms. A. Pathway scores from 13 pathways represented in the Nanostring PanCancer Pathway Panel were calculated using the Advanced Analysis 2.0 plugin (NanoString, USA) in a Windows operating system and R environment (The R Foundation) for each PDX tumor and treatment. Note that ACCX9 tumors present a different overall activation status of the 13 pathways represented in the Nanostring PanCancer Pathway Panel compared with ACCX5M1 and ACCX6 tumors. B. Diagram depicts two genes of interest from the Cell Cycle-Apoptosis signaling pathway from the Nanostring panel showing high expression rates on ACCX9 PDX model. C. Venn diagram depicts 3 genes commonly downregulated in the ACCX9 PDX model. D. Data from RNAseq set from 68 samples from 30 female and 38 male patients were extracted and compared with the Nanostring gene set that composes the two most discriminative pathways found in the PDX data (‘Cell Cycle + Apoptosis’ and ‘PI3K’). Patient stratification was established using ACCX9 and ACCX5M1 expression benchmarks. E. Pie chart containing RNAseq data shows 23% of all 68 ACC patients with similar signaling pathway signature of ACCX9 and 15% with similar signature of ACCX5M1 PDX model.

References

    1. Xu B, Drill E, Ho A, Ho A, Dunn L, Prieto-Granada CN, Chan T, Ganly I, Ghossein R, Katabi N. Predictors of outcome in adenoid cystic carcinoma of salivary glands: a clinicopathologic study with correlation between MYB fusion and protein expression. Am J Surg Pathol. 2017;41:1422–1432. - PMC - PubMed
    1. Ouyang DQ, Liang LZ, Zheng GS, Ke ZF, Weng DS, Yang WF, Su YX, Liao GQ. Risk factors and prognosis for salivary gland adenoid cystic carcinoma in Southern China: a 25-year retrospective study. Medicine (Baltimore) 2017;96:e5964. - PMC - PubMed
    1. Papaspyrou G, Hoch S, Rinaldo A, Rodrigo JP, Takes RP, van Herpen C, Werner JA, Ferlito A. Chemotherapy and targeted therapy in adenoid cystic carcinoma of the head and neck: a review. Head Neck. 2011;33:905–911. - PubMed
    1. Ho AS, Ochoa A, Jayakumaran G, Zehir A, Valero Mayor C, Tepe J, Makarov V, Dalin MG, He J, Bailey M, Montesion M, Ross JS, Miller VA, Chan L, Ganly I, Dogan S, Katabi N, Tsipouras P, Ha P, Agrawal N, Solit DB, Futreal PA, El Naggar AK, Reis-Filho JS, Weigelt B, Ho AL, Schultz N, Chan TA, Morris LG. Genetic hallmarks of recurrent/metastatic adenoid cystic carcinoma. J Clin Invest. 2019;129:4276–4289. - PMC - PubMed
    1. Persson M, Andren Y, Mark J, Horlings HM, Persson F, Stenman G. Recurrent fusion of MYB and NFIB transcription factor genes in carcinomas of the breast and head and neck. Proc Natl Acad Sci U S A. 2009;106:18740–18744. - PMC - PubMed

LinkOut - more resources