. 2023 Jan 26:17:1000079.
doi: 10.3389/fnins.2023.1000079. eCollection 2023.

Inferring the basis of binaural detection with a modified autoencoder

Affiliations

Inferring the basis of binaural detection with a modified autoencoder

Samuel S Smith et al. Front Neurosci. .

Abstract

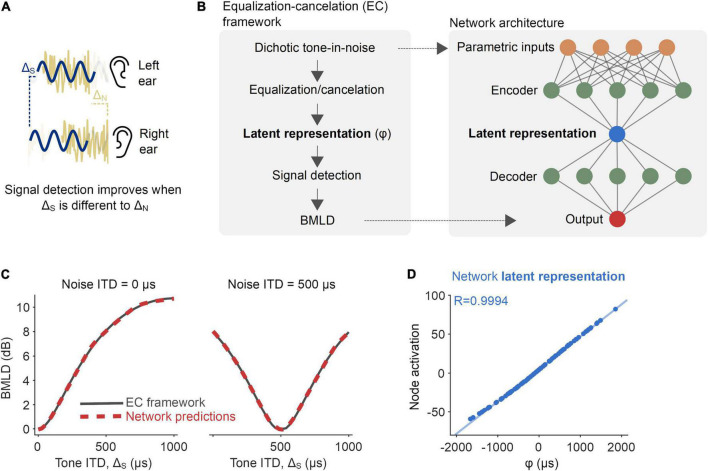
The binaural system utilizes interaural timing cues to improve the detection of auditory signals presented in noise. In humans, the binaural mechanisms underlying this phenomenon cannot be directly measured and hence remain contentious. As an alternative, we trained modified autoencoder networks to mimic human-like behavior in a binaural detection task. The autoencoder architecture emphasizes interpretability and, hence, we "opened it up" to see if it could infer latent mechanisms underlying binaural detection. We found that the optimal networks automatically developed artificial neurons with sensitivity to timing cues and with dynamics consistent with a cross-correlation mechanism. These computations were similar to neural dynamics reported in animal models. That these computations emerged to account for human hearing attests to their generality as a solution for binaural signal detection. This study examines the utility of explanatory-driven neural network models and how they may be used to infer mechanisms of audition.

Keywords: binaural (two-ear) hearing effect; cross-correlation (CC); hearing; representational learning; signal detection algorithm.


Conflict of interest statement

The authors declare that the research was conducted in the absence of any commercial or financial relationships that could be construed as a potential conflict of interest.

Figures

FIGURE 1
FIGURE 1
Proof-of-principle: Inferring a latent binaural variable. (A) The detection of a signal (sine wave denoted in navy blue) is improved if its interaural disparity is different from that of the noise (noise waveform denoted in yellow). (B) A neural network was trained to predict binaural masking level differences (BMLDs), as described by the equalization-cancelation (EC) framework (left). The network had a modified autoencoder architecture, in which the central layer acted as an information bottleneck. (C) BMLDs were numerically calculated by the EC framework (black) and estimated by the trained neural network (red-dashed), for a 500 Hz pure tone signal and noise at varying interaural time differences (ITDs). (D) A node central within the network had activation values entirely consistent with the latent variable as formally defined by the EC framework (φ, the signal’s post-EC ITD).
FIGURE 2
FIGURE 2
Network training and configuration. (A) Data from a simulated frontal field binaural detection task were used to train neural networks to detect a 500 Hz pure tone (sine wave denoted in navy blue) in broadband noise (yellow noise waveform). Locations of the tone and noise were chosen at random on each trial and were equally likely to come from each azimuthal location. (B) The modified autoencoder network received left/right “ear” waveforms as inputs, and had five hidden layers, with the central layer containing 10 nodes–constrained by the parameter β in their information transmission. (C) Error for 60 networks (10 for each value of β, see Section “Materials and methods”) tested on a held-out validation dataset. The red circles indicate the errors for the 60 networks. The red cross marks the optimally performing network, and the red line bounds the networks with minimum error for each value of β.
FIGURE 3
FIGURE 3
Modified autoencoder accounted for binaural detection psychophysics. (A) Psychometric functions quantifying tone detection as a function of tone level masked by a 60 dB SPL Gaussian noise (left, black). These functions are drawn for tones presented from three azimuths, relative to a noise presented directly in front. The optimal neural network model was able to approximate these psychometric functions (red, right), from which detection thresholds (corresponding to a d-prime of 1) and binaural masking level differences (BMLDs) could be calculated. (B) Psychophysical estimates (left, black) of human BMLDs for a 500 Hz tone presented in noise, each with interaural time differences (ITDs) mapped from differing azimuths. Alongside are the optimal network’s predictions (right, red). Markers representing thresholds as defined in panel (A) are overlaid. (C) (Left panel) A schematic of the laboratory stimuli configurations denoted as NoSo, NoSπ, NπSπ, and NπSo. (Right panel) BMLDs were derived for experimental stimulus configurations: NoSo/NoSπ, NπSπ/NπSo (π, for a 500 Hz signal, is beyond the range of ITDs used during training).
FIGURE 4
FIGURE 4
Latent representations imitated signature of population-level cortical activity. (A) Change in population masked rate-level functions recorded from guinea pig auditory cortex (Gilbert et al., 2015) in response to changes in experimental binaural stimuli NoSo/NoSπ (dark blue) and NπSπ/NπSo (light blue). (B) Kullback–Leibler (KL) divergence (Kullback and Leibler, 1951) between each individual node and a unit Gaussian. Unlabeled nodes along the x-axis were deemed to be suppressed during training. (C) Rate-level functions for the operational central nodes in the optimal network, comparable to panel (A).
FIGURE 5
FIGURE 5
Encoder network dynamics matched those of a cross-correlator. (A) Interaural time difference (ITD) tuning emerged as a property of nodes within the early encoder layer of the network. The activation values of an example node are shown to vary as a function of noise ITD (dark green). Tuning was characterized by Gabor functions (black, dashed) with peaks defined as a node’s best ITD (black circle). The gray box underlays represent the ITD-limit for our training simulation. (B) The proportion of variance explained (R2) by Gabor fits, although high in Layer 1 (light green) of the encoder, was widespread by Layer 2 (darker green). (C) Best ITD distribution for nodes in Layer 2, characterized by a kernel density estimate (bandwidth of 200 μs). Again, the gray box underlay represents the ITD-limit for our training simulation. (D) Activation values of Layer 2 nodes for binaural detection stimuli: NoSo, NoSπ, NπSπ, NπSo (color-coded). Smoothed with a 600 μs moving average window. (E) The profiles in 5D were similar to a simple cross-correlation (X-corr) algorithm. (F) The better a network predicted psychophysical data (x-axis), the more similar its encoder network to a cross-correlator (y-axis).

References

    1. Adavanne S., Politis A., Nikunen J., Virtanen T. (2018). Sound event localization and detection of overlapping sources using convolutional recurrent neural networks. IEEE J. Sel. Top. Signal Process 13 34–48. 10.1109/JSTSP.2018.2885636 - DOI
    1. Akeroyd M. (2017). A binaural cross-correlogram toolbox for MATLAB. Farmington, CT: University of Connecticut Health Center.
    1. Asadollahi A., Endler F., Nelken I., Wagner H. (2010). Neural correlates of binaural masking level difference in the inferior colliculus of the barn owl (Tyto alba). Eur. J. Neurosci. 32 606–618. 10.1111/j.1460-9568.2010.07313.x - DOI - PubMed
    1. Bernstein L. R., Trahiotis C. (2017). An interaural-correlation-based approach that accounts for a wide variety of binaural detection data. J. Acoust. Soc. Am. 141 1150–1160. 10.1121/1.4976098 - DOI - PubMed
    1. Bernstein L. R., Trahiotis C. (2020). Binaural detection as a joint function of masker bandwidth, masker interaural correlation, and interaural time delay: Empirical data and modeling. J. Acoust. Soc. Am. 148 3481–3488. 10.1121/10.0002869 - DOI - PubMed