

A new FRDA mouse model [ Fxn null:YG8s(GAA) > 800] with more than 800 GAA repeats
- PMID: 36777637
- PMCID: PMC9909538
- DOI: 10.3389/fnins.2023.930422
A new FRDA mouse model [ Fxn null:YG8s(GAA) > 800] with more than 800 GAA repeats
Abstract
Introduction: Friedreich's ataxia (FRDA) is an inherited recessive neurodegenerative disorder caused by a homozygous guanine-adenine-adenine (GAA) repeat expansion within intron 1 of the FXN gene, which encodes the essential mitochondrial protein frataxin. There is still no effective therapy for FRDA, therefore the development of optimal cell and animal models of the disease is one of the priorities for preclinical therapeutic testing.
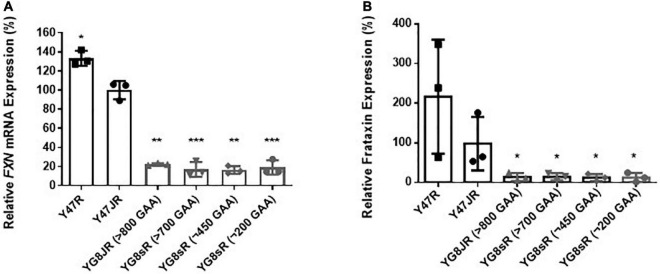
Methods: We obtained the latest FRDA humanized mouse model that was generated on the basis of our previous YG8sR, by Jackson laboratory [YG8JR, Fxn null:YG8s(GAA) > 800]. We characterized the behavioral, cellular, molecular and epigenetics properties of the YG8JR model, which has the largest GAA repeat sizes compared to all the current FRDA mouse models.
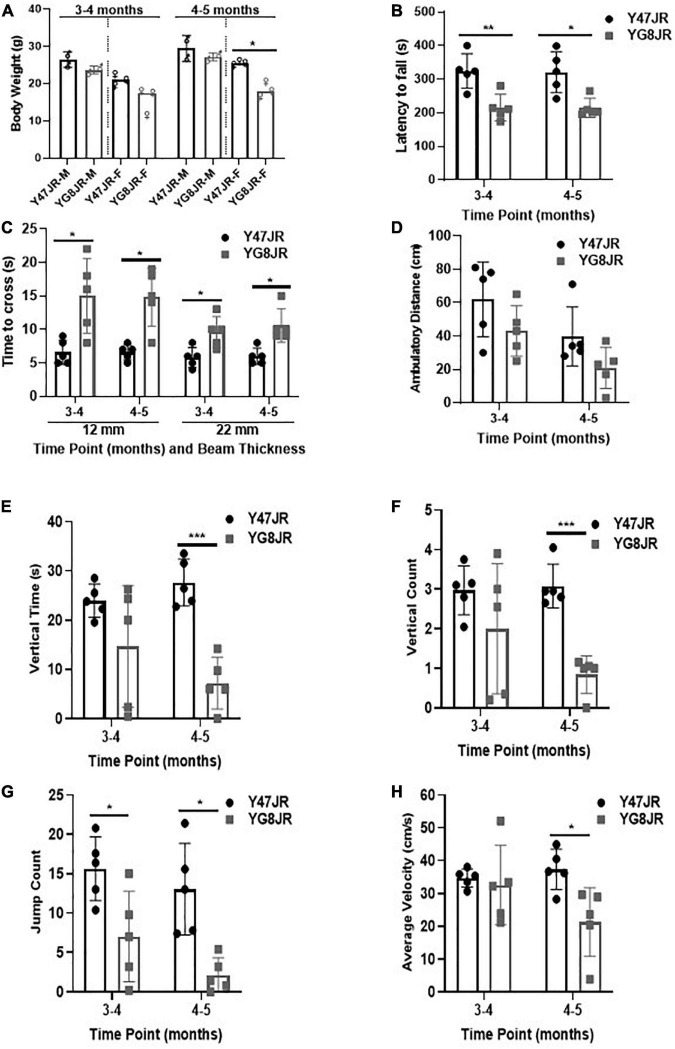
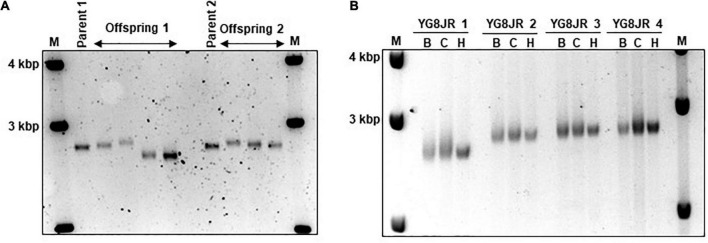
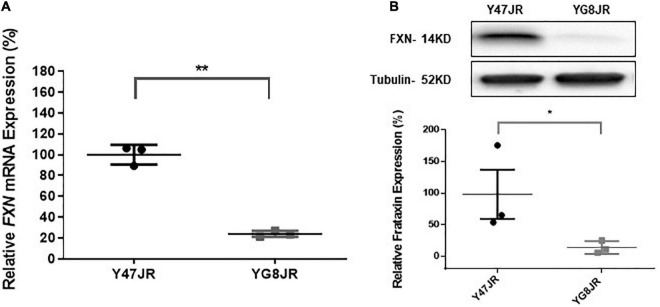
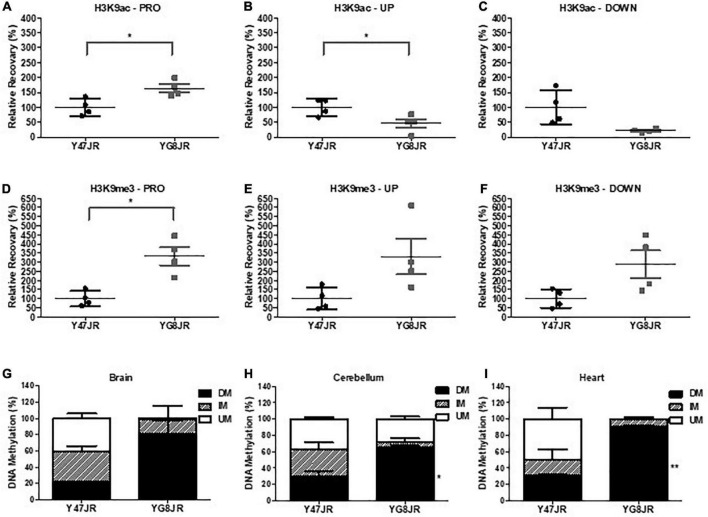
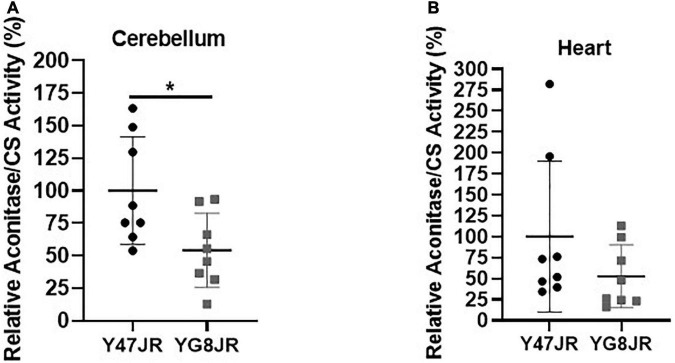
Results: We found statistically significant behavioral deficits, together with reduced levels of frataxin mRNA and protein, and aconitase activity in YG8JR mice compared with control Y47JR mice. YG8JR mice exhibit intergenerational GAA repeat instability by the analysis of parent and offspring tissue samples. Somatic GAA repeat instability was also detected in individual brain and cerebellum tissue samples. In addition, increased DNA methylation of CpG U13 was identified in FXN GAA repeat region in the brain, cerebellum, and heart tissues. Furthermore, we show decreased histone H3K9 acetylation and increased H3K9 methylation of YG8JR cerebellum tissues within the FXN gene, upstream and downstream of the GAA repeat region compared to Y47JR controls.
Discussion: These studies provide a detailed characterization of the GAA repeat expansion-based YG8JR transgenic mouse models that will help investigations of FRDA disease mechanisms and therapy.
Keywords: FRDA; FXN; Friedreich’s ataxia; GAA repeat; Y47JR; YG8JR; frataxin; mouse model.
Copyright © 2023 Kalef-Ezra, Edzeamey, Valle, Khonsari, Kleine, Oggianu, Al-Mahdawi, Pook and Anjomani Virmouni.
Conflict of interest statement
The authors declare that the research was conducted in the absence of any commercial or financial relationships that could be construed as a potential conflict of interest.
Figures
Similar articles
-
A novel GAA-repeat-expansion-based mouse model of Friedreich's ataxia.Dis Model Mech. 2015 Mar;8(3):225-35. doi: 10.1242/dmm.018952. Epub 2015 Feb 13. Dis Model Mech. 2015. PMID: 25681319 Free PMC article.
-
The Friedreich ataxia GAA repeat expansion mutation induces comparable epigenetic changes in human and transgenic mouse brain and heart tissues.Hum Mol Genet. 2008 Mar 1;17(5):735-46. doi: 10.1093/hmg/ddm346. Epub 2007 Nov 27. Hum Mol Genet. 2008. PMID: 18045775
-
DNA Base Damage Repair Crosstalks with Chromatin Structures to Contract Expanded GAA Repeats in Friedreich's Ataxia.Biomolecules. 2024 Jul 8;14(7):809. doi: 10.3390/biom14070809. Biomolecules. 2024. PMID: 39062522 Free PMC article.
-
Increasing frataxin gene expression with histone deacetylase inhibitors as a therapeutic approach for Friedreich's ataxia.J Neurochem. 2013 Aug;126 Suppl 1(0 1):147-54. doi: 10.1111/jnc.12302. J Neurochem. 2013. PMID: 23859350 Free PMC article. Review.
-
Replication dependent and independent mechanisms of GAA repeat instability.DNA Repair (Amst). 2022 Oct;118:103385. doi: 10.1016/j.dnarep.2022.103385. Epub 2022 Aug 3. DNA Repair (Amst). 2022. PMID: 35952488 Free PMC article. Review.
Cited by
-
Simple sequence repeats and their expansions: role in plant development, environmental response and adaptation.New Phytol. 2025 Jul;247(2):504-517. doi: 10.1111/nph.70173. Epub 2025 May 5. New Phytol. 2025. PMID: 40325839 Free PMC article. Review.
-
Friedreich Ataxia: An (Almost) 30-Year History After Gene Discovery.Neurol Genet. 2025 Jan 13;11(1):e200236. doi: 10.1212/NXG.0000000000200236. eCollection 2025 Feb. Neurol Genet. 2025. PMID: 39810753 Free PMC article.
-
Mitochondrial impairment, decreased sirtuin activity and protein acetylation in dorsal root ganglia in Friedreich Ataxia models.Cell Mol Life Sci. 2023 Dec 21;81(1):12. doi: 10.1007/s00018-023-05064-4. Cell Mol Life Sci. 2023. PMID: 38129330 Free PMC article.
-
Humanized Mice as a Model to Assess the Response of Human Hematopoietic Stem Cells to Irradiation.Bull Exp Biol Med. 2023 Nov;176(1):34-37. doi: 10.1007/s10517-023-05962-4. Epub 2023 Dec 13. Bull Exp Biol Med. 2023. PMID: 38091132
-
Somatic and intergenerational G4C2 hexanucleotide repeat instability in a human C9orf72 knock-in mouse model.Nucleic Acids Res. 2024 Jun 10;52(10):5732-5755. doi: 10.1093/nar/gkae250. Nucleic Acids Res. 2024. PMID: 38597682 Free PMC article.
References
-
- Al-Mahdawi S., Pinto R. M., Varshney D., Lawrence L., Lowrie M. B., Hughes S., et al. (2006). GAA repeat expansion mutation mouse models of Friedreich ataxia exhibit oxidative stress leading to progressive neuronal and cardiac pathology. Genomics 88 580–590. 10.1016/j.ygeno.2006.06.015 - DOI - PMC - PubMed
LinkOut - more resources
Full Text Sources
Molecular Biology Databases
Miscellaneous