Novel diagnostic biomarkers related to immune infiltration in Parkinson's disease by bioinformatics analysis
- PMID: 36777638
- PMCID: PMC9909419
- DOI: 10.3389/fnins.2023.1083928
Novel diagnostic biomarkers related to immune infiltration in Parkinson's disease by bioinformatics analysis
Abstract
Background: Parkinson's disease (PD) is Pengfei Zhang Liwen Zhao Pengfei Zhang Liwen Zhao a common neurological disorder involving a complex relationship with immune infiltration. Therefore, we aimed to explore PD immune infiltration patterns and identify novel immune-related diagnostic biomarkers.
Materials and methods: Three substantia nigra expression microarray datasets were integrated with elimination of batch effects. Differentially expressed genes (DEGs) were screened using the "limma" package, and functional enrichment was analyzed. Weighted gene co-expression network analysis (WGCNA) was performed to explore the key module most significantly associated with PD; the intersection of DEGs and the key module in WGCNA were considered common genes (CGs). The CG protein-protein interaction (PPI) network was constructed to identify candidate hub genes by cytoscape. Candidate hub genes were verified by another two datasets. Receiver operating characteristic curve analysis was used to evaluate the hub gene diagnostic ability, with further gene set enrichment analysis (GSEA). The immune infiltration level was evaluated by ssGSEA and CIBERSORT methods. Spearman correlation analysis was used to evaluate the hub genes association with immune cells. Finally, a nomogram model and microRNA-TF-mRNA network were constructed based on immune-related biomarkers.
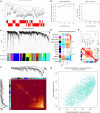
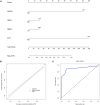
Results: A total of 263 CGs were identified by the intersection of 319 DEGs and 1539 genes in the key turquoise module. Eleven candidate hub genes were screened by the R package "UpSet." We verified the candidate hub genes based on two validation sets and identified six (SYT1, NEFM, NEFL, SNAP25, GAP43, and GRIA1) that distinguish the PD group from healthy controls. Both CIBERSORT and ssGSEA revealed a significantly increased proportion of neutrophils in the PD group. Correlation between immune cells and hub genes showed SYT1, NEFM, GAP43, and GRIA1 to be significantly related to immune cells. Moreover, the microRNA-TFs-mRNA network revealed that the microRNA-92a family targets all four immune-related genes in PD pathogenesis. Finally, a nomogram exhibited a reliable capability of predicting PD based on the four immune-related genes (AUC = 0.905).
Conclusion: By affecting immune infiltration, SYT1, NEFM, GAP43, and GRIA1, which are regulated by the microRNA-92a family, were identified as diagnostic biomarkers of PD. The correlation of these four genes with neutrophils and the microRNA-92a family in PD needs further investigation.
Keywords: Parkinson’s disease; bioinformatics analysis; gene set enrichment analysis; hub genes; immune infiltration; weighted gene co-expression network analysis (WGCNA).
Copyright © 2023 Zhang, Zhao, Li, Shen, Li and Xing.
Conflict of interest statement
The authors declare that the research was conducted in the absence of any commercial or financial relationships that could be construed as a potential conflict of interest.
Figures


Similar articles
-
Screening and identification of potential hub genes and immune cell infiltration in the synovial tissue of rheumatoid arthritis by bioinformatic approach.Heliyon. 2023 Jan 10;9(1):e12799. doi: 10.1016/j.heliyon.2023.e12799. eCollection 2023 Jan. Heliyon. 2023. PMID: 36699262 Free PMC article.
-
Identifying the hub gene and immune infiltration of Parkinson's disease using bioinformatical methods.Brain Res. 2022 Jun 15;1785:147879. doi: 10.1016/j.brainres.2022.147879. Epub 2022 Mar 10. Brain Res. 2022. PMID: 35278479
-
Integrative analysis of potential biomarkers and immune cell infiltration in Parkinson's disease.Brain Res Bull. 2021 Dec;177:53-63. doi: 10.1016/j.brainresbull.2021.09.010. Epub 2021 Sep 16. Brain Res Bull. 2021. PMID: 34536521
-
Identification of potential immune-related hub genes in Parkinson's disease based on machine learning and development and validation of a diagnostic classification model.PLoS One. 2023 Dec 5;18(12):e0294984. doi: 10.1371/journal.pone.0294984. eCollection 2023. PLoS One. 2023. PMID: 38051734 Free PMC article.
-
Identification and validation of oxidative stress and immune-related hub genes in Alzheimer's disease through bioinformatics analysis.Sci Rep. 2023 Jan 12;13(1):657. doi: 10.1038/s41598-023-27977-7. Sci Rep. 2023. PMID: 36635346 Free PMC article.
Cited by
-
Integrated bioinformatics analysis for exploring potential biomarkers related to Parkinson's disease progression.BMC Med Genomics. 2024 May 17;17(1):133. doi: 10.1186/s12920-024-01885-9. BMC Med Genomics. 2024. PMID: 38760670 Free PMC article.
-
Exposure to Metals, Pesticides, and Air Pollutants: Focus on Resulting DNA Methylation Changes in Neurodegenerative Diseases.Biomolecules. 2024 Oct 27;14(11):1366. doi: 10.3390/biom14111366. Biomolecules. 2024. PMID: 39595543 Free PMC article. Review.
-
Identifying the NEAT1/miR-26b-5p/S100A2 axis as a regulator in Parkinson's disease based on the ferroptosis-related genes.PLoS One. 2024 Dec 31;19(12):e0316179. doi: 10.1371/journal.pone.0316179. eCollection 2024. PLoS One. 2024. PMID: 39739972 Free PMC article.
-
Differential gene expression and immune profiling in Parkinson's disease: unveiling potential candidate biomarkers.BMC Neurol. 2025 Aug 27;25(1):354. doi: 10.1186/s12883-025-04388-x. BMC Neurol. 2025. PMID: 40859216 Free PMC article.
-
A Pilot Study to Investigate Peripheral Low-Level Chronic LPS Injection as a Model of Neutrophil Activation in the Periphery and Brain in Mice.Int J Mol Sci. 2024 May 14;25(10):5357. doi: 10.3390/ijms25105357. Int J Mol Sci. 2024. PMID: 38791393 Free PMC article.
References
-
- Adler D., Kelly S. (2020). Vioplot: Violin plot. R package version 0.3, Vol. 7.
-
- Agnello D., Lankford C. S., Bream J., Morinobu A., Gadina M., O’shea J. J., et al. (2003). Cytokines and transcription factors that regulate T helper cell differentiation: New players and new insights. J. Clin. Immunol. 23 147–161. - PubMed
LinkOut - more resources
Full Text Sources
Miscellaneous

