

Genome-wide analysis of dysregulated RNA-binding proteins and alternative splicing genes in keloid
- PMID: 36777722
- PMCID: PMC9908963
- DOI: 10.3389/fgene.2023.1118999
Genome-wide analysis of dysregulated RNA-binding proteins and alternative splicing genes in keloid
Abstract
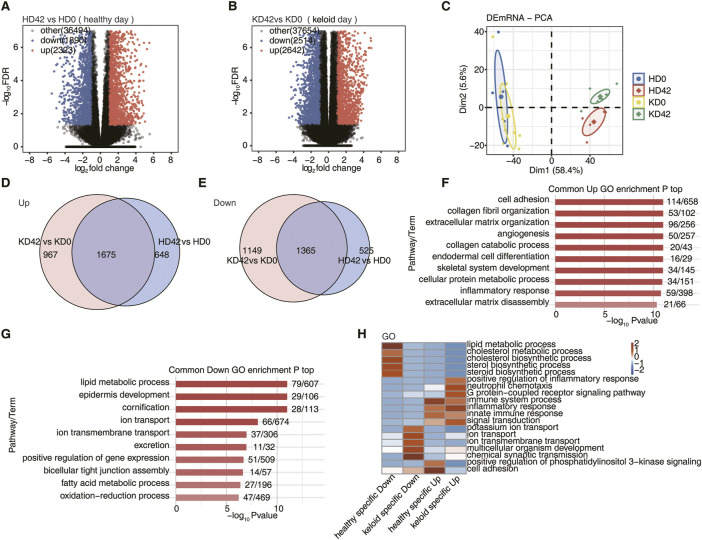
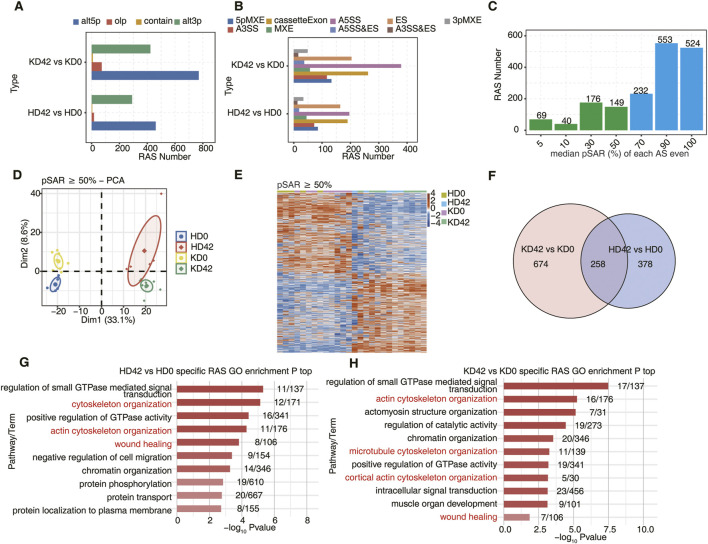
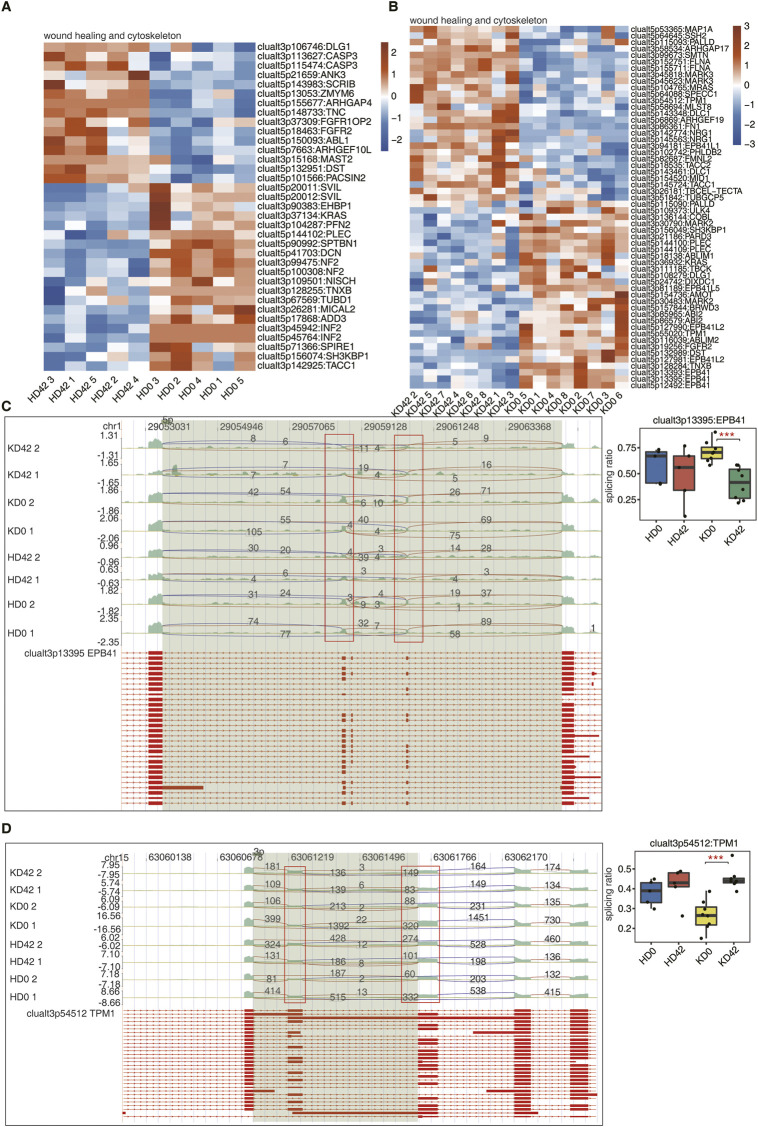
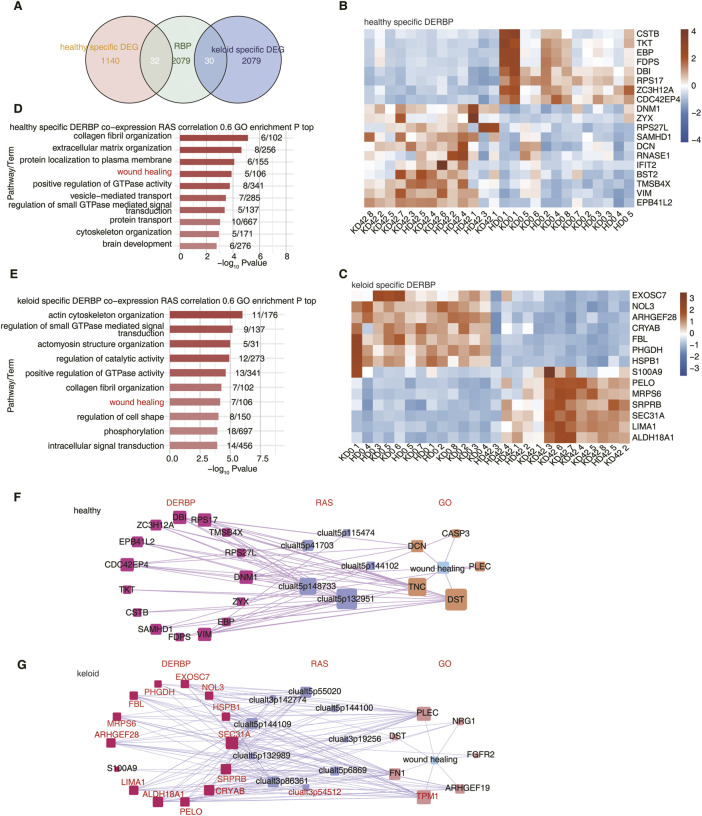
Introduction: The pathogenesis of keloids remains unclear. Methods: In this study, we analyzed RNA-Seq data (GSE113619) of the local skin tissue of 8 keloid-prone individuals (KPI) and 6 healthy controls (HC) before and 42 days after trauma from the gene expression omnibus (GEO) database. The differential alternative splicing (AS) events associated with trauma healing between KPIs and HCs were identifified, and their functional differences were analyzed by gene ontology (GO) and kyoto encyclopedia of genes and genomes (KEGG) pathways. The co-expression relationship of differentially alternative splicing genes and differentially expressed RNA binding proteins (RBPs) was established subsequently. Results: A total of 674 differential AS events between the KD42 and the KD0 and 378 differential AS events between the HD42 and the HD0 were discovered. Notably, most of the differential genes related to keloids are enriched in actin, microtubule cells, and cortical actin cytoskeletal tissue pathway. We observed a signifificant association between AS genes (EPB41, TPM1, NF2, PARD3) and trauma healing in KPIs and HCs. We also found that the differential expression of healthy controls-specifific trauma healing-related RBPs (TKT, FDPS, SAMHD1) may affect the response of HCs to trauma healing by regulating the AS of downstream trauma healing-related genes such as DCN and DST. In contrast, KPIs also has specifific differential expression of trauma healing related RBPs (S100A9, HspB1, LIMA1, FBL), which may affect the healing response of KPIs to trauma by regulating the AS of downstream trauma healing-related genes such as FN1 and TPM1. Discussion: Our results were innovative in revealing early wound healing-related genes (EPB41, TPM1, NF2, PARD3) in KPI from the perspective of AS regulated by RBPs.
Keywords: RNA-bindig proteins; RNA-sequencing (RNA-seq); alternative splicing; keloid; trauma healing.
Copyright © 2023 Zhu, Ni, Zhang, Yuan, Bai, Yin and Zhu.
Conflict of interest statement
The authors declare that the research was conducted in the absence of any commercial or financial relationships that could be construed as a potential conflict of interest.
Figures
Similar articles
-
Genome-wide analysis of RNA-binding proteins co-expression with alternative splicing events in mitral valve prolapse.Front Immunol. 2023 Apr 26;14:1078266. doi: 10.3389/fimmu.2023.1078266. eCollection 2023. Front Immunol. 2023. PMID: 37180137 Free PMC article.
-
RNA-binding proteins potentially regulate alternative splicing of immune/inflammatory-associated genes during the progression of generalized pustular psoriasis.Arch Dermatol Res. 2024 Aug 19;316(8):538. doi: 10.1007/s00403-024-03283-8. Arch Dermatol Res. 2024. PMID: 39158708
-
Regulation of Alternative Splicing of Lipid Metabolism Genes in Sepsis-Induced Liver Damage by RNA-Binding Proteins.Inflammation. 2024 Dec;47(6):1952-1968. doi: 10.1007/s10753-024-02017-2. Epub 2024 May 9. Inflammation. 2024. PMID: 38727856 Free PMC article.
-
Genome-wide identification of dysregulated alternative splicing and RNA-binding proteins involved in atopic dermatitis.Front Genet. 2024 Mar 1;15:1287111. doi: 10.3389/fgene.2024.1287111. eCollection 2024. Front Genet. 2024. PMID: 38495671 Free PMC article.
-
Transcriptome-wide analysis reveals the coregulation of RNA-binding proteins and alternative splicing genes in the development of atherosclerosis.Sci Rep. 2023 Jan 31;13(1):1764. doi: 10.1038/s41598-022-26556-6. Sci Rep. 2023. PMID: 36720950 Free PMC article.
Cited by
-
Transcriptomic Analysis of the Developing Testis and Spermatogenesis in Qianbei Ma Goats.Genes (Basel). 2023 Jun 25;14(7):1334. doi: 10.3390/genes14071334. Genes (Basel). 2023. PMID: 37510239 Free PMC article.
-
Comprehensive analysis of skin growth-related hub genes and microenvironment characterization in a mouse expanded skin model.Front Immunol. 2024 Dec 5;15:1306353. doi: 10.3389/fimmu.2024.1306353. eCollection 2024. Front Immunol. 2024. PMID: 39703504 Free PMC article.
References
LinkOut - more resources
Full Text Sources
Research Materials
Miscellaneous