

Comparison of methods for donor-derived cell-free DNA quantification in plasma and urine from solid organ transplant recipients
- PMID: 36777723
- PMCID: PMC9916053
- DOI: 10.3389/fgene.2023.1089830
Comparison of methods for donor-derived cell-free DNA quantification in plasma and urine from solid organ transplant recipients
Abstract
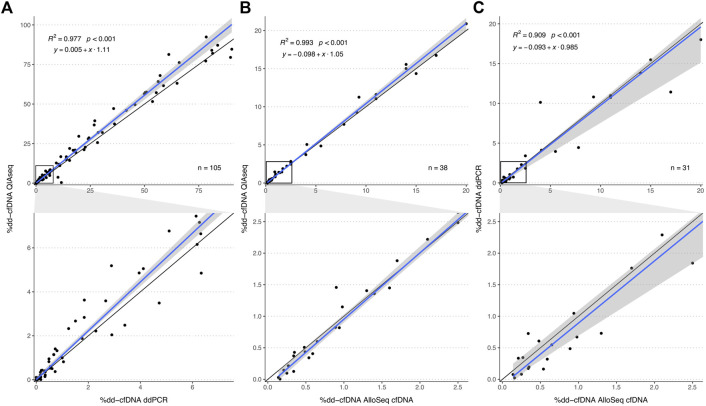
In allograft monitoring of solid organ transplant recipients, liquid biopsy has emerged as a novel approach using quantification of donor-derived cell-free DNA (dd-cfDNA) in plasma. Despite early clinical implementation and analytical validation of techniques, direct comparisons of dd-cfDNA quantification methods are lacking. Furthermore, data on dd-cfDNA in urine is scarce and high-throughput sequencing-based methods so far have not leveraged unique molecular identifiers (UMIs) for absolute dd-cfDNA quantification. Different dd-cfDNA quantification approaches were compared in urine and plasma of kidney and liver recipients: A) Droplet digital PCR (ddPCR) using allele-specific detection of seven common HLA-DRB1 alleles and the Y chromosome; B) high-throughput sequencing (HTS) using a custom QIAseq DNA panel targeting 121 common polymorphisms; and C) a commercial dd-cfDNA quantification method (AlloSeq® cfDNA, CareDx). Dd-cfDNA was quantified as %dd-cfDNA, and for ddPCR and HTS using UMIs additionally as donor copies. In addition, relative and absolute dd-cfDNA levels in urine and plasma were compared in clinically stable recipients. The HTS method presented here showed a strong correlation of the %dd-cfDNA with ddPCR (R 2 = 0.98) and AlloSeq® cfDNA (R 2 = 0.99) displaying only minimal to no proportional bias. Absolute dd-cfDNA copies also correlated strongly (τ = 0.78) between HTS with UMI and ddPCR albeit with substantial proportional bias (slope: 0.25; 95%-CI: 0.19-0.26). Among 30 stable kidney transplant recipients, the median %dd-cfDNA in urine was 39.5% (interquartile range, IQR: 21.8-58.5%) with 36.6 copies/μmol urinary creatinine (IQR: 18.4-109) and 0.19% (IQR: 0.01-0.43%) with 5.0 copies/ml (IQR: 1.8-12.9) in plasma without any correlation between body fluids. The median %dd-cfDNA in plasma from eight stable liver recipients was 2.2% (IQR: 0.72-4.1%) with 120 copies/ml (IQR: 85.0-138) while the median dd-cfDNA copies/ml was below 0.1 in urine. This first head-to-head comparison of methods for absolute and relative quantification of dd-cfDNA in urine and plasma supports a method-independent %dd-cfDNA cutoff and indicates the suitability of the presented HTS method for absolute dd-cfDNA quantification using UMIs. To evaluate the utility of dd-cfDNA in urine for allograft surveillance, absolute levels instead of relative amounts will most likely be required given the extensive variability of %dd-cfDNA in stable kidney recipients.
Keywords: biomarker; cell-free DNA; dd-cfDNA; ddPCR; high-throughput sequencing; kidney transplant; liver transplant; urine.
Copyright © 2023 Kueng, Arcioni, Sandberg, Kuhn, Banz, Largiadèr, Sidler and Amstutz.
Conflict of interest statement
The authors declare that the research was conducted in the absence of any commercial or financial relationships that could be construed as a potential conflict of interest.
Figures


Similar articles
-
Multi-centre analytical performance verification of an IVD assay to quantify donor-derived cell-free DNA in solid organ transplant recipients.HLA. 2024 May;103(5):e15518. doi: 10.1111/tan.15518. HLA. 2024. PMID: 38733247
-
Absolute or Relative Quantification of Donor-derived Cell-free DNA in Kidney Transplant Recipients: Case Series.Transplant Direct. 2021 Oct 22;7(11):e778. doi: 10.1097/TXD.0000000000001237. eCollection 2021 Nov. Transplant Direct. 2021. PMID: 34712778 Free PMC article.
-
Identification of Factors Influencing Donor-Derived Cell-Free DNA Levels up to One Year After Kidney Transplant.J Transplant. 2024 Dec 31;2024:7673476. doi: 10.1155/joot/7673476. eCollection 2024. J Transplant. 2024. PMID: 39781105 Free PMC article.
-
Liquid biopsies: donor-derived cell-free DNA for the detection of kidney allograft injury.Nat Rev Nephrol. 2021 Sep;17(9):591-603. doi: 10.1038/s41581-021-00428-0. Epub 2021 May 24. Nat Rev Nephrol. 2021. PMID: 34031575 Review.
-
Donor-derived cell-free DNA as a diagnostic tool in transplantation.Front Genet. 2022 Oct 21;13:1031894. doi: 10.3389/fgene.2022.1031894. eCollection 2022. Front Genet. 2022. PMID: 36339004 Free PMC article. Review.
Cited by
-
Investigation of Different Library Preparation and Tissue of Origin Deconvolution Methods for Urine and Plasma cfDNA Methylome Analysis.Diagnostics (Basel). 2023 Jul 27;13(15):2505. doi: 10.3390/diagnostics13152505. Diagnostics (Basel). 2023. PMID: 37568867 Free PMC article.
-
Assessment of Donor Derived Cell Free DNA (dd-cfDNA) at Surveillance and at Clinical Suspicion of Acute Rejection in Renal Transplantation.Transpl Int. 2023 Oct 13;36:11507. doi: 10.3389/ti.2023.11507. eCollection 2023. Transpl Int. 2023. PMID: 37901296 Free PMC article.
-
Evaluation of variability in cell-free DNA extraction efficiency from plasma and urine and spike-in normalization.Sci Rep. 2025 Jul 2;15(1):22999. doi: 10.1038/s41598-025-06563-z. Sci Rep. 2025. PMID: 40596083 Free PMC article.
-
Evaluation of a Decentralized Donor-Derived Cell-Free DNA Assay for Kidney Allograft Rejection Monitoring.Transpl Int. 2024 Dec 17;37:13919. doi: 10.3389/ti.2024.13919. eCollection 2024. Transpl Int. 2024. PMID: 39741495 Free PMC article.
-
Free-Circulating Nucleic Acids as Biomarkers in Patients After Solid Organ Transplantation.Ann Transplant. 2023 Aug 15;28:e939750. doi: 10.12659/AOT.939750. Ann Transplant. 2023. PMID: 37580899 Free PMC article. Review.
References
-
- Altuǧ Y., Liang N., Ram R., Ravi H., Ahmed E., Brevnov M., et al. (2019). Analytical validation of a single-nucleotide polymorphism-based donor-derived cell-free DNA assay for detecting rejection in kidney transplant patients. Transplantation 103, 2657–2665. 10.1097/TP.0000000000002665 - DOI - PMC - PubMed
-
- Bunnapradist S., Ahmed E., Maninder M., Demko Z., Billings P., Tabriziani H., et al. (2021). Detection of rejection in kidney transplant patients using an algorithm that combines donor fraction and absolute donor-derived cell-free DNA [abstract]. Am. J. Transpl.
LinkOut - more resources
Full Text Sources
Research Materials