. 2019 Nov 28;2(1):otz048.
doi: 10.1093/crocol/otz048. eCollection 2020 Jan.

Preferences of Adult Patients With Inflammatory Bowel Disease for Attributes of Clinical Trials: Evidence From a Choice-Based Conjoint Analysis

Affiliations

Preferences of Adult Patients With Inflammatory Bowel Disease for Attributes of Clinical Trials: Evidence From a Choice-Based Conjoint Analysis

Dallas Wood et al. Crohns Colitis 360. .

Abstract

Background: Clinical trial recruitment is the rate-limiting step in developing new treatments. To understand inflammatory bowel disease (IBD) patient recruitment, we investigated two questions: Do changes in clinical trial attributes, like monetary compensation, influence recruitment rates, and does this influence differ across subgroups?

Methods: We answered these questions through a conjoint survey of 949 adult IBD patients.

Results: Recruitment rates are influenced by trial attributes: small but significant increases are predicted with lower placebo rates, reduced number of endoscopies, less time commitment, open label extension, and increased involvement of participant's primary GI physician. A much stronger effect was found with increased monetary compensation. Latent class analysis indicated three patient subgroups: some patients quite willing to participate in IBD trials, some quite reluctant, and others who can be persuaded. The persuadable group is quite sensitive to monetary compensation, and payments up to US$2,000 for a 1-year study could significantly increase recruitment rates for IBD clinical trials.

Conclusions: This innovative study provides researchers with a framework for predicting recruitment rates for different IBD clinical trials.

Keywords: Crohn’s disease; clinical trials; conjoint analysis; inflammatory bowel disease; patient recruitment; ulcerative colitis.


Figures

FIG. 1.
FIG. 1.
Example choice task.
FIG. 2.
FIG. 2.
Satisfaction scores from conditional logit model by sample. Note: Figure reflects estimated satisfaction scores as reported in Supplementary Appendix A, Table A1. Upper and lower bars indicate 95% confidence intervals.
FIG. 3.
FIG. 3.
Response of recruitment rates for adult patients to changes in attribute levels on average. Note: Figure reflects estimated recruitment rates as reported in Supplementary Appendix A, Table A2. Upper and lower bars indicate 95% confidence intervals.
FIG. 4.
FIG. 4.
Comparing recruitment rates for adult patients of least preferred trial and most preferred trial. Note: Figure reflects recruitment for least and most preferred trials estimated using conditional logit. Upper and lower bars indicate 95% confidence intervals.
FIG. 5.
FIG. 5.
Satisfaction scores from latent class conditional logit model. Note: Figure reflects estimated satisfaction scores as reported in Supplementary Appendix A, Table A3. Upper and lower bars indicate 95% confidence intervals.
FIG. 6.
FIG. 6.
Response of recruitment rates for adult patients to changes in attribute levels by latent class. Note: Figure reflects estimated recruitment rates as reported in Supplementary Appendix A, Table A4. Upper and lower bars indicate 95% confidence intervals.
FIG. 7.
FIG. 7.
Comparing recruitment rates for adult patients of least preferred trial and most preferred trial. Note: Figure reflects recruitment for least and most preferred trials estimated using latent class conditional logit. Upper and lower bars indicate 95% confidence intervals.
FIG. 8.
FIG. 8.
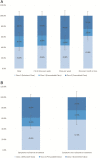
Influence of demographic characteristics on latent class membership. (A) Patient age. (B) Patient household income. Note: Figure reflects the share of respondents who fall into each latent class by self-reported annual household income (assuming all other characteristics hold at sample averages). For example, we estimate that among that respondents who report earning less than US$25,000 per year, 36.3% fall into Class 1, 13.3% fall into Class 2, and 50.4% fall into Class 3. These shares are based on estimates in Supplementary Appendix C, Table C1. Upper and lower bars indicate 95% confidence intervals, which were estimated using the delta method. These patient characteristics were found to have a statistically significant impact on latent class membership, as discussed in Supplementary Appendix C.
FIG. 9.
FIG. 9.
Influence of IBD subtype on latent class membership. Note: Figure reflects the share of respondents who fall into each latent class by IBD subtype (assuming all other characteristics hold at sample averages). For example, we estimate that among respondents diagnosed with Crohn’s disease,45.6% fall into Class 1, 16.0% fall into Class 2, and 38.3% fall into Class 3. These shares are based on estimates in Supplementary Appendix C, Table C1. Upper and lower bars indicate 95% confidence intervals, which were estimated using the delta method. These patient characteristics were found to have a statistically significant impact on latent class membership, as discussed in Supplementary Appendix C.
FIG. 10.
FIG. 10.
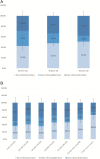
Influence of year of patient IBD diagnosis on latent class membership. Note: Figure reflects the share of respondents who fall into each latent class by year of diagnosis (assuming all other characteristics hold at sample averages). For example, we estimate that among that respondents who were diagnosed less than 1 year ago, 43.1% fall into Class 1, 37.5% fall into Class 2, and 19.3% fall into Class 3. These shares are based on estimates in Supplementary Appendix C, Table C1. Upper and lower bars indicate 95% confidence intervals, which were estimated using the delta method. These patient characteristics were found to have a statistically significant impact on latent class membership, as discussed in Supplementary Appendix C.
FIG. 11.
FIG. 11.
Influence of symptom frequency and resistance to treatment on latent class membership. (A) Symptom frequency. (B) Symptom resistance to treatment. Note: Figure reflects the share of respondents who fall into each latent class by frequency of IBD symptoms and resistance to treatment (assuming all other characteristics hold at sample averages). For example, we estimate that among respondents with symptoms that are resistant to treatment, 45.0% fall into Class 1, 16.0% fall into Class 2, and 38.9% fall into Class 3. These shares are based on estimates in Supplementary Appendix C, Table C1. Upper and lower bars indicate 95% confidence intervals, which were estimated using the delta method. These patient characteristics were found to have a statistically significant impact on latent membership, as discussed in Supplementary Appendix C.

References

    1. Dahlhamer JM. Prevalence of inflammatory bowel disease among adults aged≥ 18 years—United States, 2015. MMWR. 2016;65(42):1166–1169. https://www.cdc.gov/mmwr/volumes/65/wr/mm6542a3.htm. Accessed July 11, 2019. - PubMed
    1. Ehrlich O, Testaverde J, Heller C, et al. . Crohn’s disease and ulcerative colitis patient perspectives on clinical trials and participation. medRxiv. 2018;19000273. Accessed July 11, 2019.
    1. Getz KA. Enrollment performance: weighing the facts. Appl Clin Trials. 2012; 21(5). http://www.appliedclinicaltrialsonline.com/enrollment-performance-weighi.... Accessed July 12, 2019.
    1. Roan S. Medical Clinical Research Slows for Lack of Patients. California:Los Angeles Times. March 14, 2009. http://articles.latimes.com/2009/mar/14/science/sci-clinical-trials14. Accessed July 11, 2019.
    1. Anderson A, Getz KA. Insights and best practices for planning and implementing patient advisory boards. Ther Innov Regul Sci. 2018;52:469–473. - PubMed

LinkOut - more resources