Review
. 2023 Jan 27:11:1126309.
doi: 10.3389/fchem.2023.1126309. eCollection 2023.

H2S-based fluorescent imaging for pathophysiological processes

Affiliations
Review

H2S-based fluorescent imaging for pathophysiological processes

Tong-Tong Jia et al. Front Chem. .

Abstract

Hydrogen sulfide (H2S), as an important endogenous signaling molecule, plays a vital role in many physiological processes. The abnormal behaviors of hydrogen sulfide in organisms may lead to various pathophysiological processes. Monitoring the changes in hydrogen sulfide is helpful for pre-warning and treating these pathophysiological processes. Fluorescence imaging techniques can be used to observe changes in the concentration of analytes in organisms in real-time. Therefore, employing fluorescent probes imaging to investigate the behaviors of hydrogen sulfide in pathophysiological processes is vital. This paper reviews the design strategy and sensing mechanisms of hydrogen sulfide-based fluorescent probes, focusing on imaging applications in various pathophysiological processes, including neurodegenerative diseases, inflammation, apoptosis, oxidative stress, organ injury, and diabetes. This review not only demonstrates the specific value of hydrogen sulfide fluorescent probes in preclinical studies but also illuminates the potential application in clinical diagnostics.

Keywords: biomarker; fluorescence probe; hydrogen sulfide; pathophysiological processes; visualization.


Figures

FIGURE 1
FIGURE 1
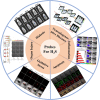
H2S-based small organic fluorescent probes for imaging and diagnosis of pathophysiological processes.
FIGURE 2
FIGURE 2
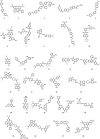
Chemical structures of H2S-responsive probes (1, Li et al., 2018; 2, Ma et al., 2019; 3, Ramya et al., 2022; 4, Bae et al., 2013; 5, Fang et al., 2020; 6, Shen et al., 2021; 7, Kong et al., 2021; 8, Li H et al., 2022; 9, Liang et al., 2022; 10, Ou et al., 2021; 11, Ding et al., 2022; 12, Gong et al., 2021; 13, Wang K et al., 2022; 14, Hu et al., 2021; 15, Wang WX et al., 2022; 16, Ren TB et al., 2021; 17, Singh et al., 2021; 18, Liu et al., 2022; 19, Zhang et al., 2019; 20, Zhu et al., 2020a; 21, Zhu et al., 2020b; 22, Yang et al., 2020; 23, Wang Y et al., 2022; 24, Shu et al., 2020; 25, Tang et al., 2021; 26, Jiao et al., 2018; 27, Su et al., 2022; 28, Li P et al., 2022).
FIGURE 3
FIGURE 3
(A) Confocal imaging of the cross-talk influence of H2S and viscosity in HeLa cells using probe 1 (reproduced from (Li et al., 2018) with permission from American Chemical Society). (B) Time-based in vivo fluorescence imaging of Cu2+ or Cu2+ + H2S in Kunming Mice using probe 2 (reproduced from (Ma et al., 2019) with permission from the Royal Society of Chemistry). (C) AFM images and cytotoxicity of β sheet rich agglomerated form of Aβ1–42 and de-agglomerated smaller Aβ1–42 aggregates formed after incubation with probe 3 (reproduced from (Ramya et al., 2022) with permission from Elsevier (B. V).
FIGURE 4
FIGURE 4
(A) Probe 4 displayed the correlation between CBS expression and H2S levels (reproduced from (Bae et al., 2013) with permission from American Chemical Society). (B) Fluorescence images of H2S and viscosity in drosophila brains using probe 5 (reproduced from (Fang et al., 2020) with permission from Elsevier (B. V). (C) Fluorescence images of viscosity and H2S in a zebrafish model of PD using probe 6 (reproduced from (Shen et al., 2021) with permission from Elsevier (B. V). (D) Fluorescence images of PC12 cells incubated with probe 7 without or with glutamate pre-treatment (reproduced from (Kong et al., 2021) with permission from the Royal Society of Chemistry). (E) Fluorescence images of PC 12 cells induced by Glu using probe 8 (reproduced from (Li S et al., 2022) with permission from Elsevier (B. V).
FIGURE 5
FIGURE 5
Probe 9 for H2S: High-fidelity ferroptosis evaluation in cells during the stroke (reproduced from (Liang et al., 2022) with permission from the Royal Society of Chemistry).
FIGURE 6
FIGURE 6
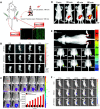
(A) Images of a frozen inflamed and normal tissue slice from Kunming mouse using probe 10 (reproduced from (Ou et al., 2021) with permission from Elsevier (B. V). (B) Time-dependent fluorescence images of air pouch inflammation in a female nude mouse before and after subcutaneous injection of probe 11 (reproduced from (Ding et al., 2022) with permission from the Royal Society of Chemistry). (C) Imaging of H2S during the LPS-induced inflammation in mice using probe 12 (reproduced from (Gong et al., 2021) with permission from American Chemical Society). (D) Fluorescence images of H2S in the inflammation mice model using probe 13 (reproduced from (Wang Y et al., 2022) with permission from the Royal Society of Chemistry). (E) Fluorescence images of H2S generation in an inflammation model in live nude mice using probe 14 (reproduced from (Hu et al., 2021) with permission from the Royal Society of Chemistry). (F) Fluorescence imaging of probe 15 in LPS-induced inflammatory processes in living mice (reproduced from (Wang WX et al., 2022) with permission from Elsevier (B. V).
FIGURE 7
FIGURE 7
(A) Simultaneous fluorescent images of copper (II) ions and H2S in HeLa cells stained with probe 16 and treated with CuSO4 and NaHS at different times (reproduced from (Ren M et al., 2021) with permission from Elsevier (B. V). (B) Determination of apoptosis by TUNEL assay using probe 17 (reproduced from (Singh et al., 2021) with permission from the Royal Society of Chemistry). (C) Apoptosis induced by H2S leads to decrease in cell viability using probe 18 (reproduced from (Liu et al., 2022) with permission from Newlands Press).
FIGURE 8
FIGURE 8
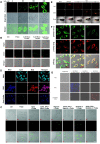
(A) Confocal microscopy images for concentration-dependent H2O2-induced fluorescence in living HeLa cells using probe 19 (reproduced from (Zhang et al., 2019) with permission from the Royal Society of Chemistry). (B) Golgi stress response experiments in cells using probe 20 (reproduced from (Zhu et al., 2020a) with permission from American Chemical Society). (C) Fluorescence imaging of probe 21 after stimulating cells with only probe 22, Mone, aminooxyacetic acid (AOAA)/photoplethysmographic (PPG) Mone, nigericin, AOAA/PPG/igericin, brefeldin A, and AOAA/PPG/brefeldin A, respectively (reproduced from (Zhu et al., 2020b) with permission from the Royal Society of Chemistry). (D) Confocal fluorescence images of endogenous H2O2/H2S in living HeLa cells using probe 22 (reproduced from (Yang et al., 2020) with permission from American Chemical Society). (E) Fluorescence imaging H2S in inflammation response zebrafish using probe 23 (reproduced from (Wang K et al., 2022) with permission from Elsevier (B. V). (F) Confocal imaging of H2S during ER stress with probe 24 (reproduced from (Shu et al., 2020) with permission from American Chemical Society). (G) HUEVC cells imaging endogenous ONOO and H2S using probe 25 (reproduced from (Tang et al., 2021) with permission from Elsevier (B. V).
FIGURE 9
FIGURE 9
(A) TPM imaging of endogenous H2S and HClO in RAW264.7 cells upon drug treatment using probe 26 (reproduced from (Jiao et al., 2018) with permission from American Chemical Society). (B) Schematic illustration of probe 27 reporting the H2S upregulation process in ALI mice’s lungs (reproduced from (Su et al., 2022) with permission from Elsevier (B. V).
FIGURE 10
FIGURE 10
(A) Endogenous H2S biosynthesis in IR-HepG2 cells. (B) Fluorescence imaging of control (up) and diabetic (down) mice using probe 28 (reproduced from (Li Z et al., 2022) with permission from Elsevier (B. V).

Similar articles

Cited by

References

    1. Akçapınar R., Garipcan B., Goodarzi V., Uzun L. (2021). Designing of various biosensor devices for determination of apoptosis: A comprehensive review. Biochem. Biophys. Res. Commun. 578, 42–62. 10.1016/j.bbrc.2021.08.089 - DOI - PubMed
    1. Al-Sofiani M. E., Derenbecker R., Quartuccio M., Kalyani R. R. (2019). Aspirin for primary prevention of cardiovascular disease in diabetes: A review of the evidence. Curr. Diab. Rep. 19, 107. 10.1007/s11892-019-1206-6 - DOI - PubMed
    1. Antequera T., Caballero D., Grassi S., Uttaro B., Perez-Palacios T. (2021). Evaluation of fresh meat quality by hyperspectral imaging (HSI), nuclear magnetic resonance (nmr) and magnetic resonance imaging (MRI): A review. Meat Sci. 172, 108340. 10.1016/j.meatsci.2020.108340 - DOI - PubMed
    1. Augsburger F., Szabo C. (2020). Potential role of the 3-mercaptopyruvate sulfurtransferase (3-mst)-hydrogen sulfide (H2S) pathway in cancer cells. Pharmacol. Res. 154, 104083. 10.1016/j.phrs.2018.11.034 - DOI - PubMed
    1. Austgen J. R., Hermann G. E., Dantzler H. A., Rogers R. C., Kline D. D. (2011). Hydrogen sulfide augments synaptic neurotransmission in the nucleus of the solitary tract. J. Neurophysiol. 106, 1822–1832. 10.1152/jn.00463.2011 - DOI - PMC - PubMed

LinkOut - more resources