. 2022 Nov 11;2(12):100214.
doi: 10.1016/j.xgen.2022.100214. eCollection 2022 Dec 14.

Type 1 diabetes risk genes mediate pancreatic beta cell survival in response to proinflammatory cytokines

Affiliations

Type 1 diabetes risk genes mediate pancreatic beta cell survival in response to proinflammatory cytokines

Paola Benaglio et al. Cell Genom. .

Abstract

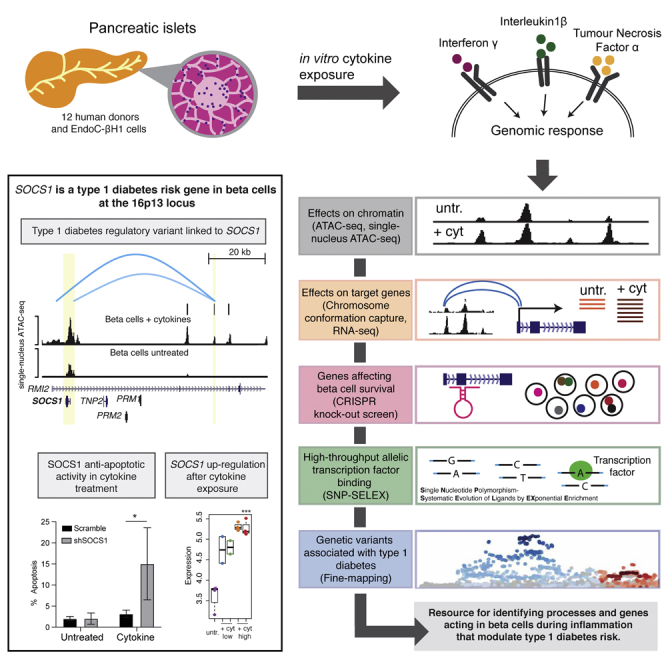
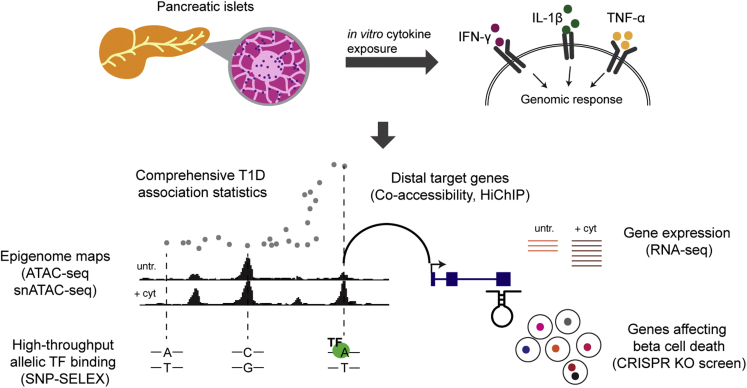
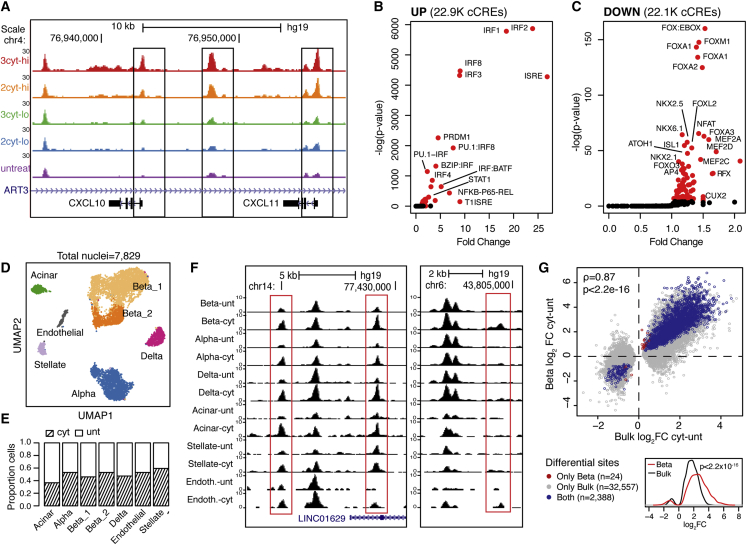
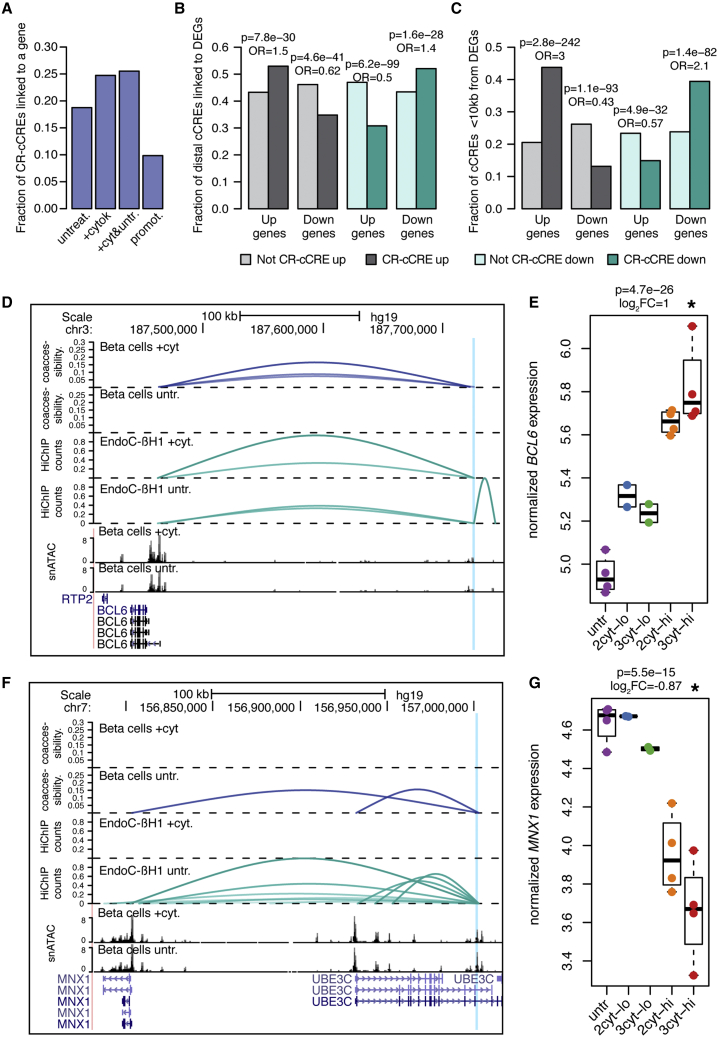
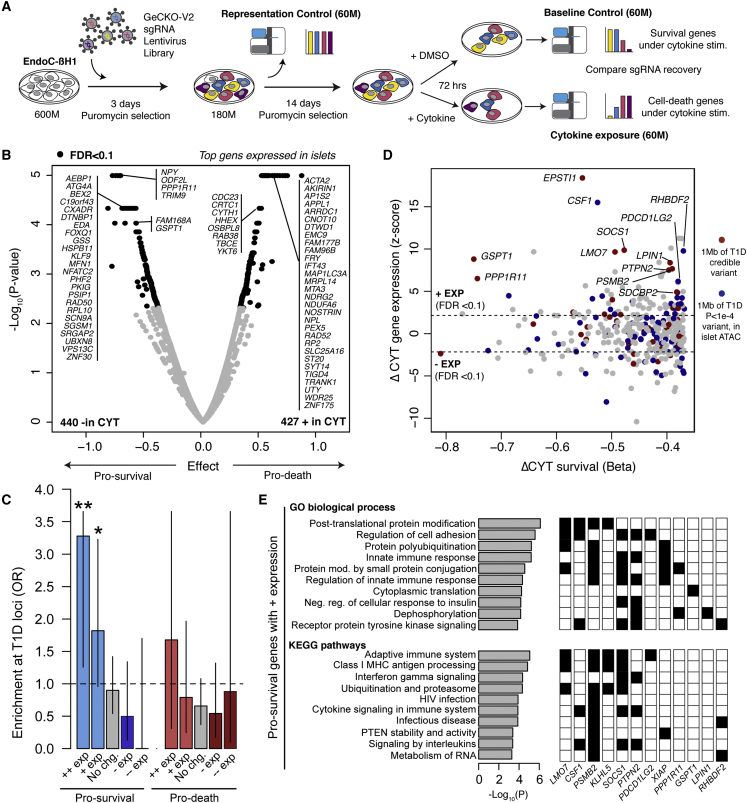
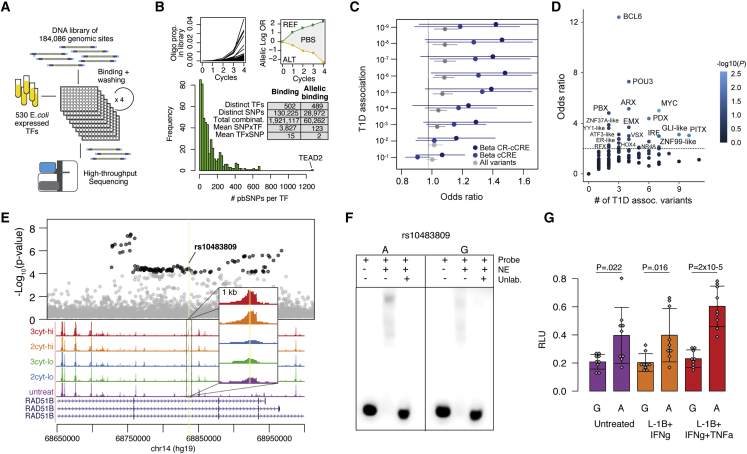
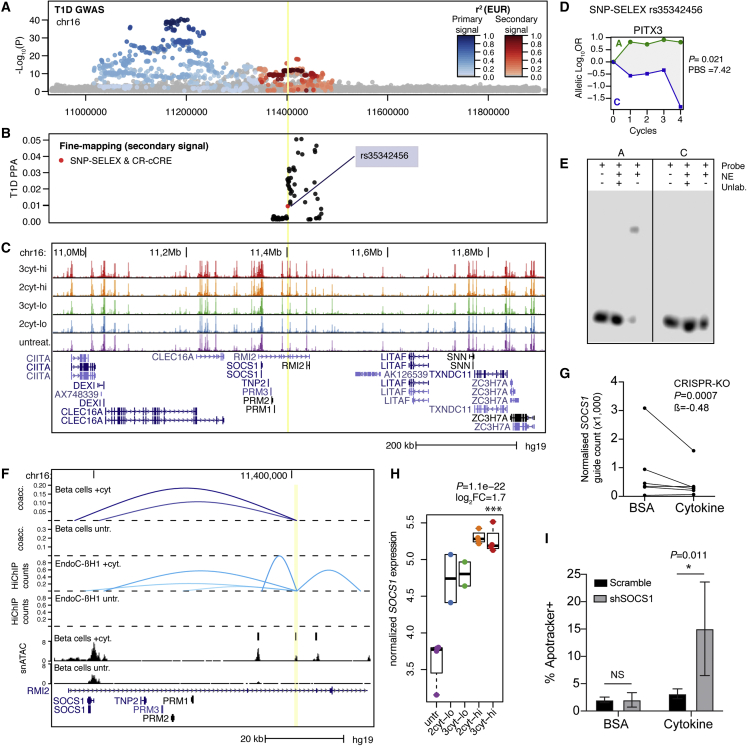
We combined functional genomics and human genetics to investigate processes that affect type 1 diabetes (T1D) risk by mediating beta cell survival in response to proinflammatory cytokines. We mapped 38,931 cytokine-responsive candidate cis-regulatory elements (cCREs) in beta cells using ATAC-seq and snATAC-seq and linked them to target genes using co-accessibility and HiChIP. Using a genome-wide CRISPR screen in EndoC-βH1 cells, we identified 867 genes affecting cytokine-induced survival, and genes promoting survival and up-regulated in cytokines were enriched at T1D risk loci. Using SNP-SELEX, we identified 2,229 variants in cytokine-responsive cCREs altering transcription factor (TF) binding, and variants altering binding of TFs regulating stress, inflammation, and apoptosis were enriched for T1D risk. At the 16p13 locus, a fine-mapped T1D variant altering TF binding in a cytokine-induced cCRE interacted with SOCS1, which promoted survival in cytokine exposure. Our findings reveal processes and genes acting in beta cells during inflammation that modulate T1D risk.

Keywords: 3D chromatin interactions; CRISPR screen; accessible chromatin; beta cell; functional genomics; gene expression; high-throughput reporter assay; human genetics; proinflammatory cytokines; type 1 diabetes.


Conflict of interest statement

K.J.G. is a consultant of Genentech and holds stock in Neurocrine Biosciences. B.R. is a consultant of Arima Genomics and a co-founder of Epigenome Technologies. P.B. is an employee of Shoreline Bioscience. N.N. is an employee of Guardant Health. E.B. is an employee and shareholder of Aetion. K.K. is an employee of Cartography Bio. Y.Q. is an employee of Sana Biotechnology. M.D. is an employee and shareholder of Seer. J.C. is an employee and shareholder of Pfizer.

Figures

None
Graphical abstract
Figure 1
Figure 1
Overview of study design Schematic representation of the experimental design of the study.
Figure 2
Figure 2
Map of islet accessible chromatin in inflammatory cytokine exposure (A) Genome browser of the CXCL10/CXCL11 locus showing ATAC-seq across cytokine treatments at 24 h s. 2cyt: IL-1b and IFN-γ, 3cyt: IL-1b, IFN-γ, and TNF-α, lo: low-dose, hi: high-dose, untr: untreated. (B and C) Sequence motifs enriched in up-regulated (B) and down-regulated (C) cCREs across all treatments, compared with all tested cCREs. (D) UMAP of snATAC-seq profiles of islet samples from four individuals. (E) Barplot showing the proportion of cytokine-treated and untreated cells in each cell type. (F) Genome browser showing cytokine-responsive cCREs shared across cell types (left) or beta cell-specific (right). (G) Scatterplot showing effect of cytokine-responsive cCREs in bulk ATAC (x-axis) and in beta cell snATAC (y-axis). Spearman correlation and p-values are indicated. Bottom: density plot showing effect size in beta cells for cytokine-responsive cCREs significant in both beta cells and bulk islets. P value from two-sided Wilcoxon signed rank test is shown.
Figure 3
Figure 3
Target genes of beta cells cCREs in inflammatory cytokine exposure (A) Fraction of cytokine-responsive cCREs (CR-cREs) co-accessible with at least one promoter in beta cells in untreated, cytokine-stimulated, or pooled cells; or proximal (<10 kb) to a promoter. (B and C) Enrichment of (B) distal cytokine-responsive cCREs or (C) promoter-proximal cytokine-responsive cCREs (<10 kb) for co-accessibility to genes with concordant effects. Odds ratios and uncorrected p-values from Fisher’s exact test are shown. (D) Example of an up-regulated cytokine-responsive cCRE linked to cytokine-up-regulated gene BCL6. Top to bottom: co-accessibility in beta cells in cytokine or untreated conditions, virtual 4C from HiChIP in EndoC-βH1 in cytokine or untreated conditions, snATAC in beta cells in cytokine or untreated conditions, gene annotations. Virtual 4C counts are scaled between 0 and 1. Only co-accessibility arcs that link the highlighted distal peak and promoter are shown. (E) Normalized expression of BCL6 in human islets in cytokines. Log2 fold change and uncorrected p values shown are from DESeq2 analysis comparing high-dose three-cytokine-treated islets (red) versus untreated (purple). (F−G) Same as (D) and (E) but showing an example of a down-regulated cCRE linked to the promoter of a down-regulated gene MNX1. Treatment abbreviations as in Figure 1.
Figure 4
Figure 4
Genes affecting beta cell survival in cytokine exposure (A) Design of the genome-wide CRISPR loss-of-function screen in cytokine-treated EndoC-βH1 cells. (B) Volcano plot of gene effects on beta cell survival from the screen. Effect sizes and uncorrected −log10 p values are shown from MAGeCK, and genes with significant (FDR < 0.1) enrichment and depletion are in bold. The most significant genes with TPM > 1 in islets are labeled. (C) Enrichment of known T1D risk loci for genes enriched and depleted in screen, partitioned by expression (+/− exp = FDR < 0.1, ++/−− exp = FDR < 1 × 10−5) in islets after high-dose three-cytokine stimulation. Values are odds ratios, and error bars are 95% CI from Fisher’s exact test. (D) Scatterplot showing the effect size of genes promoting beta cell survival in the screen and differential expression of the gene in islets after cytokine treatment. Genes mapping within 1 MB of a known T1D locus or within 1 MB of a variant with nominal (p < 1 × 10−4) T1D association are colored. (E) Pathways from gene ontology (GO) and KEGG enriched in genes with increased expression in cytokine-treated islets and promoting beta cell survival. P values are from GSEA analysis. A subset of genes mapping to known T1D loci or with nominal T1D association are shown with corresponding pathways. Only pathways that contain at least one T1D gene are shown, and the full list is in Table S6.
Figure 5
Figure 5
Identifying transcriptional regulators affecting T1D risk in beta cell cCREs with SNP-SELEX (A) Design of HT-SELEX-seq experiment. (B) Top: Example of enrichment profiles of bound oligos within an experiment and of an SNP with preferential binding. Bottom: Distribution of the number of variants with allelic binding per TF across 489 TFs and table summarizing the number of bound variants and allelic binding variants across TFs. (C) Enrichment of variants with allelic binding for T1D association among all tested variants, variants in beta cell cCREs, and variants in cytokine-responsive beta cell cCREs. Values are odds ratios and error bars are 95% CI from Fisher’s exact test. (D) Enrichment of variants with allelic binding of specific TF sub-families for T1D association among variants in cytokine-responsive beta cell cCREs. Values represent odds ratios by Fisher’s exact test, and points are colored by p value. (E) Regional plot of T1D association, with variants with p < 10−4 in black; bulk ATAC-seq from human islets. Treatment abbreviations as in Figure 1. (F) EMSA using nuclear extract (NE) from cytokine-treated MIN6 with probes for each allele of rs10483809. (G) Luciferase assays for rs10483809 alleles in MIN6 in untreated or high-dose cytokines compared with empty vector. Values are mean and error bars SD from n = 9 transfections, with uncorrected p values shown from two-sided t tests.
Figure 6
Figure 6
T1D locus 16p13 regulates beta cell survival gene SOCS1 in cytokine exposure (A) Regional plot showing T1D association for two independent signals at the DEXI/SOCS1 locus. (B) Fine mapping probabilities of the secondary signal. Variants with SNP-SELEX effect on differential TF binding and within a cytokine-responsive cCRE are highlighted in red. (C) Genome browser of the locus showing bulk ATAC-seq. Treatment abbreviations as in Figure 1. (D) SNP-SELEX results for variant rs35342456. (E) EMSA with nuclear extract (NE) from MIN6 cells showing preferential binding to the reference allele. (F) Zoom in of the locus showing location of variant rs35342456 (yellow line) in a cytokine-responsive beta cell cCRE with co-accessibility and 3D interaction to the SOCS1 promoter in cytokine-treated and untreated EndoC-βH1 cells. For 3D interactions, virtual 4C counts are scaled between 0 and 1. (G) Counts of each sgRNA in the CRISPR-KO screen targeting SOCS1 in untreated and high-dose cytokine EndoC-βH1, normalized to the sequencing depth of each sample. Effect size and uncorrected p value from MAGeCK. (H) Normalized expression of SOCS1 in human islet samples in cytokines. Log2 fold change and uncorrected p values from DESeq2 comparing high-dose three-cytokine (red) and untreated (purple). (I) Quantification of apoptotic EndoC-βH1 cells with shRNA targeting SOCS1 or scramble in either high-dose cytokine or vehicle (0.1% BSA). Values are mean and error bars are SD from n = 4 transductions, and p values are shown from two-way ANOVA followed by pairwise comparisons using Tukey’s HSD.

References

    1. Atkinson M.A. The pathogenesis and natural history of type 1 diabetes. Cold Spring Harb. Perspect. Med. 2012;2:a007641. doi: 10.1101/cshperspect.a007641. - DOI - PMC - PubMed
    1. Eizirik D.L., Colli M.L., Ortis F. The role of inflammation in insulitis and beta-cell loss in type 1 diabetes. Nat. Rev. Endocrinol. 2009;5:219–226. doi: 10.1038/nrendo.2009.21. - DOI - PubMed
    1. Brozzi F., Nardelli T.R., Lopes M., Millard I., Barthson J., Igoillo-Esteve M., Grieco F.A., Villate O., Oliveira J.M., Casimir M., et al. Cytokines induce endoplasmic reticulum stress in human, rat and mouse beta cells via different mechanisms. Diabetologia. 2015;58:2307–2316. doi: 10.1007/s00125-015-3669-6. - DOI - PubMed
    1. Nunemaker C.S. Considerations for defining cytokine dose, duration, and milieu that are appropriate for modeling chronic low-grade inflammation in type 2 diabetes. J. Diabetes Res. 2016;2016:1–9. doi: 10.1155/2016/2846570. - DOI - PMC - PubMed
    1. Ortis F., Naamane N., Flamez D., Ladrière L., Moore F., Cunha D.A., Colli M.L., Thykjaer T., Thorsen K., Orntoft T.F., Eizirik D.L. Cytokines interleukin-1 and tumor necrosis factor- regulate different transcriptional and alternative splicing networks in primary -cells. Diabetes. 2010;59:358–374. doi: 10.2337/db09-1159. - DOI - PMC - PubMed