. 2022 Nov 11;2(12):100213.
doi: 10.1016/j.xgen.2022.100213. eCollection 2022 Dec 14.

Expanding the genomic encyclopedia of Actinobacteria with 824 isolate reference genomes

Affiliations

Expanding the genomic encyclopedia of Actinobacteria with 824 isolate reference genomes

Rekha Seshadri et al. Cell Genom. .

Abstract

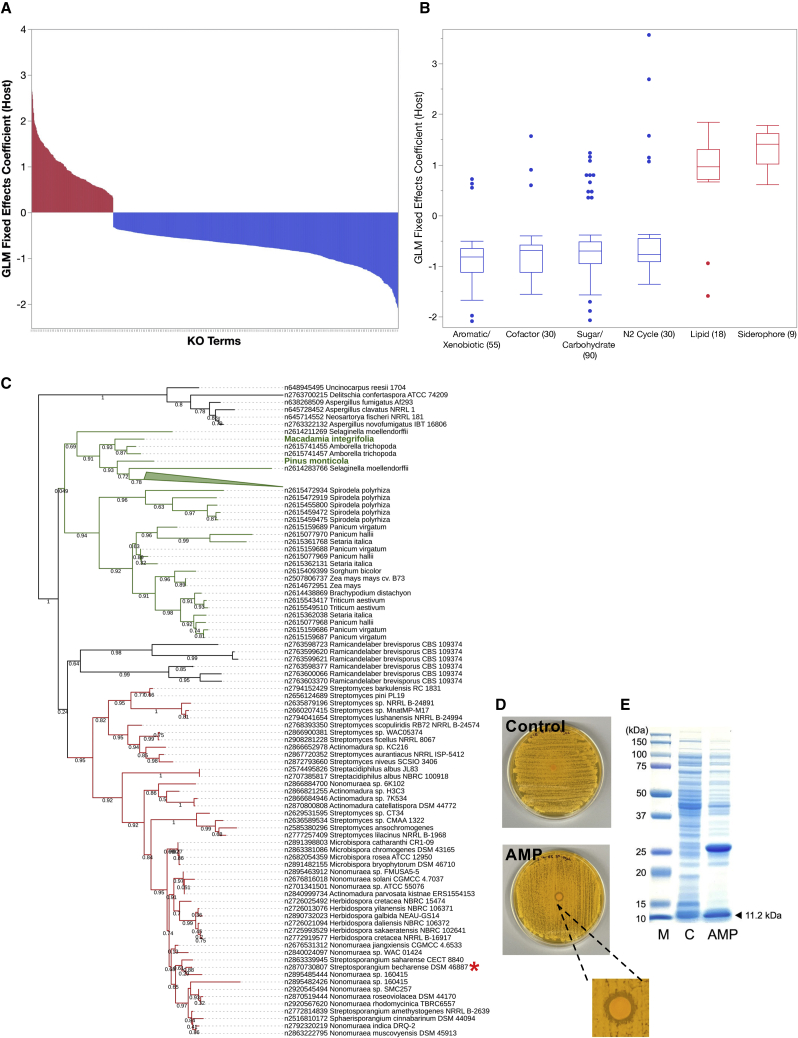
The phylum Actinobacteria includes important human pathogens like Mycobacterium tuberculosis and Corynebacterium diphtheriae and renowned producers of secondary metabolites of commercial interest, yet only a small part of its diversity is represented by sequenced genomes. Here, we present 824 actinobacterial isolate genomes in the context of a phylum-wide analysis of 6,700 genomes including public isolates and metagenome-assembled genomes (MAGs). We estimate that only 30%-50% of projected actinobacterial phylogenetic diversity possesses genomic representation via isolates and MAGs. A comparison of gene functions reveals novel determinants of host-microbe interaction as well as environment-specific adaptations such as potential antimicrobial peptides. We identify plasmids and prophages across isolates and uncover extensive prophage diversity structured mainly by host taxonomy. Analysis of >80,000 biosynthetic gene clusters reveals that horizontal gene transfer and gene loss shape secondary metabolite repertoire across taxa. Our observations illustrate the essential role of and need for high-quality isolate genome sequences.

Keywords: actinobacteria; comparative genomics; ecology; evolution; metagenomics; microbiology; mycobacteria; secondary metabolites.


Conflict of interest statement

The authors declare no competing financial interests.

Figures

None
Graphical abstract
Figure 1
Figure 1
Phylogenetic diversity (PD) of phylum Actinobacteria (A) A total of 824 isolate genomes were sequenced from diverse taxa and habitats. Snapshot of taxonomic (order level) composition and isolation source of the 824 GEBA-Actino genomes is presented. Number of genomes attributed to each taxon or isolation source is shown next to each label. (B) PD accumulation curve depicting incremental increase in PD inferred from computed branch lengths of RpoB tree. The units on the x axis represent individual taxa or their equivalents (arising from metagenomes) ordered by genome category as the “accumulation units”: isolates (Public in green and GEBA in blue), MAGs (HQ in red and MQ in orange), and metagenomic sequences in gray. PD score based on summed branch lengths is shown on the y axis. (C) RpoB gene-based maximum likelihood phylogenetic tree used for PD calculation. The tree was rooted based on a representative set of archaeal RpoB sequences. For visualization purposes, clades with zero branch lengths were collapsed, and a single clade representative was retained. Individual actinobacterial classes are colored as indicated using the iToL interface. Uncolored sectors indicate operational taxonomic units (OTUs) composed entirely of uncultivated (metagenome and MAG) signatures. Pie charts indicate the proportion of isolate versus uncultivated sequences contributing leaves to each designated class. Inset trees show clades within class Actinobacteria (inset I) or class Thermoleophilia (inset II), highlighting GEBA type strains that could inform cultivation of members of adjoining uncultivated clades.
Figure 2
Figure 2
Functional adaptations of host versus environmental Actinobacteria (A) Significantly over- or underrepresented functions (KO terms, FDR-adjusted [adj.] p < 0.005) in host-associated versus other environmental genomes are shown. The x axis shows individual KO terms, while the y axis shows the logistic regression coefficient from a fixed-effect generalized linear model. Positive values (in red) indicate overrepresentation in host-associated genomes, while negative values (in blue) indicate overrepresentation in environmental group genomes. (B) Distribution of logistic regression coefficients (y axis) for individual KO function categories (x axis, discussed in the main text) is shown. Number of individual KO terms within each function category is shown in parentheses. Blue boxplots denote categories that are overrepresented in the environmental group, while red boxes denote categories in the host-associated group. (C) Maximum likelihood tree of eukaryal and bacterial candidate sequences assigned to PF09117. Characterized plant reference sequences are highlighted with green text. Bacterial branches are colored red, plant branches are green, and fungal branches are black. (D) Inhibition of Saccharomyces cerevisiae by AMP candidate of Streptosporangium becharense DSM 46887 overexpressed in E. coli. (E) SDS-PAGE gel showing the overexpression of recombinant AMP in E. coli. Lanes are protein size marker (M), control strain (C), and AMP-producing strain (AMP), respectively. The expected 11.2 kDa band of the AMP is highlighted.
Figure 3
Figure 3
Overview of BGC abundances across actinobacterial genomes (A) Relationship between genome size and total number of predicted BGCs per genome. Data points are colored based on isolation source (where available). The x axis is the genome size (in Mbp), and the y axis is the total number of BGCs. (B) Distribution of percentage of BGCs (total BGC length as percentage of total genome length) for isolate genomes (including GEBA and public) compared with HQ MAGs.
Figure 4
Figure 4
Horizontal gene transfer of BGCs (A) Examining the role of plasmid-mediated HGT within a closely related subset of Pseudonocardia spp. Maximum likelihood tree based on RpoB gene alignments of selected strains is annotated with bar charts depicting the number of BGCs for each class predicted by AntiSMASH (drawn using iToL). Bootstrap support is included. “P” is used to indicate a BGC detected on a plasmid scaffold predicted in that genome. “℗” adjacent to a genome label indicates a BGC-bearing plasmid. Other genomes may have plasmids, but BGCs were not encoded on those plasmids. Subclades are highlighted as discussed in the manuscript. Black stars mark further instances of HGT as illustrated in (B). (B) Schematic of BGC examples in strain HH130629-09 that may have been acquired via alternative means of HGT such as ICEs. The core genes for the BGC are colored green, while red indicates hallmark genes for integration or transposition. tRNA genes are shown in black. (C) Genera encoding the highest numbers of HGT BGCs (orange bars) are contrasted with non-HGT BGCs (blue bars). Bars for Streptomyces are truncated for better display and total 11,018 HGT BGCs versus 15,507 non-HGT BGCs. Top panel with weighted points is the average percentage of BGCs of genomes in each genus. On the x axis, genera are ordered by descending order of total number of BGCs without HGT. Number of genomes for each genus is shown in parentheses.
Figure 5
Figure 5
Overview of prophage content across Actinobacteria genomes (A) Number of complete and near-complete prophages detected by genomes across major families. Families with ≤50 genomes are gathered in the “other” category. (B) Number of distinct viral clusters detected by host genus, relative to the number of genomes screened in the genus. The bottom panel shows a zoomed-in version of the data for genera with ≤105 genomes. Individual genera with the most VCs and/or genomes mined are named on each plot. (C) Prophage insertion site across major Actinobacteria families. For each prophage, the host genomic regions immediately 1 kb upstream and downstream of the 5′ and 3′ ends, respectively, were screened for the detection of tRNA, integrase-like genes, or transposases belonging to other mobile genetic elements (i.e., not the prophage currently considered), and transcription regulators. Families with ≤50 genomes are gathered in the “other” category.

References

    1. van Bergeijk D.A., Terlouw B.R., Medema M.H., van Wezel G.P. Ecology and genomics of Actinobacteria: new concepts for natural product discovery. Nat. Rev. Microbiol. 2020;18:546–558. doi: 10.1038/s41579-020-0379-y. - DOI - PubMed
    1. Barka E.A., Vatsa P., Sanchez L., Gaveau-Vaillant N., Jacquard C., Meier-Kolthoff J.P., Klenk H.P., Clément C., Ouhdouch Y., van Wezel G.P. Taxonomy, physiology, and natural products of Actinobacteria. Microbiol. Mol. Biol. Rev. 2016;80:1–43. doi: 10.1128/MMBR.00019-15. - DOI - PMC - PubMed
    1. Lewin G.R., Carlos C., Chevrette M.G., Horn H.A., McDonald B.R., Stankey R.J., Fox B.G., Currie C.R. Evolution and ecology of Actinobacteria and their bioenergy applications. Annu. Rev. Microbiol. 2016;70:235–254. doi: 10.1146/annurev-micro-102215-095748. - DOI - PMC - PubMed
    1. Navarro-Muñoz J.C., Selem-Mojica N., Mullowney M.W., Kautsar S.A., Tryon J.H., Parkinson E.I., De Los Santos E.L.C., Yeong M., Cruz-Morales P., Abubucker S., et al. A computational framework to explore large-scale biosynthetic diversity. Nat. Chem. Biol. 2020;16:60–68. doi: 10.1038/s41589-019-0400-9. - DOI - PMC - PubMed
    1. Prudence S.M.M., Addington E., Castaño-Espriu L., Mark D.R., Pintor-Escobar L., Russell A.H., McLean T.C. Advances in actinomycete research: an ActinoBase review of 2019. Microbiology. 2020;166:683–694. doi: 10.1099/mic.0.000944. - DOI - PMC - PubMed