. 2023 Jan 16;19(3):916-935.
doi: 10.7150/ijbs.79095. eCollection 2023.

ESRG is critical to maintain the cell survival and self-renewal/pluripotency of hPSCs by collaborating with MCM2 to suppress p53 pathway

Affiliations

ESRG is critical to maintain the cell survival and self-renewal/pluripotency of hPSCs by collaborating with MCM2 to suppress p53 pathway

Shasha Li et al. Int J Biol Sci. .

Abstract

The mechanisms of self-renewal and pluripotency maintenance of human pluripotent stem cells (hPSCs) have not been fully elucidated, especially for the role of those poorly characterized long noncoding RNAs (lncRNAs). ESRG is a lncRNA highly expressed in hPSCs, and its functional roles are being extensively explored in the field. Here, we identified that the transcription of ESRG can be directly regulated by OCT4, a key self-renewal factor in hPSCs. Knockdown of ESRG induces hPSC differentiation, cell cycle arrest, and apoptosis. ESRG binds to MCM2, a replication-licensing factor, to sustain its steady-state level and nuclear location, safeguarding error-free DNA replication. Further study showed that ESRG knockdown leads to MCM2 abnormalities, resulting in DNA damage and activation of the p53 pathway, ultimately impairs hPSC self-renewal and pluripotency, and induces cell apoptosis. In summary, our study suggests that ESRG, as a novel target of OCT4, plays an essential role in maintaining the cell survival and self-renewal/pluripotency of hPSCs in collaboration with MCM2 to suppress p53 signaling. These findings provide critical insights into the mechanisms underlying the maintenance of self-renewal and pluripotency in hPSCs by lncRNAs.

Keywords: ESRG; MCM2; OCT4; cell survival; human pluripotent stem cells; p53; pluripotency.


Conflict of interest statement

Competing Interests: The authors have declared that no competing interest exists.

Figures

Figure 1
Figure 1
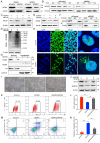
ESRG maintains pluripotency of hPSCs. (A) Northern blot analysis of ESRG with DIG Probe in various cell lines. Lanes 1 to 6 were H9, H1, RC1-iPSC, RC2-iPSC, HFF and 293T cell lines, respectively. (B) After the differentiation of H9 hESCs was induced by retinoic acid (RA) in vitro, the expression of ESRG, OCT4, SOX2 and NANOG was detected by qPCR. (C) The RNA level of ESRG was analyzed by qPCR after transfecting each of the three effective siRNA sequences (siESRG1, siESRG2, siESRG3) for 48 h. (D) Brightfield images of H9 hESCs transfected with siESRG (herein siESRG1, the same below). Scale bar, 100 μm. (E) AP staining was performed in H9 hESCs transfected with siESRG or siControl, and the dark blue color indicated undifferentiated, AP-positive cells. Scale bar, 100 μm. (F) The expression of pluripotency marker genes was analyzed by qPCR in H9 hESCs transfected with siESRG or siControl. (G) H9 hESCs transfected with siESRG or siControl were stained with anti-OCT4, anti-SSEA4 and anti-TRA-1-60 antibodies (upper panel). Hoechst 33342 was used to label cell nuclei (lower panel). Scale bar, 100 μm. (H) Protein levels of OCT4, NANOG and LIN28A were detected by Western blot analysis in ESRG knockdown and control H9 hESCs. (I) The expression of endoderm, mesoderm, ectoderm and trophectoderm marker genes was analyzed by qPCR in H9 hESCs transfected with siESRG. (J) Teratomas were derived from H9-TetR-shESRG cells inoculated NSG mice with or without treatment of Dox. Data are presented as mean ± SD. *P < 0.05, **P < 0.01, ***P < 0.001 (two-tailed Student's t test).
Figure 2
Figure 2
ESRG is essential for hPSC self-renewal. (A) EdU assay was analyzed by flow cytometry in H9 hESCs transfected with siESRG or siControl at 24 h (first column), 48 h (second column) and 72 h (third column) after transfection. (B) The quantified analysis of EdU positive cells. (C) Data from the CCK-8 assay of ESRG knockdown and control H9 hESCs. (D) Cell cycle distribution was analyzed by flow cytometry in H9 hESCs transfected with siESRG or siControl at 24 h (first column), 48 h (second column) and 72 h (third column) after transfection. (E) The quantified analysis of cell cycle distribution. (F) Apoptosis was analyzed using a FITC/Annexin V apoptosis assay in H9 hESCs transfected with siESRG or siControl at 24 h (left column), 48 h (middle column) and 72 h (right column) after transfection. (G) The quantified analysis of the apoptosis assay. (H) H9 hESCs transfected with siESRG or siControl were stained with JC-1 to evaluate the MMP. Scale bar, 100 μm. All representative examples of the data from at least three independent experiments are shown. Data are presented as mean ± SD. *P < 0.05, **P < 0.01, ***P < 0.001 (two-tailed Student's t test).
Figure 3
Figure 3
ESRG is transcriptionally regulated by OCT4. (A) The relative luciferase activities in hPSCs (H9 and RC1) transfected with a luciferase vector containing the -2049/+11 fragment of ESRG are similar to that of the pGL3 control vector. (B) A ChIP assay was performed in H9 hESCs lysates. (C) The relative luciferase activity in H9 hESCs co-transfected with either siOCT4 or siControl and either a pESRG-OCT4B-luciferase reporter plasmid or a pGL3 control plasmid. (D) The relative luciferase activity in 293T cells co-transfected with either pcDNA3.1-OCT4 or pcDNA3.1 (negative control) and either pESRG-OCT4B-luciferase reporter plasmid or pGL3 control plasmid. (E) Detection of luciferase activity in H9 hESCs transfected with a mutant pESRG-OCT4B-luciferase reporter plasmid harboring a mutated OCT4 binding site and a wild-type pESRG-OCT4B-luciferase reporter plasmid. The relative luciferase activity represents the ratio of firefly luciferase activity to Renilla luciferase activity (internal control). (F) QPCR analysis was performed for OCT4 and ESRG expression in H9 hESCs transfected with siOCT4 or siControl. (G) QPCR analysis of OCT4 and ESRG expression in two Dox inducible H9-TetR-shOCT4 cell clones (C1 and C4) treated with or without Dox. (H) Fluorescence intensity of ESRG-tdTom cells transfected with siOCT4 at 24 h, 48 h and 72 h. Red fluorescence represents ESRG expression. Scale bar, 100 μm. (I) Phase images of ESRG Pr-tdTomato reporter H9 hESCs treated with RA for 5 days. Red fluorescence represents ESRG expression. Scale bar, 100 μm. Data are presented as mean ± SD. **P < 0.01, and ***P < 0.001 by two-tailed Student's t test.
Figure 4
Figure 4
ESRG functions in hPSCs by directly binding MCM2. (A) RNA pulldown showed binding between ESRG and MCM2 in H9 hESCs. (B) The interaction of ESRG and MCM2 was detected through RIP assay in H9 hESCs. (C) ESRG was visualized by RNA-FISH, and MCM2 was stained by immunofluorescence in H9 hESCs. Scale bar, 100 μm. (D) Deletion mapping of the MCM2-binding domain in ESRG. Top, diagrams of full-length ESRG and the deletion fragments. Middle, the in vitro-transcribed full-length ESRG and deletion fragments with the correct sizes are indicated. Bottom, immunoblot analysis for MCM2 in the protein samples pulled down by different ESRG constructs. (E) The immunoblot analysis of Flag-tagged MCM2 [wild-type vs. domain truncation mutants (MCM2-N and MCM2-C)] retrieved by in vitro-transcribed biotinylated ESRG. The domain structure of MCM2 is shown above. (F) The isolated MCM2-N domain is sufficient for binding to ESRG, as demonstrated using the RIP assay. (G) The immunoblot analysis of Flag-tagged MCM2 [domain truncation mutants (MCM2-N1, MCM2-N2 and MCM2-N3)] retrieved by in vitro-transcribed biotinylated ESRG. The domain structure of MCM2-N is shown above. (H) The isolated MCM2-N1 domain is sufficient for binding to ESRG, as demonstrated using the RIP assay. Data are presented as mean ± SD. ***P < 0.001 by two-tailed Student's t test.
Figure 5
Figure 5
ESRG sustains the steady-state levels and nuclear location of MCM2. (A) The expression of MCM2 was detected by Western blot after transfection of H9 cells and RC1-iPSCs with siESRG. (B) The expression of MCM2 in H9 cells (siControl vs siESRG) was detected by Western blot after treatment with CHX (20 μg/mL) for various time periods respectively. (C) H9 cells were transfected with ESRG siRNA and pre-incubated with MG-132 (20 μM) for 4 h. Cell lysate was immunoblotted by anti-MCM2. (D) H9 cells were pre-incubated with MG-132 (20 μM) for 4h. Ub was immunoprecipitated (IP) by anti-MCM2 and immunoblotted (IB) by anti-Ub. The ubiquitination of MCM2 protein was detected after ESRG knockdown. (E) H9 cells were treated with TRAIP siRNA followed by ESRG knockdown. MCM2 protein expression was detected by Western blot. (F) The interaction of MCM2 and TRAIP was measured by Co-IP after treated with siControl or siESRG in H9 hESCs. (G) The nuclear and cytoplasmic extracts from H9 cells after ESRG knockdown were detected by Western blot. (H) MCM2 was visualized in H9 hESCs treated with siControl and siESRG by immunofluorescence staining. Scale bar, 20 μm. (I and J) MCM2 overexpression partially rescued morphological changes (I) and the protein levels of OCT4 and NANOG (J) reduced by ESRG knockdown. oe, overexpression. Scale bar, 100 μm. (K-N) MCM2 overexpression partially rescued the cell proliferation (K) and apoptosis (M) induced by ESRG knockdown. The quantified analyses of EdU and apoptosis assay are shown in (L) and (N). All representative examples of the data from at least three independent experiments are shown. Data are presented as mean ± SD. **P < 0.01 by two-tailed Student's t test.
Figure 6
Figure 6
ESRG-MCM2 maintains the cell survival and self-renewal/pluripotency of hPSCs by suppressing the p53 signaling pathway. (A) Representative pictures of comet assay performed 48 h in H9 hESCs after treatment with siControl and siESRG. Scale bar, 200 μm. (B) The quantified analysis of comet assay. (C and D) H9 hESCs were transfected with MCM2 vector followed by ESRG knockdown. γ-H2AX protein expression was detected by Western blot (C) and immunofluorescence staining (D). Scale bar, 100 μm. (E) Western blot was performed to analyze the protein levels of p53, Pho-p53, ATM and Pho-ATM in H9 cells treated with siControl and siESRG. (F and G) The expression of p53 signaling pathway genes was analyzed by qPCR (F) and Western blot (G) in H9 hESCs transfected with siESRG or siControl. (H) Western blot was performed to analyze the protein levels of apoptosis-related proteins in H9 cells treated with siControl and siESRG. (I) Schematic model of the mechanisms by which ESRG affects the cell survival and self-renewal/pluripotency of hPSCs. All representative examples of the data from at least three independent experiments are shown. Data are presented as mean ± SD. *P < 0.05, **P < 0.01 and ***P < 0.001 by two-tailed Student's t test.
Figure 7
Figure 7
hPSCs are sensitive to p53 in the initial period of ESRG knockdown. (A) Brightfield images of H9-TetR-shESRG cells after Dox treatment for different durations. Scale bar, 100 μm. (B) Brightfield images of H9-TetR-shESRG cells after Dox (0.01 μg/mL) and PFTα (10 µΜ) treatment for different duration. PFTα: a p53 inhibitor. Scale bar, 100 μm. (C) H9-TetR-shESRG cells were treated with Dox (0.01 µg/mL) and PFTα (10 µΜ), but the addition of PFTα had stopped since day 3. Displayed are representative images of the cells captured at different durations. Scale bar, 100 μm. (D) The quantified analysis of cell number in (A-C). (E) Phase images of H9-TetR-shESRG cells under different conditions (upper panel: H9-TetR-shESRG cells under normal growth, without any treatment; lower panel: Cells in (C) continued to grow after 7 days and underwent their first passage). Scale bar, 100 μm. (F) qPCR detection for expression of ESRG and p53 in two groups of cells in (E). (G) Western blotting detection for expression of p53 in two groups of cells in (E). (H) The quantified analysis of (G). (I) The expression of OCT4 and NANOG in surviving cells (C) was detected by immunofluorescence assay. Scale bar, 100 μm. Data are presented as mean ± SD. ***P < 0.001 by two-tailed Student's t test, ns=no significance.

Similar articles

Cited by

References

    1. Thomson JA, Itskovitz-Eldor J, Shapiro SS. et al. Embryonic stem cell lines derived from human blastocysts. Science. 1998;282:1145–7. - PubMed
    1. Zakrzewski W, Dobrzynski M, Szymonowicz M. et al. Stem cells: past, present, and future. Stem Cell Res Ther. 2019;10:68. - PMC - PubMed
    1. Wang Z, Oron E, Nelson B. et al. Distinct lineage specification roles for NANOG, OCT4, and SOX2 in human embryonic stem cells. Cell Stem Cell. 2012;10:440–54. - PubMed
    1. Gifford CA, Ziller MJ, Gu H. et al. Transcriptional and epigenetic dynamics during specification of human embryonic stem cells. Cell. 2013;153:1149–63. - PMC - PubMed
    1. Warmflash A, Arduini BL, Brivanlou AH. The molecular circuitry underlying pluripotency in embryonic stem cells. Wiley Interdiscip Rev Syst Biol Med. 2012;4:443–56. - PMC - PubMed

Publication types

MeSH terms

Substances