. 2023 Feb 1:2023:3602962.
doi: 10.1155/2023/3602962. eCollection 2023.

Exosomes from Adipose-Derived Stem Cells Alleviate Dexamethasone-Induced Bone Loss by Regulating the Nrf2/HO-1 Axis

Affiliations

Exosomes from Adipose-Derived Stem Cells Alleviate Dexamethasone-Induced Bone Loss by Regulating the Nrf2/HO-1 Axis

Xue-Wei Yao et al. Oxid Med Cell Longev. .

Abstract

The widespread use of therapeutic glucocorticoids has increased the incidences of glucocorticoid-induced osteoporosis (GIOP). Oxidative stress and mitochondrial dysfunction are major causes of GIOP; therefore, alleviation of excess oxidative stress in osteoblasts is a potential therapeutic strategy for osteoporosis. Exosomes derived from ADSCs (ADSCs-Exos), as novel cell-free therapeutics, can modulate various biological processes, such as immunomodulation, reduce oxidative damage, and promote tissue repair as well as regeneration. In this study, ADSCs-Exos restored the viability and osteogenic potential of MC3T3-E1 cells by attenuating apoptosis, oxidative damage, intracellular ROS generation, and mitochondrial dysfunction. Moreover, after pretreatment with ADSCs-Exos, Nrf2 expressions were upregulated in Dex-stimulated osteoblasts. Inhibitory assays showed that silencing Nrf2 partially eliminated the protective effects of ADSCs-Exos. The rat model assays confirmed that ADSCs-Exos alleviated the Dex-induced increase in oxidation levels, restored bone mass of the distal femur, and increased the expressions of Nrf2 and osteogenic markers in bone tissues. Thus, ADSCs-Exos alleviated apoptosis and oxidative stress by regulating Nrf2/HO-1 expressions after Dex and prevented the development of GIOP in vivo.


Conflict of interest statement

No potential conflicts of interest were disclosed.

Figures

Figure 1
Figure 1
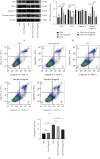
Dexamethasone inhibited survival and promoted apoptosis of MC3T3-E1 cells in a dose-dependent manner. (a) Dex reduced the viability of MC3T3-E1 cells in a dose-dependent manner as detected by CCK-8. (b) ADSCs-Exos alleviated the inhibitory effect of Dex on cell viability. (c, d) Dex downregulated the expression of Bcl-2 and upregulated Bax and cleaved caspase-3 as detected by western blot. (e) Dex dose dependently increased apoptosis as determined by flow cytometry. P < 0.05 and ∗∗P < 0.01.
Figure 2
Figure 2
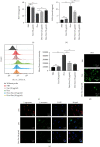
Characteristics of ADSCs and ADSCs-Exos. (a) The results of flow cytometry indicating that the isolated cells were CD31 (0.80%) and CD45 (1.24%) negative, but CD29 (99.10%) and CD90 (92.50%) positive. (b) TEM images of ADSCs-Exos. Scale bar: 100 nm. (c) The western blot results showing that HSP-70, CD63, CD81, and β-actin were expressed in ADSCs-Exos. (d) NTA results showing the particle size distribution of ADSCs-Exos (nm). (e) Images showing the uptake of ADSCs-Exos by MC3T3-E1 cells. Blue: nuclei; green: cytoskeleton; red: PKH26-labeled ADSCs-Exos. Scale bar: 20 μm.
Figure 3
Figure 3
ADSCs-Exos attenuated apoptosis of MC3T3-E1 cells following treatment with Dex. (a) The apoptosis biomarkers in MC3T3-E1 cells in each group were detected by western blot analysis. (b) Quantitative analysis of Bax, Bcl-2, and cleaved caspase-3 expression levels. (c) Flow cytometry showing that ADSCs-Exos inhibited Dex-induced apoptosis. (d) Quantification of apoptosis rate of each group. P < 0.05 and ∗∗P < 0.01.
Figure 4
Figure 4
ADSCs-Exos suppressed Dex-induced oxidative stress in MC3T3-E1 cells. (a, b) The activity of SOD and MDA in MC3T3-E1 cells after different treatments. (c) Flow cytometry analysis showing that ADSCs-Exos reversed Dex-induced intracellular ROS accumulation. (d) Representative images showing the fluorescence intensity of ROS in MC3T3-E1 cells after different treatments. (e) Representative images showing JC-1 in PBS, Dex, and Dex+ADSC-Exo groups. P < 0.05 and ∗∗P < 0.01.
Figure 5
Figure 5
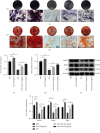
ADSCs-Exos restored the osteogenic function of MC3T3-E1 cells after treatment with Dex. (a, b) Representative images of ALP staining and ARS staining on day 7 and day 21 in MC3T3-E1 cells subjected to different treatments. (c, d) Quantitative analysis of ALP- and ARS-positive area normalized to the control group. (e, f) Expression levels of Runx2, Bmp2, and Opn in MC3T3-E1 cells subjected to different treatments. Scale bar: 100 μm. P < 0.05 and ∗∗P < 0.01.
Figure 6
Figure 6
ADSCs-Exos regulated the function of MC3T3-E1 cells via the Nrf2/HO-2 axis. (a, b) Quantitative analysis of Nrf2 and HO-1 protein expression levels in the MC3T3-E1 cells exposed to different treatments. (c) Representative images showing Nrf2 immunofluorescence. (d) Quantitative analysis of Nrf2 fluorescence intensity in the cytoplasm and nucleus. Scale bar: 20 μm. P < 0.05 and ∗∗P < 0.01.
Figure 7
Figure 7
The Nrf2/HO-1 pathway mediated the regulatory effects of ADSCs-Exos on oxidative damage induced by Dex. (a) Expression of Nrf2 proteins in cells. (b) Immunoblot showing Nrf2, HO-1, Runx2, Bmp2, and Opn expression level in the cells exposed to different treatments. (c) Immunoblotting results showing the expression level of apoptosis-related proteins in MC3T3-E1 cells exposed to different treatments. P < 0.05 and ∗∗P < 0.01.
Figure 8
Figure 8
Establishment of the GIOP model. (a) Representative micro-CT images showing the distal femur in Sham and Dex-treated rats. (b) Representative HE staining of the distal femur in Sham and Dex-treated rats. Scale bar: 400 μm. (c) The BMD, BV/TV, Tb.Th, Tb.N, and Tb.Sp values in the Sham and Dex groups. P < 0.05.
Figure 9
Figure 9
ADSCs-Exos inhibited oxidative stress and attenuated apoptosis in bone tissue after Dex. (a, b) Quantitative analysis of apoptosis-related proteins Bax, Bcl-2, and cleaved caspase-3. (c, d) Representative TUNEL staining and their quantitative analysis in the distal femur of rats. Apoptosis-positive cells were measured by TUNEL (green). Scale bar: 50 μm. P < 0.05 and ∗∗P < 0.01.
Figure 10
Figure 10
The therapeutic effect of ADSCs-Exos in the GIOP rat model. (a) Representative micro-CT reconstruction images of the distal femur of rats from the Sham, Dex, Exo (50 μg), and Exo (100 μg) groups. (b–f) Quantitative analysis of morphometric parameters of distal femoral. (g, h) Nrf2, HO-1, Runx2, Bmp2, and Opn expressions and their quantitative analysis. P < 0.05 and ∗∗P < 0.01.
Figure 11
Figure 11
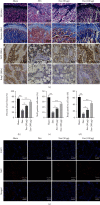
The therapeutic effect of ADSCs-Exos in GIOP rats. (a) Representative HE, Masson, and immunohistochemical staining images of Nrf2 and Bmp2. (b) Quantitative analysis of new bone formation rate in different groups. (c, d) IHC was quantified as the number of positive cells in stained tissue. (e) Representative images showing Nrf2 immunofluorescence. Scale bar: 50 μm. P < 0.05 and ∗∗P < 0.01.

References

    1. Schäcke H., Döcke W. D., Asadullah K. Mechanisms involved in the side effects of glucocorticoids. Pharmacology & Therapeutics . 2002;96(1):23–43. doi: 10.1016/s0163-7258(02)00297-8. - DOI - PubMed
    1. Spoorenberg S. M. C., Deneer V. H. M., Grutters J. C., et al. Pharmacokinetics of oral vs. intravenous dexamethasone in patients hospitalized with community-acquired pneumonia. British Journal of Clinical Pharmacology . 2014;78(1):78–83. doi: 10.1111/bcp.12295. - DOI - PMC - PubMed
    1. Kerachian M. A., Séguin C., Harvey E. J. Glucocorticoids in osteonecrosis of the femoral head: a new understanding of the mechanisms of action. The Journal of Steroid Biochemistry and Molecular Biology . 2009;114(3-5):121–128. doi: 10.1016/j.jsbmb.2009.02.007. - DOI - PMC - PubMed
    1. Komori T. Glucocorticoid signaling and bone biology. Hormone and Metabolic Research . 2016;48(11):755–763. doi: 10.1055/s-0042-110571. - DOI - PubMed
    1. Compston J. Glucocorticoid-induced osteoporosis: an update. Endocrine . 2018;61(1):7–16. doi: 10.1007/s12020-018-1588-2. - DOI - PMC - PubMed