[Preprint]. 2023 Feb 3:2023.01.29.526050.
doi: 10.1101/2023.01.29.526050.

Single-cell RNA sequencing reveals dysregulated fibroblast subclusters in prurigo nodularis

Affiliations

Single-cell RNA sequencing reveals dysregulated fibroblast subclusters in prurigo nodularis

Jay R Patel et al. bioRxiv. .

Update in

  • Single-Cell RNA Sequencing Reveals Dysregulated POSTN+WNT5A+ Fibroblast Subclusters in Prurigo Nodularis.
    Patel JR, Joel MZ, Lee KK, Kambala A, Cornman H, Oladipo O, Taylor M, Imo BU, Ma EZ, Manjunath J, Kollhoff AL, Deng J, Parthasarathy V, Cravero K, Marani M, Szeto M, Zhao R, Sankararaman S, Li R, Henry S, Pritchard T, Rebecca V, Kwatra MM, Ho WJ, Dong X, Kang S, Kwatra SG. Patel JR, et al. J Invest Dermatol. 2024 Jul;144(7):1568-1578.e5. doi: 10.1016/j.jid.2023.12.021. Epub 2024 Jan 20. J Invest Dermatol. 2024. PMID: 38246584

Abstract

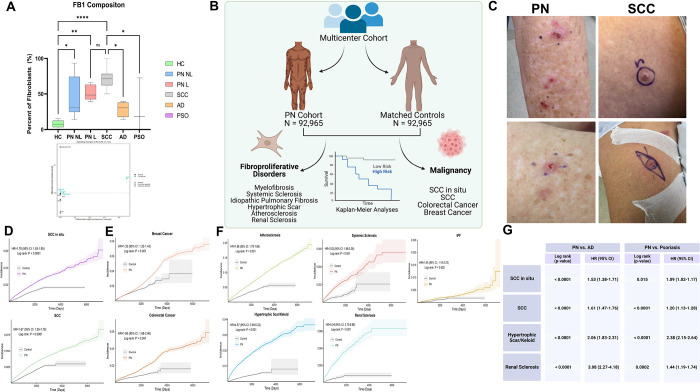
Prurigo nodularis (PN) is an intensely pruritic, chronic inflammatory skin disease that disproportionately affects black patients. However, the pathogenesis of PN is poorly understood. We performed single-cell transcriptomic profiling, ligand receptor analysis and cell trajectory analysis of 28,695 lesional and non-lesional PN skin cells to uncover disease-identifying cell compositions and genetic characteristics. We uncovered a dysregulated role for fibroblasts (FBs) and myofibroblasts as a key pathogenic element in PN, which were significantly increased in PN lesional skin. We defined seven unique subclusters of FBs in PN skin and observed a shift of PN lesional FBs towards a cancer-associated fibroblast (CAF)-like phenotype, with WNT5A+ CAFs increased in the skin of PN patients and similarly so in squamous cell carcinoma (SCC). A multicenter PN cohort study subsequently revealed an increased risk of SCC as well as additional CAF-associated malignancies in PN patients, including breast and colorectal cancers. Systemic fibroproliferative diseases were also upregulated in PN patients, including renal sclerosis and idiopathic pulmonary fibrosis. Ligand receptor analyses demonstrated increased FB1-derived WNT5A and periostin interactions with neuronal receptors MCAM and ITGAV, suggesting a fibroblast-neuronal axis in PN. Type I IFN responses in immune cells and increased angiogenesis/permeability in endothelial cells were also observed. As compared to atopic dermatitis (AD) and psoriasis (PSO) patients, increased mesenchymal dysregulation is unique to PN with an intermediate Th2/Th17 phenotype between atopic dermatitis and psoriasis. These findings identify a pathogenic role for CAFs in PN, including a novel targetable WNT5A+ fibroblast subpopulation and CAF-associated malignancies in PN patients.


Conflict of interest statement

Competing interests: Dr. Kwatra is an advisory board member/consultant for Abbvie, Aslan Pharmaceuticals, Arcutis Biotherapeutics, Celldex Therapeutics, Castle Biosciences, Galderma, Genzada Pharmaceuticals, Incyte Corporation, Johnson & Johnson, Leo Pharma, Novartis Pharmaceuticals Corporation, Pfizer, Regeneron Pharmaceuticals, and Sanofi and has served as an investigator for Galderma, Incyte, Pfizer, and Sanofi.

Figures

Fig. 1.
Fig. 1.. Single cell RNA landscape of Prurigo Nodularis.
a, Representative patient photographs showing prurigo nodularis lesional (L) and adjacent non-lesional (NL) skin biopsied for downstream processing. b, Overview of scRNAseq study design demonstrating sample collection of PN L and NL skin followed by barcoding, RNA sequencing, and data analysis of single cell transcriptomics to identify cell types. Further characterization of PN performed using disease comparisons of existing scRNAseq databases. c, UMAP of PN cells by L and NL Type on the left with cells organized by sample on the right. d, Clusters 0–21 identified using the Louvain algorithm on the left with annotated clusters on the right. e, Heatmap of clusters 0–21 identifying top differentially expressed genes in each cluster. f, Dotplot of representative genes for each cell type cluster annotated. g, UMAP feature plot of representative genes corresponding to cell type annotation. h, Stacked barplot of the proportion of each cell type in each sample. i, UMAP of annotated subclusters identified on top with stacked barplot showing proportions of subclusters in each sample. j, Hierarchically clustered correlation matrices of cell types across all samples with original clusters on the left and subclusters on the right.
Fig. 2.
Fig. 2.. Differential single cell landscape of lesional vs non-lesional PN skin.
a, UMAP plots of L and NL PN skin with major clusters on top and subclusters on the bottom. b, Pseudobulk RNAseq using single cell data identifies distinct L and NL transcriptomes as displayed by the heatmap. Top 20 differentially expressed genes between L and NL PN skin shown below. c, Compositional analysis of cell clusters showing differential cell loading coefficients of fibroblasts in L compared to NL skin. d, Hierarchical representation of compositional changes in L and NL skin. e, cluster free compositional changes based on subtraction (top) and wilcox testing (bottom, with significant z adjusted scores in red/blue). f, Expression differences calculated using normalized expression distance between L and NL skin for all cell clusters. g, Gene ontology heatmaps of top 50 pathways upregulated or downregulated in PN L vs NL skin.
Fig. 3.
Fig. 3.. scRNAseq identifies cancer-associated fibroblast shifts in lesional compared to non-lesional PN skin.
a, UMAP of fibroblasts FB1-FB7, separated by L and NL on the right. b, Stacked barplot showing differential composition of fibroblasts in L and NL PN (left). Statistical analysis via Mann Whitney test with * p<0.05. Barplot of L vs NL fibroblast subpopulations revealing trends for increased FB1 in L and increased FB7 in NL. c, Immunofluorescence imaging of L and NL PN skin revealing increased colocalization of WNT5A and Vimentin (FB1) cells using Manders colocalization coefficient in L PN and increased SFRP2/TNC expression in L and NL PN skin. Representative immunofluorescence images shown below. Statistical analysis via Mann Whitney test, ** p<0.01. d, Dotplot of representative genes identifying fibroblast subclusters. e, Split violin plots displaying differentially expressed genes in L vs NL fibroblast subclusters. All asterisks aside represent multiple t tests at a sample level using mean cellular expression, with *p<0.5 and ** p<0.01. f, Boxplot showing increased mFB composition in L compared to NL skin. Statistical analysis via Mann Whitney test with ** p<0.01. g, Dotplot of representative genes identifying subclusters (PC1, PC2, and mFB) split from the PC group. h, Feature Plots of PC1, PC2, and mFB revealing increased expression of genes POSTN, ISG15, IFI27, and CPXM1 in L cells compared to NL cells. i, Hierarchically clustered correlation matrix of FB1 (left) and mFB (right) revealing separation of L and NL skin. j, Immunofluorescence staining of L PN skin demonstrating overlap of sMA (red) and vimentin (green) with nuclei stained using DAPI (blue), highlighting high burden of mFB (yellow) in PN.
Fig. 4.
Fig. 4.. Single cell differences in lesional PN immune, endothelial, and neural populations.
a, Dotplot of representative genes highlighting myeloid subclusters cDC2A, cDC2B, cDC2C, Mac1, and Mac2. b, UMAP of myeloid lineage (left), further split into L and NL (right). c, Heatmap of L vs NL Mac2 and cDC2A subclusters highlighting increased type I interferon genes in L populations. d, Dotplot of representative genes highlighting NKT cell subclusters of Tun, CD4T, CD8T, CD4Trm, and NKT. e, UMAP of NKT major cluster (left), further split into L and NL (right). f, Split violin plots displaying increased expression in L PN skin of GNLY in CD8T cells and ISG15/TIGIT/CTLA4 in CD4Trm. g, Dotplot of differentially expressed angiogenesis related genes in endothelium and lymphatic endothelium. h, Violin plots of angiogenesis score showing increased expression in L skin. i, Feature plot displaying increased TAFA5 expression in neural lineage cells in L skin. j, Dotplot of DEGs in L Mast cells. All comparisons between NL and L gene expression at a cellular level represent p<0.05 using wilcoxon rank sum test. All asterisks represent multiple t tests at a sample level using mean cellular expression, with *p<0.5 and ** p<0.01.
Fig. 5.
Fig. 5.. Ligand Receptor analysis of lesional and non lesional PN.
a, Split barplots of information flow in L and NL PN revealing increased activity of periostin and wnt5a in L PN skin. b, Heatmaps of overall signaling patterns in NL (top) and L (bottom) PN c, Outgoing (secretion) pathway analysis of ligand receptors in L PN skin. Cell patterns and communication patterns defined using k means clustering. Flow charts display cell group and pathway contribution to cellular and pathway patterns. d, Circle plot of periostin pathway in L PN demonstrating FB activity. e, Heatmap of periostin pathway in L PN demonstrating FB activity (top). Heatmap of sender, receiver, mediator, and influencer categories demonstrating FB1 predominance in periostin signaling (middle). Confirmatory immunofluorescence staining of L PN demonstrating increased POSTN compared to HC (red) surrounding vimentin (green) with nuclei stained with DAPI (blue), (bottom). f, Violin plots of POSTN ligand and receptors ITGAV + ITGB5 showing expression of ligands in FB populations with ITGAV highest in neurons. IF showing colocalization of B-III tubulin (red) and ITGAV (green) in L PN skin (yellow) g, Circle plots and heatmaps of ncWNT pathway in L (top) and NL (bottom) PN, showing FB1 dominance in L skin. h, L characterization of ncWNT ligands and receptors MCAM, FZD1, FZD4, and FZD7 with highest contribution being WNT5A + MCAM in L skin (top). Violin plots of WNT5A and receptors showing high expression of ligands in FB1 with MCAM in PC, SMC, mFB, and Neurons (middle). Heatmap of sender, receiver, mediator, and influencer categories demonstrating for L WNT5A signaling (bottom). i, NL characterization of ncWNT ligands and receptors, FZD1 and FZD4 with highest contribution being WNT11 + FZD4 in NL skin (top). Violin plots of WNT11 and receptors (middle). Heatmap of sender, receiver, mediator, and influencer categories demonstrating for NL WNT11 signaling (bottom). j, IF imaging revealing colocalization of B-III tubulin (red) with MCAM(green) in PN L skin (yellow).
Fig. 6.
Fig. 6.. Trajectory analysis via RNA velocity and pseudotime reveals separate fibroblast differentiation patterns with distinct transcriptome progression in lesional subsets.
a, RNA velocity fields projected onto UMAP. The streamlines indicate the directions of cell differentiation as inferred from RNA velocity estimations. b, Velocity pseudotime, derived from RNA velocity, is visualized in UMAP. c, RNA velocity-PAGA graph. Arrows representing direction of cells’ flow of PAGA-velocity were projected onto UMAP d, Computed fated map for the fibroblast lineage with absorption probabilities representing how likely each cell is to develop toward a fibroblast terminal state. Cell clusters included in the fibroblast lineage are PC, KC, SMC, and FB. e, Top lineage driver genes for the fibroblast lineage are plotted. f, Gene expression trends are plotted along separate lineages (END, FB, Mast, NKT, Neuron, SMC, cDC). Each lineage is defined via its lineage weights computed via CellRank. g, Pseudotime trajectory visualized in reduced dimensional space colored by cell type (top left), separated by cell type (top right), colored by pseudotime (bottom left), colored by cell state (bottom right). h, Heatmap of different blocks of DEGs along the pseudotime trajectory for FB, PC, mFB, KC. i, Plotting of gene expression in FB1 cells for select genes over pseudotime.
Fig. 7.
Fig. 7.. Single cell comparison of PN across AD and PSO identifies mesenchymal dominance and a mixed Th2/Th17 phenotype.
a, UMAP of integrated cells across HC, NL, L, AD, and PSO samples colored by Type (top) and sample (bottom). b, UMAP of cells split per condition colored based on louvian clusters (top), annotated clusters (middle), and annotated subclusters (bottom). c, Stacked barplot of major clusters per sample(left), stacked barplot of average major clusters per condition (middle), and barplot of major clusters per condition. d, Stacked barplot of subclusters per sample (left), stacked barplot of average subclusters per condition (right). e, Array of stacked bar plots per sample, average stacked bar plots, and UMAPs for each major subcluster highlighting differences in subclusters within the super cluster. f, Dotplot displaying fibroblast subcluster defining genes using the integrated dataset, showing consistency between FB1, FB2, FB3, FB5, and FB7 with the PN cohort (left) Barplot displaying differential fibroblast composition across conditions, with FB1 increased in PN and FB3 increased in AD (right). Statistical analysis by ANOVA corrected with Tukey post hoc test with *p<0.05, ** p<0.01, ***p<0.001. g, Molecular classification of resident memory cells in PN L samples using RashX algorithm identifies PN as intermediate between AD and PSO Th2/Th17 expression profiles.
Fig. 8.
Fig. 8.. Multicenter cohort epidemiologic data analysis of diseases associated with CAF in PN reveals increased risk for SCC and fibroproliferative disease.
a, FB1 composition across H, NL, L, SCC, AD, and PSO samples reveals increased FB1 across PN and SCC compared to HC, AD, and PSO. Statistical analysis by ANOVA corrected with Tukey post hoc test with *p<0.05, ** p<0.01, ***p<0.001 b, Overview graphic of multicenter cohort study comparing PN fibroblast associated malignancy and fibroproliferative disease compared to matched controls c, Representative images of SCC and PN nodules within the same patient d, Kaplan Meier curves showing increased SCC and SCCis risk for PN compared to matched HCs. e, Kaplan Meier curves showing increased risk for cancers reported with CAFs (breast and colorectal) in PN compared to matched HCs f, Kaplan Meier curves showing increased risk for fibroproliferative disease and atherosclerosis in PN compared to matched HCs g, Table of hazard ratios demonstrating increased risk of SCCis, SCC, hypertrophic/keloid scars, and renal sclerosis in PN compared to AD/PSO

References

    1. Kwatra S.G. Breaking the Itch-Scratch Cycle in Prurigo Nodularis. N Engl J Med 382, 757–758 (2020). - PubMed
    1. Whang K.A., et al. Health-related quality of life and economic burden of prurigo nodularis. Journal of the American Academy of Dermatology 86, 573–580 (2022). - PubMed
    1. Huang A.H., Canner J.K., Khanna R., Kang S. & Kwatra S.G. Real-world prevalence of prurigo nodularis and burden of associated diseases. Journal of Investigative Dermatology 140, 480–483. e484 (2020). - PubMed
    1. Whang K.A., Kang S. & Kwatra S.G. Inpatient Burden of Prurigo Nodularis in the United States. Medicines (Basel) 6(2019). - PMC - PubMed
    1. Sutaria N., et al. Racial differences in dysregulation of the renin-angiotensin-aldosterone system in patients with prurigo nodularis. Journal of Dermatological Science 105, 130–136 (2022). - PubMed

Publication types