[Preprint]. 2023 Jan 31:2023.01.31.526492.
doi: 10.1101/2023.01.31.526492.

Tubular Mitochondrial Pyruvate Carrier Disruption Elicits Redox Adaptations that Protect from Acute Kidney Injury

Affiliations

Tubular Mitochondrial Pyruvate Carrier Disruption Elicits Redox Adaptations that Protect from Acute Kidney Injury

Adam J Rauckhorst et al. bioRxiv. .

Update in

Abstract

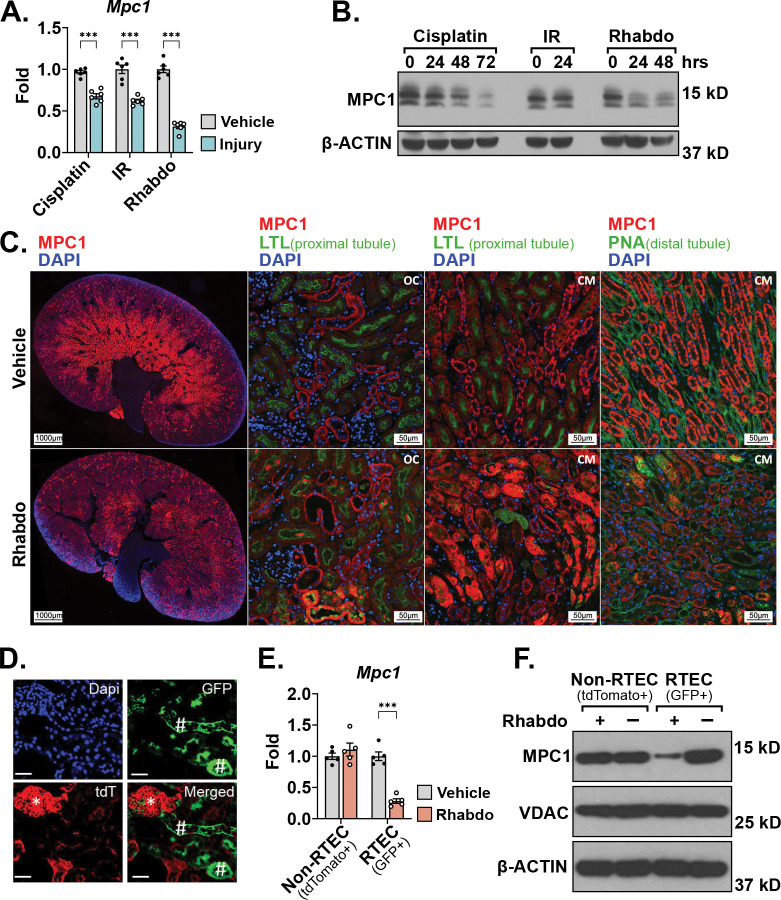
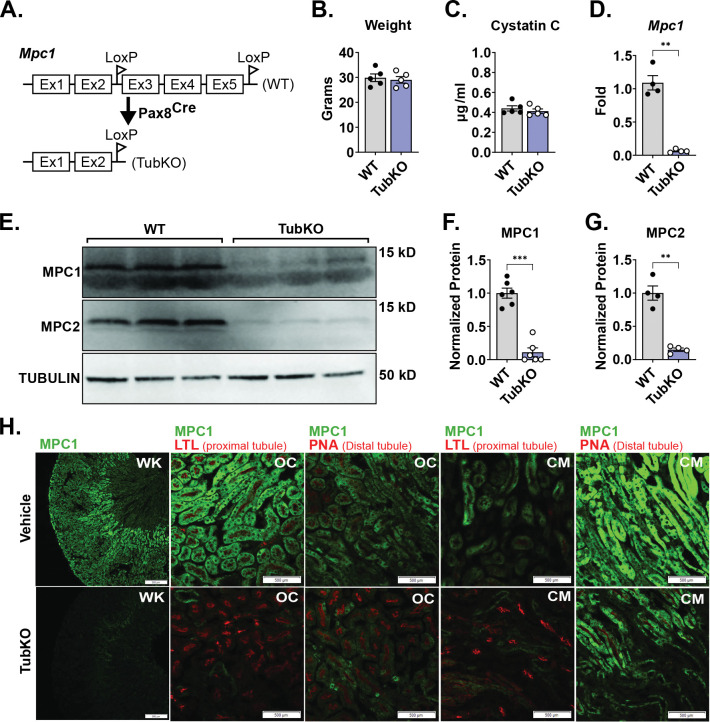
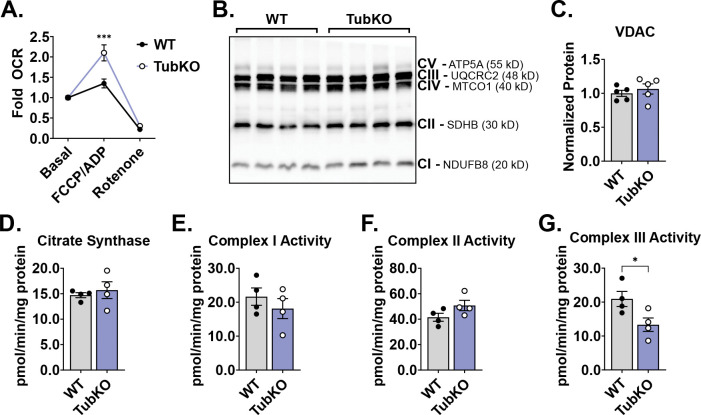
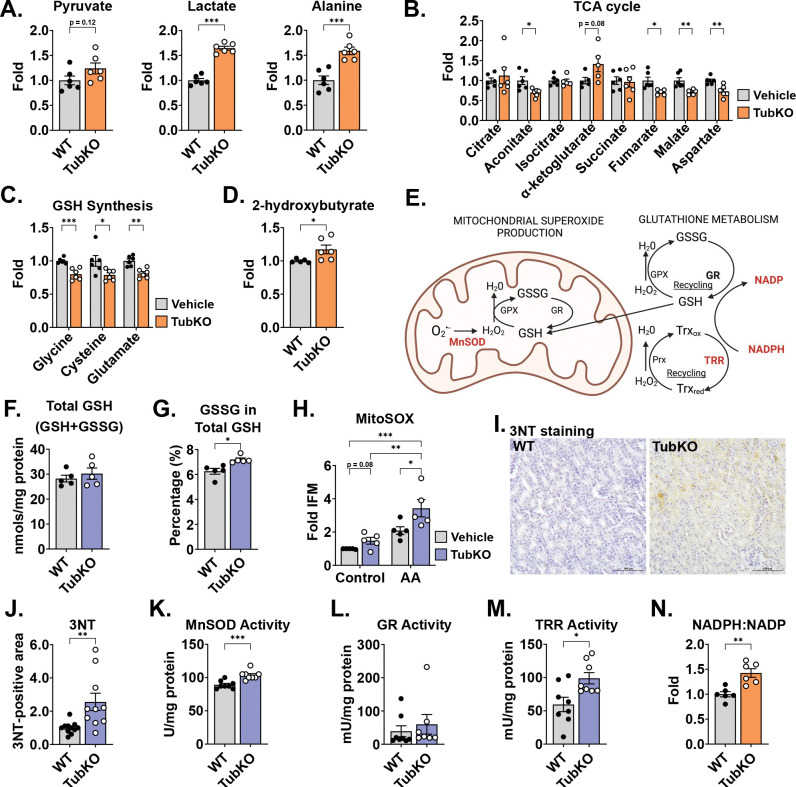
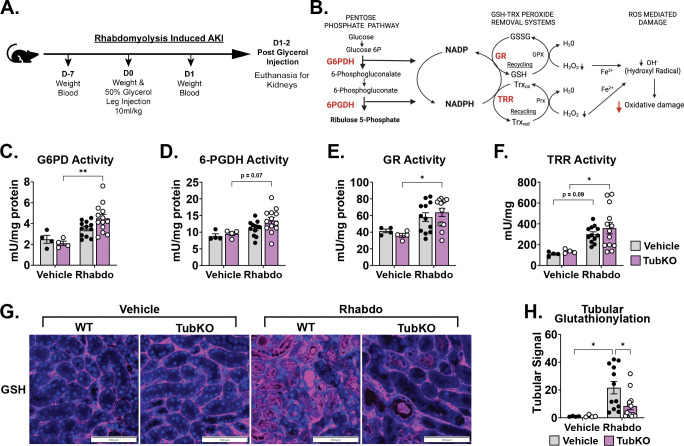
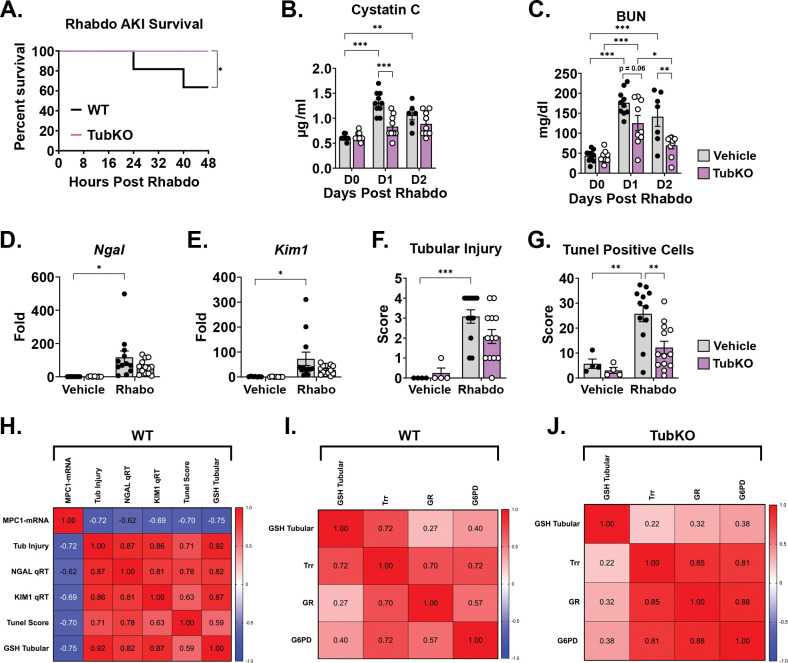
Energy-intensive kidney reabsorption processes essential for normal whole-body function are maintained by tubular epithelial cell metabolism. Tubular metabolism changes markedly following acute kidney injury (AKI), but which changes are adaptive versus maladaptive remain poorly understood. In publicly available data sets, we noticed a consistent downregulation of the mitochondrial pyruvate carrier (MPC) after AKI, which we experimentally confirmed. To test the functional consequences of MPC downregulation, we generated novel tubular epithelial cell-specific Mpc1 knockout (MPC TubKO) mice. 13C-glucose tracing, steady-state metabolomic profiling, and enzymatic activity assays revealed that MPC TubKO coordinately increased activities of the pentose phosphate pathway and the glutathione and thioredoxin oxidant defense systems. Following rhabdomyolysis-induced AKI, MPC TubKO decreased markers of kidney injury and oxidative damage and strikingly increased survival. Our findings suggest that decreased mitochondrial pyruvate uptake is a central adaptive response following AKI and raise the possibility of therapeutically modulating the MPC to attenuate AKI severity.

Keywords: acute kidney injury; metabolomics; mitochondrial metabolism; oxidative damage.


Conflict of interest statement

COMPETING INTERESTS The authors declare no competing interests.

Figures

FIGURE 1.
FIGURE 1.. Mpc1 is downregulated in tubular epithelial cells during acute kidney injury.
(A) Bar graph comparing kidney Mpc1 mRNA levels after vehicle treatment or cisplatin-, ischemia reperfusion (IR)-, and rhabdomyolysis (Rhabdo)-induced AKIs. Samples were collected 72 hours after cisplatin injury and 24 hours after IR and rhabdomyolysis injuries. (n = 6/group; *** p < 0.001 by unpaired t test with Welch’s correction). (B) Representative Western blot of kidney MPC1 protein abundance after AKI. Samples were collected 72 hours after cisplatin injury and 24 hours after IR and rhabdomyolysis injuries. β-ACTIN was blotted as a loading control. (C) Representative immunostaining images of MPC1 (red), lotus tetragonolobus lectin (LTL, green, proximal tubule marker), or peanut agglutinin (PNA, green, distal tubule marker), and DAPI (blue) in whole kidney, outer cortex (OC) and cortico-medullary junction (CM) kidney sections 30 hours following vehicle treatment or rhabdomyolysis-induced AKI. (Images captured at 15x magnification; whole kidney scale bar = 1,000 μm; OC and CM scale bar = 50 μm). (D) Representative fluorescence image of kidney sections of mT/mG/Ggt1-Cre mice confirming GFP+ renal tubular epithelial cells (green, #, GFP) and tdTomato+ non-RTEC cells (red, *, tdT) stained with Dapi (blue). (Scale bar = 100 μm). (E) Bar graph comparing Mpc1 mRNA levels in flow-sorted Non-RTEC (tdTomato+) and RTEC (GFP+) cells 24 hour after vehicle treatment or rhadbomyolysis-induced AKI. (n = 5/group, ***p < 0.001 by unpaired t test with Welch’s correction). (F) Representative Western blot of MPC1 and VDAC protein abundance in flow-sorted Non-RTEC (tdTomato+) and RTEC (GFP+) cells 24 hour after AKI. β-ACTIN was blotted as a loading control. Data are presented as means ± SEM.
FIGURE 2.
FIGURE 2.. Generation and basic characterization of MPC TubKO mice.
(A) Schematic illustrating the generation of tubular Mpc1 null allele, MPC TubKO mice (TubKO). (B-C) Bar graphs showing body weights (B) and serum cystatin C concentration (C) in WT and MPC TubKO mice. (n = 5/group, 8-week-old mice). (D) Bar graph comparing mouse kidney Mpc1 mRNA levels in WT and MPC TubKO mice. (n = 4/group, 7 – 12-week-old mice, ** p < 0.01 by unpaired t test with Welch’s correction). (E-G) Representative Western blot of kidney MPC1 and MPC2 protein abundance (E) and quantification of normalized MPC1 (F) and MPC2 (G) levels in WT and MPC TubKO mice. Tubulin was blotted as loading control and used as the protein quantification normalizer. (n = 4 – 6/group, 7 – 12-week-old mice, *** p < 0.001 and ** p < 0.01 by by unpaired t test with Welch’s correction). (H) Representative immunostaining images of kidney MPC1 (green) and lotus tetragonolobus lectin (LTL, green, proximal tubule marker) or peanut agglutinin (PNA, green, distal tubule marker) in whole kidney (WK), outer-cortex (OC), and cortico-medullary junction (CM) in WT and MPC TubKO mice. (Images taken at 4x (WK) or 20x (OC and CM) magnification, scale bar = 500 μm). Data are presented as means ± SEM.
FIGURE 3.
FIGURE 3.. MPC TubKO mice have altered mitochondrial function.
(A)Line graph showing the relative glutamate-fueled oxygen consumption rate (OCR) under basal (no addition), maximal FCCP/ADP-stimulated, and rotenone-inhibition conditions in kidney mitochondria isolated from WT and MPC TubKO mice. (n = 6/group, 8 – 12-week-old mice, *** p < 0.001 by two-way ANOVA with Tukey’s multiple comparison test). (B) Representative Western blot of kidney ETC marker Complex I (CI), NDUFB8; Complex II (CII), SDHB; Complex III (CIII), UQCRC2; Complex IV (CIV), MTCO1; and Complex V (CV), ATP5A protein abundances in WT and MPC TubKO mice. (n = 4/group, 6 – 8-week-old mice). (C)Bar graph comparing the quantified VDAC protein level in WT and MPC TubKO mice. (n = 5/group, 6 – 8-week-old mice) (D) Bar graph showing the whole-kidney citrate synthase enzymatic activity in WT and MPC TubKO mice. (n = 4/group, 6-week-old mice). (E-G) Bar graphs comparing the whole-kidney enzymatic activities of Complex I (E), Complex II (F), and Complex III (G) in WT and MPC TubKO mice. (n = 4/group, 6-week-old mice, * p < 0.05 by unpaired t test with Welch’s correction). Data are presented as means ± SEM.
FIGURE 4.
FIGURE 4.. MPC TubKO mice have mitochondrial redox adaptation
(A-D) Bar graphs showing kidney metabolite levels in WT and MPC TubKO mice. Pyruvate, lactate, and alanine (A), TCA cycle metabolites (B), the GSH synthesis substrates glycine, cysteine, and glutamate (C), and 2-hydroxybutyrate, a marker of GSH turnover (D). (n = 6/group, 8 – 12-week-old mice, * p < 0.05, ** p < 0.01, and *** p < 0.001 by unpaired t test with Welch’s correction). (E) Schematic illustrating mitochondrial antioxidant defense system including MnSOD, manganese superoxide dismutase; GSH, glutathione; GSSG, oxidized glutathione; Gpx, glutathione peroxidase; GR, glutathione reductase; Prx, peroxiredoxin; Trx, thioredoxin reductase; Trxred, reduced thioredoxin; and Trxox, and oxidized thioredoxin. (F-G). Bar graphs comparing kidney total GSH (GSH + GSSG) (F) and the % of GSSG of total GSH (GSH + GSSG) (G) in WT and MPC TubKO mice. (n = 5/group, 12 – 14-week-old mice, * p < 0.05 by unpaired t test with Welch’s correction). (H) Bar graph showing MitoSOX oxidation in the presence and absence of antimycin A (AA) of isolated WT and MPC TubKO tubular epithelial cell. (n = 5/group, 12-week-old mice, * p < 0.05, ** p < 0.01, *** p < 0.001 by two-way ANOVA with Tukey’s multiple comparison test). (I) Representative immunohistochemistry images of kidney 3NT staining in WT and MPC TubKO mice. (Images taken at 40x magnification, scale bar = 100 μm). (J) Bar graph comparing kidney 3NT quantification in WT and MPC TubKO mice. (n = 8 – 11, 12 – 14-week-old mice, ** p < 0.01 by unpaired t test with Welch’s correction). (K-M) Bar graphs showing kidney enzyme activities of MnSOD (K), GR (L), and TRR (M) in WT and MPC TubKO mice. (n = 7 – 8/group, 12 – 14-week-old mice, * p < 0.05 and *** p < 0.001 by unpaired t test with Welch’s correction). (N) Bar graph comparing the kidney NADPH:NADP ratio in WT and MPC TubKO mice. (n = 6/group, 8 – 12-week-old mice, ** p < 0.01 by unpaired t test with Welch’s correction). Data are presented as means ± SEM.
FIGURE 5.
FIGURE 5.. 13C-glucose tracing shows increased distal PPP activity in MPC TubKO mice
(A) Schematics illustrating pentose phosphate pathway (PPP) (top) and 13C-enrichment patterns into glycolysis, the PPP, and the TCA cycle from 13C-glucose (bottom). MPC, mitochondrial pyruvate carrier; PDH, pyruvate dehydrogenase; PC, pyruvate carboxylase; OAA, oxaloacetate. (B-D) Stacked bar graphs showing kidney 13C-isotopologue enrichments into PPP metabolites 30 minutes after 13C-glucose bolus injection in WT and MPC TubKO mice. Glucose 6-phosphate (B), 6-phosphogluconate (C), and ribo/ribulose 5-phosphate (D). (n = 7/group, 7 – 8-week-old mice, * p < 0.05 and ** p < 0.01 by unpaired t test). (E-G) Stacked bar graphs showing kidney 13C-isotopologue enrichments and bar graphs comparing relative abundances of metabolites 30 minutes after 13C-glucose bolus injection in WT and MPC TubKO mice. Fructose 6-phosphate (E), pyruvate (F), and acetyl-CoA (G). (n = 7/group, 7 – 8-week-old mice, * p < 0.05 and ** p < 0.01 by unpaired t test). (H-K) Stacked bar graphs showing kidney 13C-isotopologue enrichments into TCA cycle metabolites 30 minutes after 13C-glucose bolus injection in WT and MPC TubKO mice. Citrate (H), Fumarate (I), Malate (J), and Aspartate as a surrogate measure of oxaloacetate (K). (n = 7/group, 7 – 8-week-old mice, * p < 0.05 and ** p < 0.01 by unpaired t test). Data are presented as means ± SEM.
FIGURE 6.
FIGURE 6.. Downregulation of tubular Mpc1 is an early adaptive response to protect from oxidative damage
(A-B) Schematics illustrating the time course of the rhabdomyolysis-induced AKI model (A) and the interconnectedness of the pentose pathway and cellular antioxidant defense systems (B). (C-F) Bar graphs showing kidney enzyme activities following vehicle treatment or rhabdomyolysis (Rhabdo)-induced AKI. Glucose-6-phosphate dehydrogenase (C, G6PD), 6-phosphogluconate dehydrogenase (D, 6PGDH), glutathione reductase (E, GR), and thioredoxin reductase (F, TRR). (n = 4/group for vehicle treatment, n = 12 – 13/group for Rhabdo, 8 – 12-week-old mice, * p < 0.05 and ** p < 0.01 by two-way ANOVA with Tukey’s multiple comparison test). (F) Representative immunostaining images of kidney protein-glutathionylation (pink) and Dapi (blue) following vehicle treatment or rhabdomyolysis-induced AKI in WT and MPC TubKO mice. (Scale bar = 100 μm, n = 4/group for vehicle treatment, n = 12 – 13/group for Rhabdo, 8 – 12-week-old mice). (G) Bar graph showing quantified kidney protein-glutathionylation following vehicle treatment or rhabdomyolysis-induced AKI in WT and MPC TubKO mice. (n = 4/group for vehicle treatment, n = 12 – 13/group for Rhabdo, 8 – 12-week-old mice, * p < 0.05 by two-way ANOVA with Tukey’s multiple comparison test). Data presented as means ± SEM
FIGURE 7.
FIGURE 7.. Tubular MPC1 genetic deletion protects from rhabdomyolysis induced kidney injury.
(A) Line graph showing the survival curve of WT and MPC TubKO mice following rhabdomyolysis (Rhabdo)-induced AKI. (n = 10 – 11/group, 8 – 12-week-old mice, * p < 0.05 by Mantel-Cox log-rank test). (B-C) Bar graphs showing serum cystatin C (C), and blood urea nitrogen (D, BUN) levels prior to (D0) and on day 1 (D1, 24-hours) and day 2 (D2, 48 hours) after vehicle treatment or rhabdomyolysis-induced AKI in WT and MPC TubKO mice. (n = 10 – 11/group, 8 – 12-week-old mice, * p< 0.05, ** p < 0.01, *** p < 0.001 by two-way ANOVA followed by Turkey’s multiple comparison tests). (E-F) Bar graphs showing kidney Ngal (D) and Kim1 (E) mRNA levels one day (24 hours) after vehicle treatment or rhabdomyolysis-induced AKI in WT and MPC TubKO mice. (n = 4/group for vehicle treatment, n = 12 – 13/group for Rhabdo, 8 – 12-week-old mice, * p < 0.05 by two-way ANOVA with Tukey’s multiple comparison test). (G-H) Bar graphs showing quantification of histologically assessed tubular injury score (F) and tunel positive tubular cells (G) one day (24 hours) after vehicle treatment or rhabdomyolysis-induced AKI in WT and MPC TubKO mice. (n = 4/group for vehicle treatment, n = 12 – 13/group for Rhabdo, 8 – 12-week-old mice, ** p < 0.01 and *** p < 0.001 by two-way ANOVA with Tukey’s multiple comparison test). (H-J) Heatmaps showing Spearman correlation between variables analyzed following vehicle treatment or rhabdomyolysis-induced AKI. Correlation calculated in WT mice comparing Mpc1 mRNA levels, tubular injury, Ngal and Kim1 mRNA levels, tunel score, and tubular GSH with AKI (H). Spearman correlation performed in WT (I) and MPC TubKO (J) mice comparing GSH and antioxidant defense system markers following rhabdomyolysis-induced AKI. Data are presented as means ± SEM.

References

    1. Chawla LS, Bellomo R, Bihorac A, Goldstein SL, Siew ED, Bagshaw SM, et al. Acute kidney disease and renal recovery: consensus report of the Acute Disease Quality Initiative (ADQI) 16 Workgroup. Nat Rev Nephrol. 2017;13(4):241–57. - PubMed
    1. Chertow GM, Burdick E, Honour M, Bonventre JV, and Bates DW. Acute kidney injury, mortality, length of stay, and costs in hospitalized patients. J Am Soc Nephrol. 2005;16(11):3365–70. - PubMed
    1. Coca SG, Singanamala S, and Parikh CR. Chronic kidney disease after acute kidney injury: a systematic review and meta-analysis. Kidney Int. 2012;81(5):442–8. - PMC - PubMed
    1. Goldstein SL, Jaber BL, Faubel S, Chawla LS, and Acute Kidney Injury Advisory Group of American Society of N. AKI transition of care: a potential opportunity to detect and prevent CKD. Clin J Am Soc Nephrol. 2013;8(3):476–83. - PubMed
    1. Bhargava P, and Schnellmann RG. Mitochondrial energetics in the kidney. Nat Rev Nephrol. 2017;13(10):629–46. - PMC - PubMed

Publication types