[Preprint]. 2023 Feb 4:2023.02.03.527019.
doi: 10.1101/2023.02.03.527019.

Using single-cell RNA sequencing to generate cell-type-specific split-GAL4 reagents throughout development

Affiliations

Using single-cell RNA sequencing to generate cell-type-specific split-GAL4 reagents throughout development

Yu-Chieh David Chen et al. bioRxiv. .

Update in

Abstract

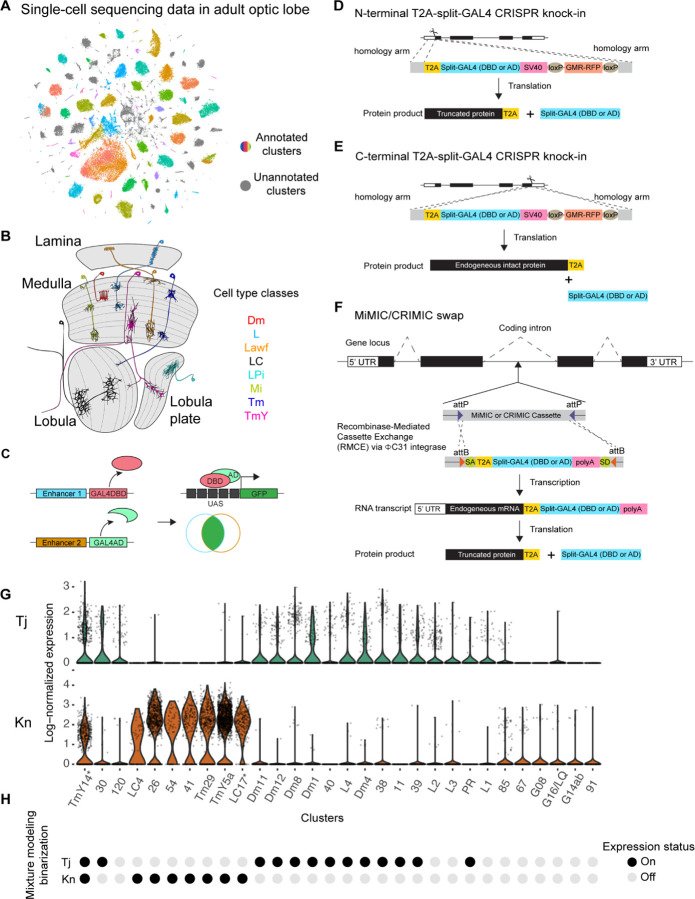
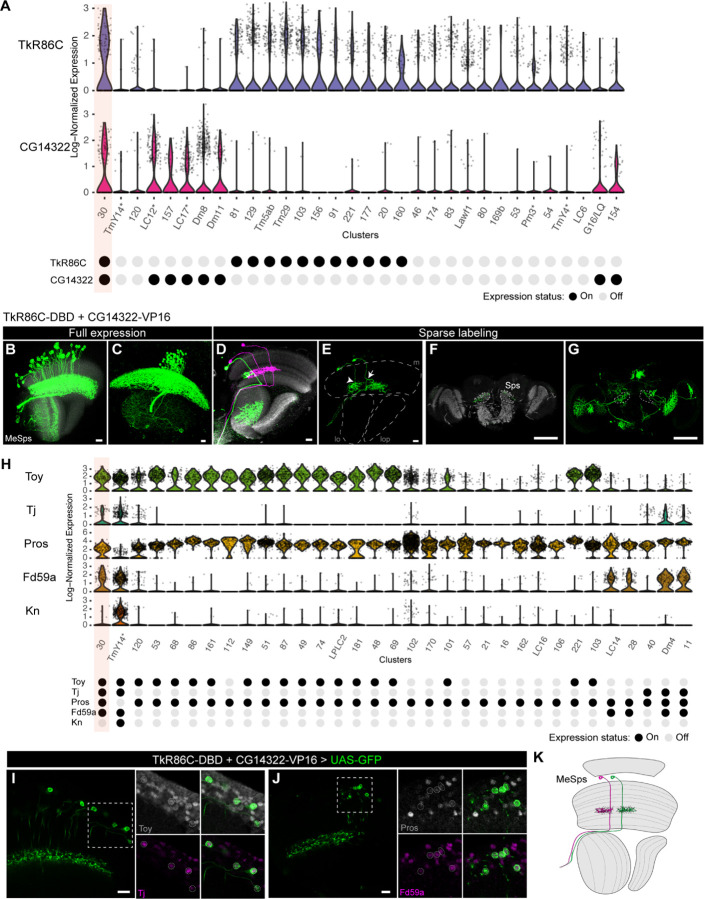
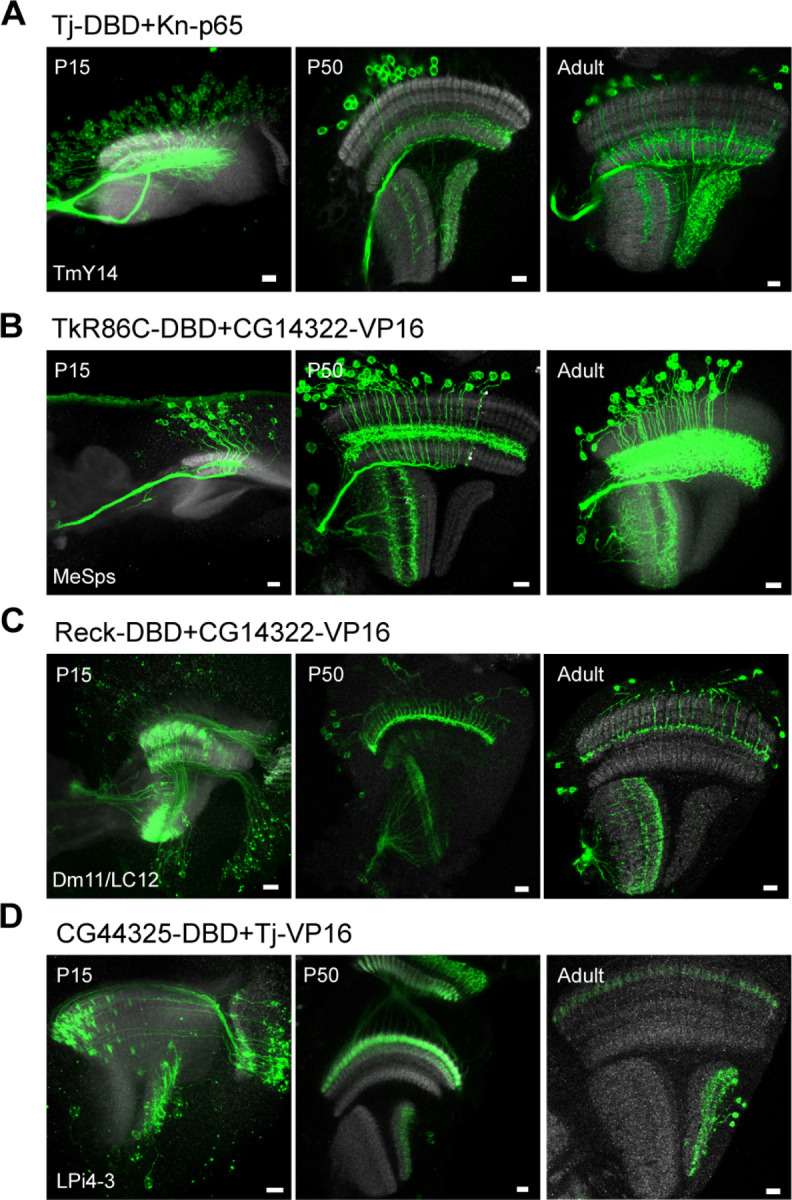
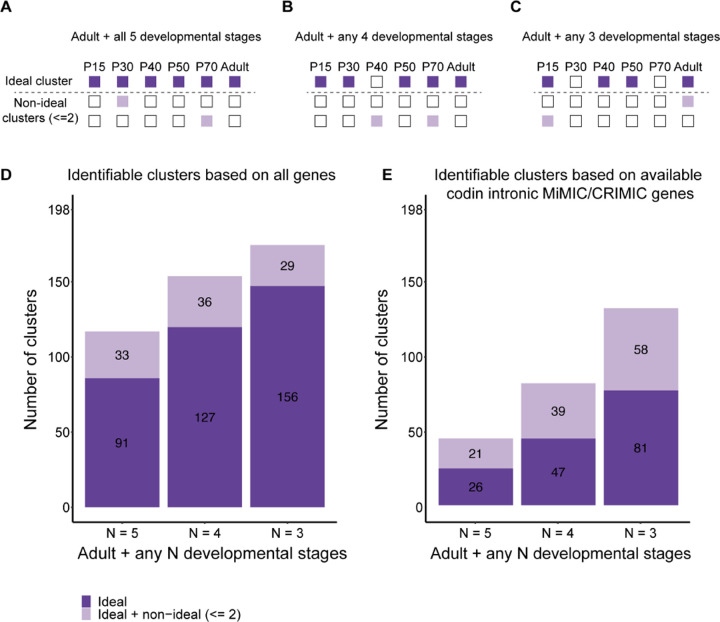
Cell-type-specific tools facilitate the identification and functional characterization of distinct cell types, which underly the complexity of neuronal circuits. A large collection of existing genetic tools in Drosophila relies on enhancer activity to label different subsets of cells. These enhancer-based GAL4 lines often fail to show a predicable expression pattern to reflect the expression of nearby gene(s), partly due to an incomplete capture of the full gene regulatory elements. While genetic intersectional technique such as the split-GAL4 system further improve cell-type-specificity, it requires significant time and resource to generate and screen through combinations of enhancer expression patterns. In addition, since existing enhancer-based split-GAL4 lines that show cell-type-specific labeling in adult are not necessarily active nor specific in early development, there is a relative lack of tools for the study of neural development. Here, we use an existing single-cell RNA sequencing (scRNAseq) dataset to select gene pairs and provide an efficient pipeline to generate cell-type-specific split-GAL4 lines based on the native genetic regulatory elements. These gene-specific split-GAL4 lines can be generated from a large collection of coding intronic MiMIC/CRIMIC lines either by embryo injection or in vivo cassette swapping crosses and/or CRISPR knock-in at the N or C terminal of the gene. We use the developing Drosophila visual system as a model to demonstrate the high prediction power of scRNAseq-guided gene specific split-GAL4 lines in targeting known cell types. The toolkit allows efficient cluster annotation in scRNAseq datasets but also the identification of novel cell types. Lastly, the gene-specific split-GAL4 lines are broadly applicable to Drosophila tissues. Our work opens new avenues for generating cell-type-specific tools for the targeted manipulation of distinct cell types throughout development and represents a valuable resource to the fly research community.

Significance statement: Understanding the functional role of individual cell types in the nervous systems has remained a major challenge for neuroscience researchers, partly due to incomplete identification and characterization of underlying cell types. To study the development of individual cell types and their functional roles in health and disease, experimental access to a specific cell type is often a prerequisite. Here, we establish an experimental pipeline to generate gene-specific split-GAL4 guided by single-cell RNA sequencing datasets. These lines show high accuracy for labeling targeted cell types from early developmental stages to adulthood and can be applied to any tissues in Drosophila. The collection of gene-speicifc-split-GAL4 will provide a valuable resource to the entire fly research community.


Figures

Fig. 1.
Fig. 1.
(A) t-SNE plot of the scRNAseq dataset of the adult Drosophila optic lobe. Clusters in gray represent unannotated clusters. Clusters with other colors are annotated in previous study (15). (B) Schematic diagram of the Drosophila visual system with representative cell types in several major classes. There are four main neuropils in the optic lobe: lamina, medulla, lobula, and lobula plate. Distal medulla (Dm), lamina (L), lamina wide-field (Lawf), lobula columnar (LC), Lobula Plate intrinsic (LPi), medullar intrinsic (Mi), transmedullary (Tm), transmedullary Y (TmY). (C) Schematic diagram of the split-GAL4 system. GAL4 can be split into GAL4 DNA-binding domain (GAL4DBD) and activation domain (AD). Labeling specificity is further restricted when GAL4DB and AD are under the control of two different enhancers and only the cells with both enhancers active have a functional reconstituted GAL4 for driving reporter gene expression. (D-F) Schematic diagram of the gene-specific split-GAL4 generation. Gene-specific split-GAL4 lines can be generated either through N- (D) or C-terminal T2A-split-GAL4 knock-in (E), or through Recombinase-mediated cassette exchange (RMCE) of T2A-split-GAL4 elements from the large existing collection of MiMIC/CRIMIC lines (F). The expression of a split-GAL4 reporter depends on the native gene regulatory network and is expected to recapitulate the endogenous transcript expression detected in the scRNAseq dataset. (G) Log-normalized expression of Tj (top) and Kn (bottom) for different clutters. (H) Binarization of gene expression by mixture modeling (15, 20). A probability (ON) score ranging from 0 to 1 is assigned to each cluster: 0 indicates no expression while 1 indicates strong expression. We set the probability score of 0.5 as an expression threshold and classified every gene in every cluster as either ON or OFF. Note that it is practically challenging to define whether a given gene is expressed in each cluster. For example, Tj showed similar expression level between cluster 39 and L2, yet, cluster 39 but not L2 is predicted to express Tj based on mixture modeling binarization.
Fig. 2.
Fig. 2.
Characterization of selected gene-specific split-GAL4 lines targeting different cell types/clusters. Targeted cell types predicted by scRNAseq expression are shown in the lower left corner for each split-GAL4 line. The expression pattern of each split-GAL4 line is shown either with UAS-myr-GFP reporter for full expression (right) or with UAS-MCFO lines for sparse labeling (right). (A-E) Examples of split-GAL4 lines targeting single cell types. (F-G) Example of split-GAL4 lines targeting two cell types. (H-I) Examples of split-GAL4 lines targeting unannotated cell types in the scRNAseq dataset. Anti-NCad staining (gray) is used for visualizing neuropils. Images are substack projections from full expression labeling or segmented single cells from sparse labeling to show distinct morphological features of distinct cell types. Scale bar: 10 µm.
Fig. 3.
Fig. 3.
(A) Log-normalized expression of TkR86C and CG14322 for different clutters (Top). Mixture modeling binarization of expression status for both genes is shown at the bottom. Note that cluster 30 is predicted to be the only cluster intersected by TkR86C and CG14322. (B-C) The full expression pattern of TkR86C-DBD + CG14322-VP16 line is shown with UAS-myr-GFP reporter. Note that there is an additional cell type in the lobula with only 2–3 cells labeled. The cell bodies of MeSps neurons are restricted to the medulla cortex. (D-E) Sparse labeling of MeSps neurons using MCFO. The bifurcation of neurites at M7 layer can be bidirectional (arrowhead to the anterior projection; arrow to the posterior projection). m: medulla; lo: lobula; lop: lobula plate. Scale bar: 10 m. (F-G) Sparse labeling of MeSps neurons using MCFO show their projection to the superior posterior slope (Sps). Single optical section (F) or substack maximum projections (G) are shown. Scale bar: 100 m. Anti-NCad staining (gray) is used for visualizing neuropils. (H) Log-normalized expression of selected transcription factors (Toy, Tj, Pros, Fd59a, and Kn) (Top). Mixture modeling binarization of expression status for selected genes are shown at the bottom. Note that cluster 30 is predicted to be the only cluster positive for Toy, Tj, Pros, and Fd59a. Kn is used to serve as a negative marker for cluster 30. (I-J) Co-staining of MeSps neurons labeled by TkR86C-DBD and CG14322-VP16 with anti-Toy (Gray) and anti-Tj (Magenta) in I and anti-Pros (Gray) and anti-Fd59a (Magenta) in J. MeSps neurons expressing GFP reporter are outlined in dotted circles. Scale bar: 10 µm. (K) Schematic diagram of MeSps neurons, a novel type of medulla projection neurons.
Fig. 4.
Fig. 4.
Developmental characterization of selected gene-specific split-GAL4 lines targeting different cell types/clusters. Targeted cell types predicted by scRNAseq expression are shown in the lower left corner for each split-GAL4 line. The full expression pattern of each split-GAL4 line is shown with UAS-myr-GFP reporter at P15, P50, and adult stages. Note that the targeted cell types are always observed at multiple developmental stages, although other cell types might be observed. Anti-NCad staining (gray) is used for visualizing neuropils. Images are substack projections from full expression labeling to show distinct morphological features of distinct cell types. Scale bar: 10 µm.
Fig. 5.
Fig. 5.
(A-C) Illustration of strategies to identify gene pairs that mark a cluster of interest throughout development with different stringency. Dark violet boxes indicate the stages when a gene pair is predicted to be on in the cluster of interest while light violet boxes indicate when the gene pair is predicted to be active in other clusters. (D) Number of clusters that are predicted to be identified with gene pairs suggested by each strategy when all genes detected in the atlas are considered. (E) Number of clusters that are predicted to be identified with gene pairs suggested by each strategy when only considering genes with coding intronic MiMIC or CRIMIC lines available for recombinase-mediated cassette exchange (3637 genes).
Fig. 6.
Fig. 6.
(A) Schematic diagram showing T2A-split-GAL4 triple donor cassette. The cassette is modified from T2A-GAL4 triple donor (Diao et al., 2015) by replacing T2A-GAL4 with T2A-GAL4DBD or T2A-VP16AD. Split-GAL4 donors with three different splicing phases (phase 0, 1, and 2) are flanked by attB sequences and lox sequences variants. Supplement of Cre recombinase and C31 integrase will allow integration of T2A-split-GAL4 into targeted MiMIC insertion. (B) Gene structure annotation of bru1 (encoded in a + orientation) from JBrowse using D. melanogaster (r6.49) reference (24). Phase 1 coding intronic MiMIC insertion (MI00135) is highlighted by an arrowhead. (C) Summary table of in vivo swapping by triple T2A-split-GAL4 donor. The genetic crossing scheme is shown in SI Appendix, Fig. S4.

References

    1. Brand AH, Perrimon N, Targeted gene expression as a means of altering cell fates and generating dominant phenotypes. Dev. (Cambridge, England: ) 118, 401–415 (1993). - PubMed
    1. Lai SL, Lee T, Genetic mosaic with dual binary transcriptional systems in drosophila. Nat. Neurosci. 9, 703–709 (2006). - PubMed
    1. Potter CJ, Tasic B, Russler EV, Liang L, Luo L, The q system: a repressible binary system for transgene expression, lineage tracing, and mosaic analysis. Cell 141, 536–548 (2010). - PMC - PubMed
    1. A Jenett, et al., A GAL4-driver line resource for drosophila neurobiology. Cell Reports 2, 991–1001 (2012). - PMC - PubMed
    1. Kvon EZ, et al., Genome-scale functional characterization of drosophila developmental enhancers in vivo. Nature 512, 91–95 (2014). - PubMed

Publication types