[Preprint]. 2023 Feb 2:2023.02.01.23285339.
doi: 10.1101/2023.02.01.23285339.

Population mobility and the development of Botswana's generalized HIV epidemic: a network analysis

Affiliations

Population mobility and the development of Botswana's generalized HIV epidemic: a network analysis

Janet Song et al. medRxiv. .

Update in

Abstract

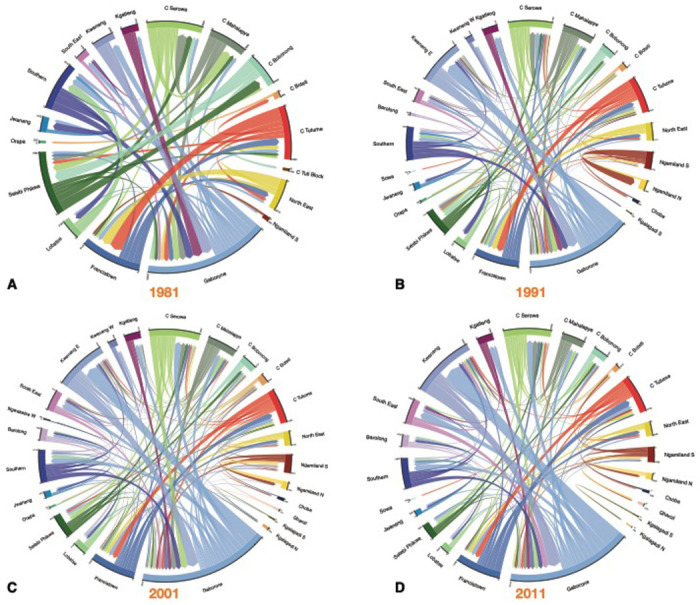
The majority of people with HIV live in sub-Saharan Africa, where HIV epidemics are generalized. For these epidemics to develop, populations need to be mobile. However, population-level mobility has not yet been studied in the context of the development of generalized HIV epidemics. Here we do so by studying historical migration data from Botswana which has one of the most severe generalized HIV epidemics worldwide; in 2021, HIV prevalence was 21%. The country reported its first AIDS case in 1985 when it began to rapidly urbanize. We hypothesize that, during the development of Botswana's epidemic, the population was highly mobile and there were substantial urban-to-rural and rural-to-urban migratory flows. We test this hypothesis by conducting a network analysis using a historical time series (1981 to 2011) of micro-census data from Botswana. We found 10% of the population moved their residency annually, complex migration networks connected urban with rural areas, and there were very high rates of rural-to-urban migration. Notably, we also found mining towns were both important in-flow and out-flow migration hubs; consequently, there was a very high turnover of residents in towns. Our results support our hypothesis, and together, provide one explanation for the development of Botswana's generalized epidemic.


Conflict of interest statement

Competing interests: All authors declare that they have no competing interests.

Figures

Figure 1:
Figure 1:. Gender-stratified age profiles of internal migrants by census year.
(A) 1981, (B) 1991, (C) 2001, and (D) 2011.
Figure 2:
Figure 2:. Chord diagrams by census year.
(A) 1981, (B) 1991, (C) 2001, and (D) 2011. Each diagram shows the internal migration network of the general population in the 12 months prior to the census. Each color represents a different administrative district. The thickness of each line is proportional to the number of migrants that moved between the two connected districts. The angular width of each district is proportional to the total number of migrants who moved into, or out of, that district. For clarity, in (A)-(C) only connections with greater than 200 migrants are shown, and in (D) only connections with greater than 400 migrants are shown. Consequently, some districts are not shown in the chord diagram. The total number of migrants (in and out) of every district is listed in Tables 1–4.
Figure 3:
Figure 3:. The top five out-flow and in-flow migration hubs by census year.
(A) Top out-flow hubs in 1981, (B) Top in-flow hubs in 1981, (C) Top out-flow hubs in 1991, (D) Top in-flow hubs in 1991, (E) Top out-flow hubs in 2001, (F) Top in-flow hubs in 2001, (G) Top out-flow hubs in 2011, (H) Top in-flow hubs in 2011. Out-flow hubs are sorted by the rate per hundred residents of a district’s population that moves out to another district; in-flow hubs are sorted by the rate per hundred residents of a district’s population that moves in from another district.
Figure 4:
Figure 4:. Ego network of Jwaneng.
The chord diagrams show migrants flowing (A) out of, and (B) into, the diamond mining town in 1981.
Figure 5:
Figure 5:. Schemata of urban/rural classification framework by census year.
(A) 1981, (B) 1991, (C) 2001, and (D) 2011. Circles represent the five classes based on an urban/rural classification (see Methods). The radius of each circle is proportional to the number of residents living in the districts in that specific class. The color of each arrow indicates the size of the net migration between classes. The class designation (city, town, predominantly urban, partially urban, predominantly rural) of each district over time is provided in Tables 1–4.
Figure 6:
Figure 6:. Sankey diagrams showing urban/rural classification framework by census year.
(A) 1981, (B) 1991, (C) 2001, and (D) 2011. The diagrams show the relative magnitude of migratory flows between the different classes over time. Cities are shown in purple, towns in blue, predominantly urban districts in gold, partially urban districts in magenta, and predominantly rural districts in green. The class designation (city, town, predominantly urban, partially urban, predominantly rural) of each district over time is provided in Tables 1–4.

References

    1. African Natural Resources Center. (2016). Debswana Diamond Company and the Government of Botswana: an HIV/AIDS public-private partnership programme. https://www.afdb.org/fileadmin/uploads/afdb/Documents/Publications/anrc/... [Accessed October 17, 2022].
    1. Barnett T., Fantan T., Mbakile B., & Whiteside A. (2002). The private sector responds to the epidemic: Debswana–a global benchmark. Geneva, Switzerland: UNAIDS.
    1. Bell M., Blake M., Boyle P., Duke-Williams O., Rees P., Stillwell J., & Hugo G. (2002). Cross-national comparison of internal migration: Issues and measures. Journal of the Royal Statistical Society: Series A (Statistics in Society), 165(3), 435–464.
    1. Camlin C. S., & Charlebois E. D. (2019). Mobility and its effects on HIV acquisition and treatment engagement: Recent theoretical and empirical advances. Current HIV/AIDS Reports, 16(4), 314–323. doi:10.1007/s11904-019-00457-2 - DOI - PMC - PubMed
    1. CSO Botswana, & NACA. (2009). 2008 Botswana AIDS Impact Survey III: Statistical Report. https://microdata.statsbots.org.bw/index.php/catalog/13/download/77 [Accessed October 12, 2022].

Publication types