

This is a preprint.
Subnational HIV incidence trends in Malawi: large, heterogeneous declines across space
- PMID: 36778346
- PMCID: PMC9915821
- DOI: 10.1101/2023.02.02.23285334
Subnational HIV incidence trends in Malawi: large, heterogeneous declines across space
Abstract
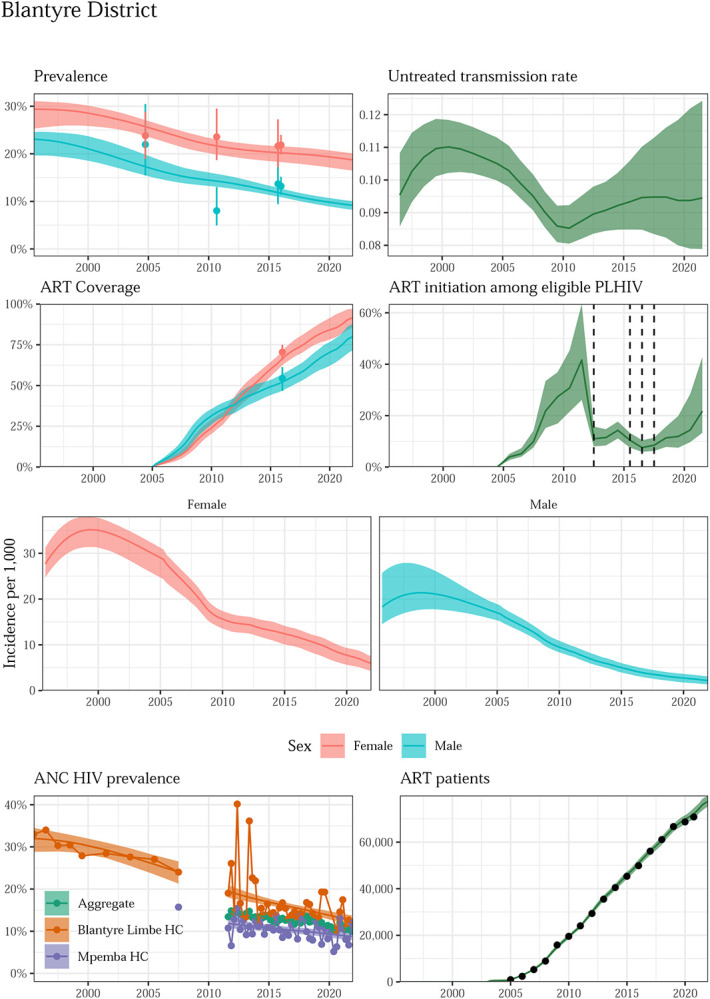
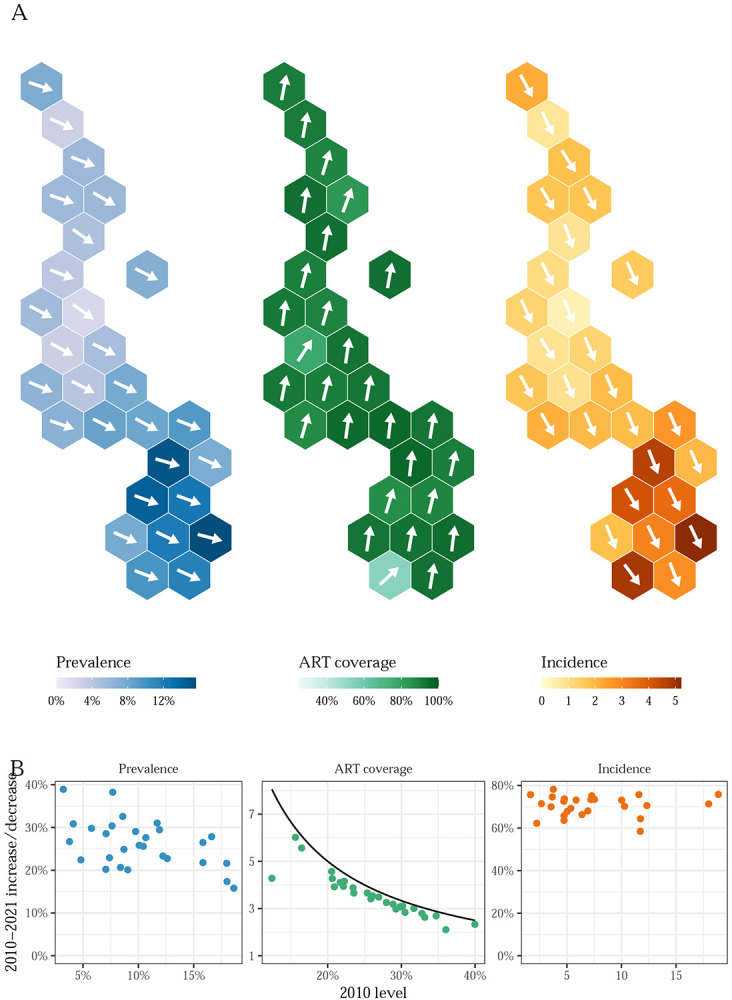
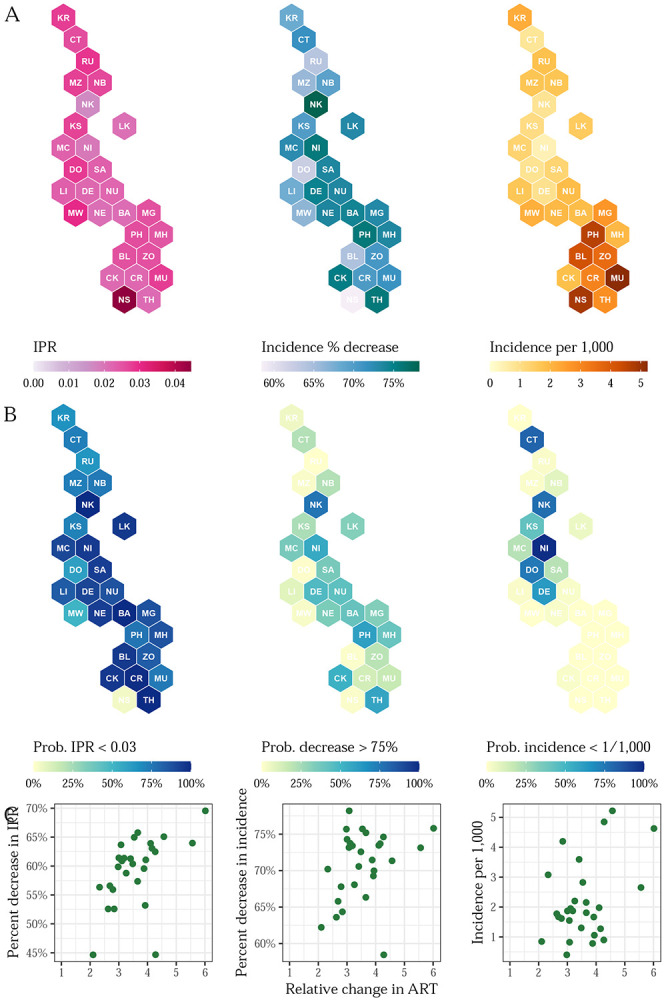
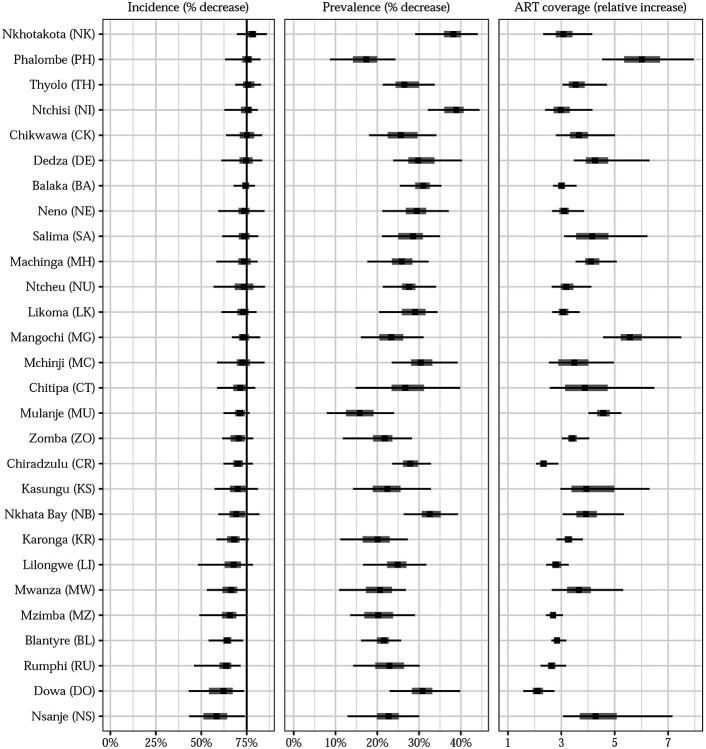
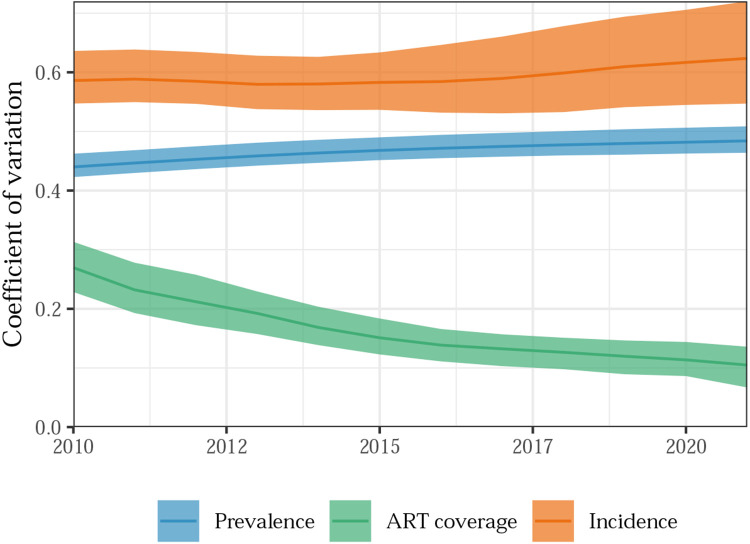
The rate of new HIV infections globally has decreased substantially from its peak in the late 1990s, but the epidemic persists and remains highest in many countries in eastern and southern Africa. Previous research hypothesised that, as the epidemic recedes, it will become increasingly concentrated among sub-populations and geographic areas where transmission is the highest and that are least effectively reached by treatment and prevention services. However, empirical data on subnational HIV incidence trends is sparse, and the local transmission rates in the context of effective treatment scale-up are unknown. In this work, we developed a novel Bayesian spatio-temporal epidemic model to estimate adult HIV prevalence, incidence and treatment coverage at the district level in Malawi from 2010 through the end of 2021. We found that HIV incidence decreased in every district of Malawi between 2010 and 2021 but the rate of decline varied by area. National-level treatment coverage more than tripled between 2010 and 2021 and more than doubled in every district. Large increases in treatment coverage were associated with declines in HIV transmission, with 12 districts having incidence-prevalence ratios of 0.03 or less (a previously suggested threshold for epidemic control). Across districts, incidence varied more than HIV prevalence and ART coverage, suggesting that the epidemic is becoming increasingly spatially concentrated. Our results highlight the success of the Malawi HIV treatment programme over the past decade, with large improvements in treatment coverage leading to commensurate declines in incidence. More broadly, we demonstrate the utility of spatially resolved HIV modelling in generalized epidemic settings. By estimating temporal changes in key epidemic indicators at a relatively fine spatial resolution, we were able to directly assess, for the first time, whether the ART scaleup in Malawi resulted in spatial gaps or hotspots. Regular use of this type of analysis will allow HIV program managers to monitor the equity of their treatment and prevention programmes and their subnational progress towards epidemic control.
Figures
References
-
- UNAIDS. Global HIV & AIDS statistics — fact sheet. https://www.unaids.org/en/resources/fact-sheet (2021).
-
- Low-Beer D. & Stoneburner R. L. Behaviour and communication change in reducing HIV: Is Uganda unique? Afr J AIDS Res 2, 9–21 (2003). - PubMed
-
- UNAIDS. AIDSinfo ∣ UNAIDS. AIDSinfo. https://aidsinfo.unaids.org/ (2020).
-
- Johnson L. F. et al. The effect of HIV programs in south africa on national HIV incidence trends, 2000–2019. JAIDS Journal of Acquired Immune Deficiency Syndromes 90, 115 (2022). - PubMed
-
- Over M. Achieving an AIDS transition: Preventing infections to sustain treatment. (Brookings Institution Press, 2012).
Publication types
Grants and funding
LinkOut - more resources
Full Text Sources
Miscellaneous