[Preprint]. 2023 Jan 30:rs.3.rs-2511441.
doi: 10.21203/rs.3.rs-2511441/v1.

Lung infection by P. aeruginosa induces neuroinflammation and blood-brain barrier dysfunction in mice

Affiliations

Lung infection by P. aeruginosa induces neuroinflammation and blood-brain barrier dysfunction in mice

Nuria Villalba et al. Res Sq. .

Update in

Abstract

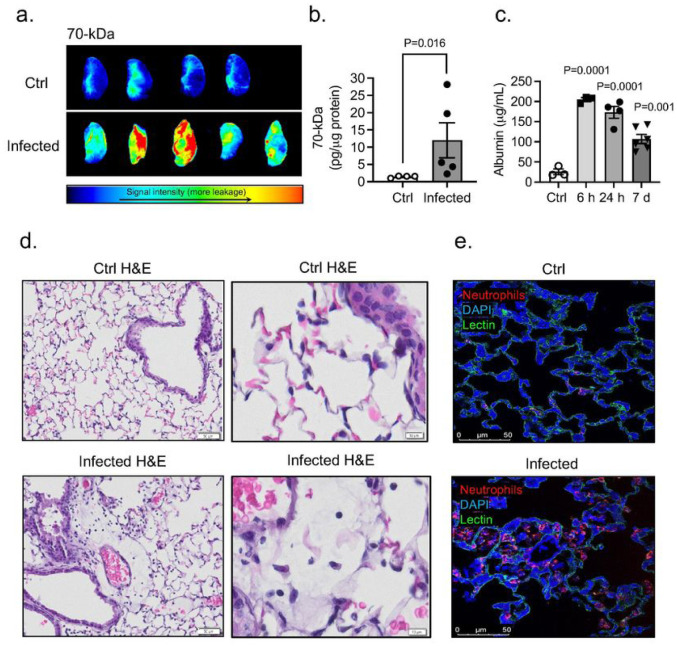
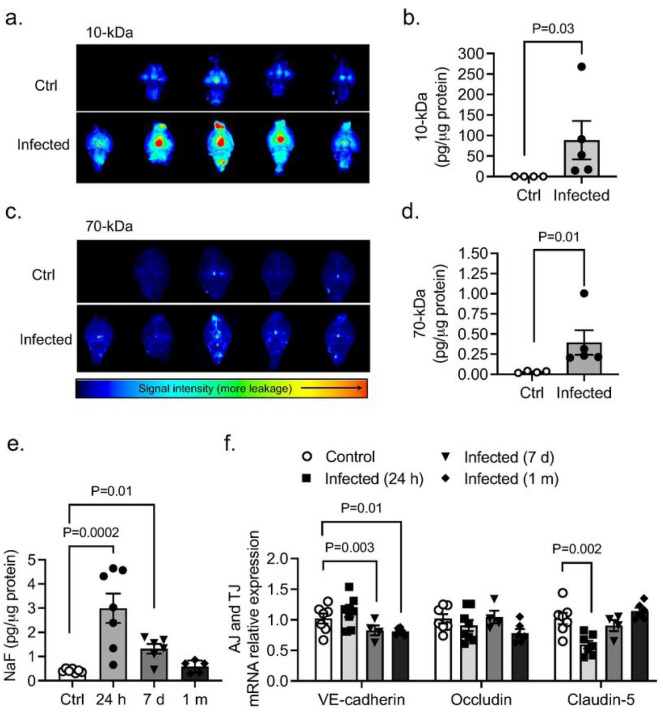
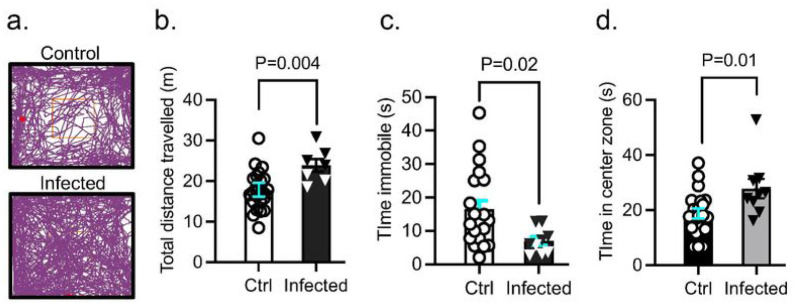
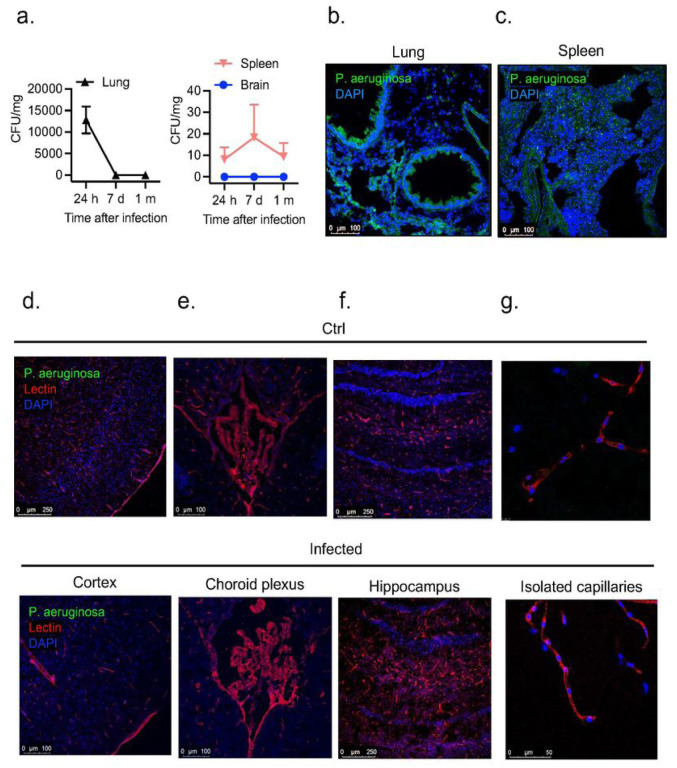
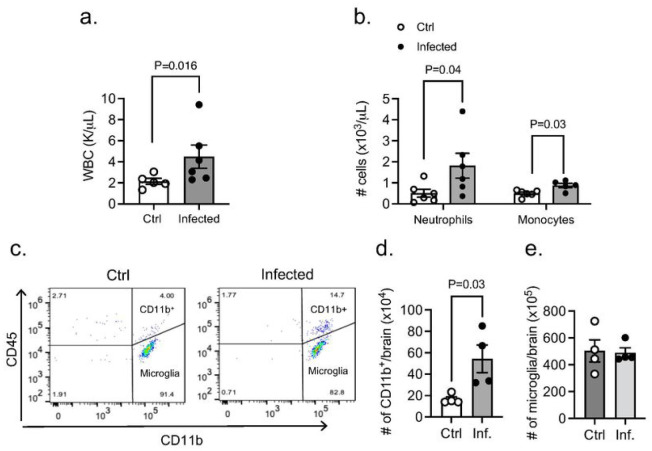
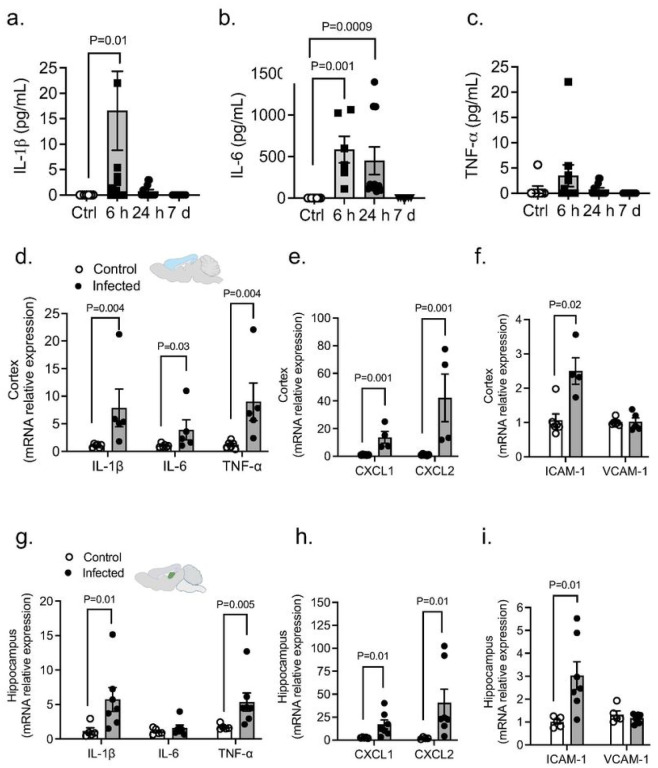
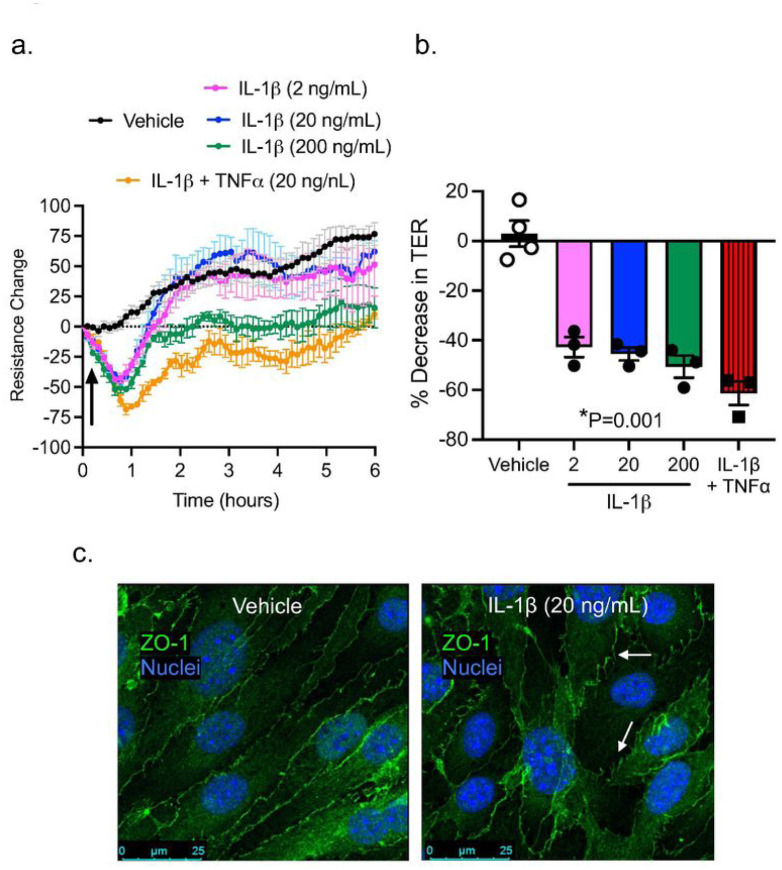
Background Severe lung infection can lead to brain dysfunction and neurobehavioral disorders. The mechanisms that regulate the lung-brain axis of inflammatory response to respiratory infection are incompletely understood. This study examined the effects of lung infection causing systemic and neuroinflammation as a potential mechanism contributing to blood-brain barrier (BBB) leakage and behavioral impairment. Methods Pneumonia was induced in adult C57BL/6 mice by intratracheal inoculation of Pseudomonas aeruginosa (PA). Solute extravasation, histology, immunofluorescence, RT-PCR, multiphoton imaging and neurological testing were performed in this study. Results Lung infection caused alveolar-capillary barrier injury as indicated by leakage of plasma proteins across pulmonary microvessels and histopathological characteristics of pulmonary edema (alveolar wall thickening, microvessel congestion, and neutrophil infiltration). PA also caused significant BBB dysfunction characterized by leakage of different sized molecules across cerebral microvessels and a decreased expression of cell-cell junctions (VE-cadherin, claudin-5) in the brain. BBB leakage peaked at 24 hours and lasted for 7 days post-inoculation. Additionally, mice with lung infection displayed hyperlocomotion and anxiety-like behaviors. To test whether cerebral dysfunction was caused by PA directly or indirectly, we measured bacterial load in multiple organs. While PA loads were detected in the lungs up to 7 days post-inoculation, bacteria were not detected in the brain as evidenced by negative cerebral spinal fluid (CSF) cultures and lack of distribution in different brain regions or isolated cerebral microvessels. However, mice with PA lung infection demonstrated increased mRNA expression in the brain of pro-inflammatory cytokines (IL-1β, IL-6, and TNF-α), chemokines (CXCL-1, CXCL-2) and adhesion molecules (VCAM-1 and ICAM-1) along with CD11b + cell recruitment, corresponding to their increased blood levels of white cells (polymorphonuclear cells) and cytokines. To confirm the direct effect of cytokines on endothelial permeability, we measured cell-cell adhesive barrier resistance and junction morphology in mouse brain microvascular endothelial cell monolayers, where administration of IL-1β induced a significant reduction of barrier function coupled with tight junction (TJ) diffusion and disorganization. Combined treatment with IL-1β and TNFα augmented the barrier injury. Conclusions These results suggest that lung bacterial infection causes cerebral microvascular leakage and neuroinflammation via a mechanism involving cytokine-induced BBB injury.


Conflict of interest statement

Competing interests

The authors declare that they have no competing interests

Figures

Figure 1
Figure 1. Effects of PA pneumonia on lung inflammation.
(a) Representative NIR fluorescence images of the left lung lobe obtained from control and PA infected mice (OD600 0.3) showing the distribution of 70-kDa tracer within the tissue. (b) Summary data showing lung permeability of 70-kDa tracer. Mann-Whitney test, P=0.016 vs. control (uninfected) group. (c) Plasma leakage indicated by increased levels albumin in bronchoalveolar lavage fluid (BALF). Kruskal-Wallis test, P=0.0001, P=0.001 vs. control (uninfected) group. (d) Histological analysis by conventional H&E staining of lung sections in control and PA infected mice (OD600 0.3). (e) Serial lung sections obtained from control and PA-infected mice immunostained for neutrophils (red). Lectin (green) staining was used to visualized blood vessels and DAPI (blue) for nuclei. In all graphs, each point indicates data from an individual animal, bar graphs (columns and error bars) show mean ± S.E.M.
Figure 2
Figure 2. Effects of PA lung infection on BBB permeability and TJ expression.
Representative NIR fluorescence images of whole brains obtained from control and PA infected mice (OD600 0.3) showing the distribution of (a) 10-kDa and (c) 70-kDa tracers within the tissue. (b,d) Summary data showing BBB paracellular permeability of 10-kDa and 10-kDa fluorescence tracers. Mann-Whitney test, P<0.05 vs. control (uninfected) group. (e) Time course of BBB permeability changes to small size solutes as measured by NaFl uptake starting at 24 h post-infection to 1-month post-infection (OD600 0.3). Kruskal-Wallis test, P=0.01 and P=0.0002 vs. control (uninfected) group. (f) Summary data showing mRNA expression levels of VE-cadherin, occludin and claudin-5 in brains harvested from control and PA infected mice at 24 hours, 7 days and 1 month after infection. Kruskal-Wallis test, P=0.01 and P=0.003 and P=0.002 vs. control (uninfected) group. In all graphs, each point indicates data from an individual animal, bar graphs (columns and error bars) show mean ± S.E.M.
Figure 3
Figure 3. Effect of PA pneumonia on mouse behavior.
(a) Representative tracks of control and PA-infected mice (OD600 0.3) recorded by ANYMaze® video system during the open field test. (b) Total distance traveled by control and PA-infected mice. (c) Time mice remained immobile in the open field. (d) Time spent in the center of the open field by controls and PA-infected mice. Mann-Whitney test, P=0.004, P=0.02, P=0.01 vs. control (uninfected) group. In all graphs, each point indicates data from an individual animal, bar graphs (columns and error bars) show mean ± S.E.M. In all graphs, each point indicates data from an individual animal, bar graphs (columns and error bars) show mean ± S.E.M.
Figure 4
Figure 4. PA load in peripheral organs and brain regions.
(a) Bacterial growth (CFUs per mg of tissue) in lung, spleen and in brain (CSF) obtained from infected animals (OD600 0.3) and controls after intratracheal administration of PA. (b) Representative confocal micrograph showing (b) lung and (c) spleen sections obtained from GFP-labelled PA infected animals (OD600 0.3) and controls. PA is labelled in green and nuclei (DAPI) in blue. (d-g) Representative confocal micrographs of (d) cortical sections, (e) choroid plexus (f) hippocampus and (g) isolated capillaries showing the lack of distribution of PA (GFP-labelled PA) in the brain of infected mice and controls. Lectin (red) was used to label the blood vessels and DAPI (blue) for the nuclei.
Figure 5
Figure 5. Appearance of leukocytes in CNS during PA-induced lung infection.
(a) White blood counts in control and PA-infected animals (OD600 0.3). Mann-Whitney test, P=0.016 vs. control (uninfected) group. (b) Neutrophil and monocyte counts in blood obtained from control and PA-infected mice (OD600 0.3) measured by ProCyte One hematology analyzer. Mann-Whitney test, P=0.04, P=0.03 vs. control (uninfected) group. (c) Flow cytometry analysis of brain tissue homogenates labeled with anti-CD45 and anti-CD11 b antibodies with gating on CD45+ cells. Quantitative analyses of (d) CD11 b+ immune cell subpopulations and (e) microglia in control and PA infected mice. Mann-Whitney test, P=0.03 vs. control (uninfected) group. In all graphs, each point indicates data from an individual animal, bar graphs (columns and error bars) show mean ± S.E.M.
Figure 6
Figure 6. PA lung infection causes systemic and neuroinflammation.
(a-c) PA-induced plasma levels of IL-6, IL-1b and TNF-a at different time points after infection (OD600 0.3) compared to uninfected controls. Kruskal-Wallis test, P=0.01, P=0.001 and P=0.0009 vs. control (uninfected) group. (d-f) mRNA expression levels of (d) cytokines (IL-1 b, IL-6 and TNF-a), (e) chemokines (CXCL1 and CXCL2) and (f) adhesion molecules (ICAM-1 and VCAM-1) in cortex from control and infected mice. Mann-Whitney test, P=0.004, P=0.03, P=0.001, P=0.001 vs. control (uninfected) group. (g-i) mRNA expression levels of (g) cytokines (IL-1 b, IL-6 and TNF-a), (h) chemokines (CXCL1 and CXCL2) and (i) adhesion molecules (ICAM-1 and VCAM-1) in hippocampus from control and infected mice. Mann-Whitney test, P=0.01, P=0.005, P=0.01 vs. control (uninfected) group. In all graphs, each point indicates data from an individual animal bar graphs (columns and error bars) show mean ± S.E.M.
Figure 7
Figure 7. Effect of proinflammatory cytokines on brain microvascular endothelial barrier function.
(a) TER measurements across confluent monolayers of mouse brain microvascular endothelial cells treated with IL-1b (2–200 ng/mL) and IL-1b+TNF-a(20 ng/mL each). The data were represented as resistance change. Mean ± S.E.M., n=3. Arrow indicates when cytokines were added. (c) Summary data showing TER changes in brain microvascular endothelial cells treated with IL-1band IL-1b+TNF-a. (c) Immunocytochemical analysis of ZO-1 (green) on brain microvascular endothelial cells under control conditions (vehicle) or IL-1 btreatment in vitro. Nuclei was stained with DAPI. White arrows indicate TJ disorganization.

Similar articles

References

    1. McManus RM, Higgins SC, Mills KH, Lynch MA. Respiratory infection promotes T cell infiltration and amyloid-beta deposition in APP/PS1 mice. Neurobiol Aging. 2014;35(1):109–21. - PubMed
    1. Rubin K, Glazer S. The pertussis hypothesis: Bordetella pertussis colonization in the pathogenesis of Alzheimer’s disease. Immunobiology. 2017;222(2):228–40. - PubMed
    1. Maheshwari P Eslick GD. Bacterial infection and Alzheimer’s disease: a meta-analysis. J Alzheimers Dis. 2015;43(3):957–66. - PubMed
    1. Janssens JP Krause KH. Pneumonia in the very old. Lancet Infect Dis. 2004;4(2):112–24. - PubMed
    1. Gofton TE, Young GB. Sepsis-associated encephalopathy. Nat Rev Neurol. 2012;8(10):557–66. - PubMed

Publication types