[Preprint]. 2024 Jun 4:2023.01.30.526132.
doi: 10.1101/2023.01.30.526132.

DLK-dependent axonal mitochondrial fission drives degeneration following axotomy

Affiliations

DLK-dependent axonal mitochondrial fission drives degeneration following axotomy

Jorge Gómez-Deza et al. bioRxiv. .

Update in

Abstract

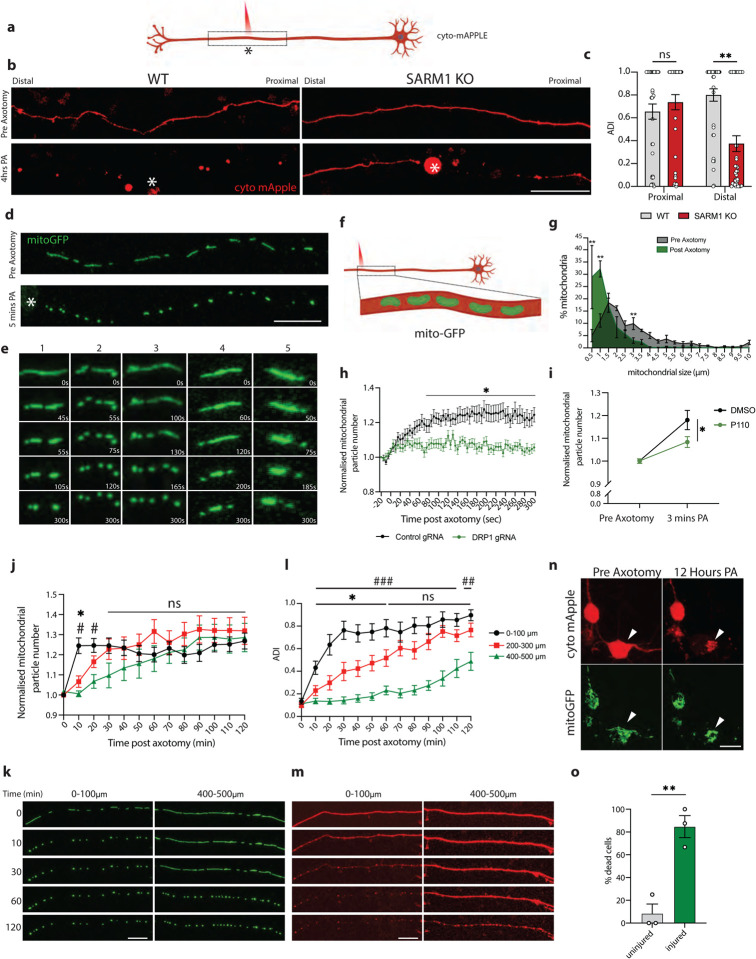
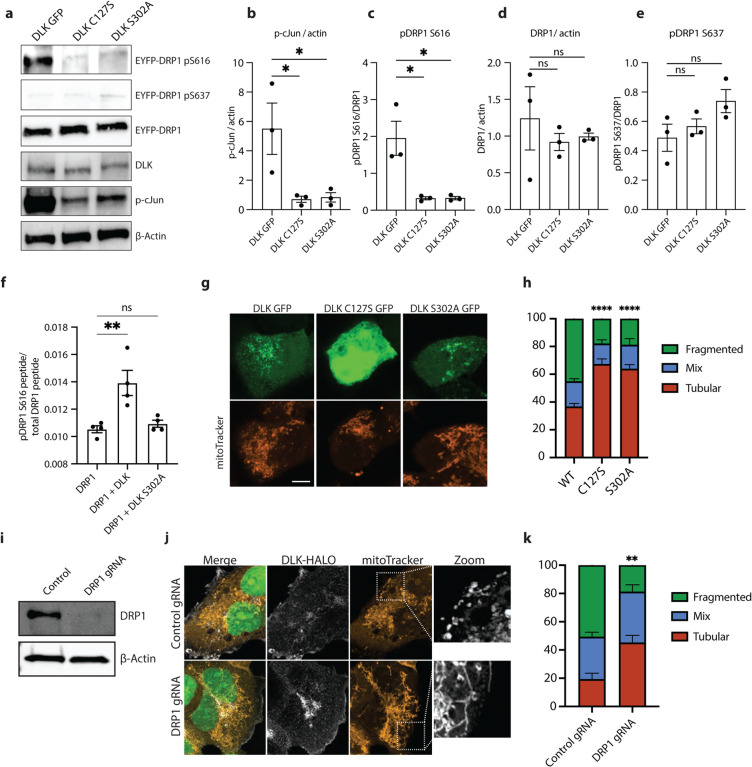
Currently there are no effective treatments for an array of neurodegenerative disorders to a large part because cell-based models fail to recapitulate disease. Here we developed a reproducible human iPSC-based model where laser axotomy causes retrograde axon degeneration leading to neuronal cell death. Time-lapse confocal imaging revealed that damage triggers an apoptotic wave of mitochondrial fission proceeding from the site of injury to the soma. We demonstrated that this apoptotic wave is locally initiated in the axon by dual leucine zipper kinase (DLK). We found that mitochondrial fission and resultant cell death are entirely dependent on phosphorylation of dynamin related protein 1 (DRP1) downstream of DLK, revealing a new mechanism by which DLK can drive apoptosis. Importantly, we show that CRISPR mediated Drp1 depletion protected mouse retinal ganglion neurons from degeneration after optic nerve crush. Our results provide a powerful platform for studying degeneration of human neurons, pinpoint key early events in damage related neural death and new focus for therapeutic intervention.


Figures

Figure 1 –
Figure 1 –. Axotomy triggers a wave of DRP1-dependent mitochondrial fission, axon degeneration and cell death
a) Schematic representation of i3Neuron laser axotomy using Biorender. Dashed box indicates field of view. * Marks the site of axotomy b) Representative images of WT and SARM1 KO axons transduced with cytoplasmic mApple (red) pre and 4 hours post axotomy (PA). * Marks the site of axotomy. (Scale bar = 100 μm). c) Quantification of axon degeneration index (ADI) in WT and SARM1 KO neurons distal and proximal to the site of axon injury 4 hours post axotomy. Results are represented as mean ± SEM. N=3 independent differentiations, N≥ 38 axons. Two-way ANOVA, Bonferroni correction (p≤0.01 **, not significant, ns). d) Representative images of i3Neuron axons transduced with mitoGFP (green) pre- and 5 minutes post axotomy (PA). * Marks the site of axotomy. (Scale bar = 20 μm). Time-lapse images of mitochondria shown in E. e) Representative images of mitochondria undergoing fission after axon injury outlined in D. f) Schematic representation of i3Neuron laser axotomy. Dashed box indicates field of view. g) Quantification of mitochondrial length pre (green) and 5 minutes post axotomy (grey) (PA). Results are represented as mean ± SEM. N=3 independent differentiations, N≥ 28 axotomized neurons. Two-way ANOVA, Bonferroni correction (p≤0.05 *). h) Normalized number of mitochondrial particles post axotomy in control and DRP1 KD neurons. Results are represented as mean ± SEM. N=3 independent differentiations, N≥ 25 axotomized neurons. Two-way ANOVA, Bonferroni correction (p≤0.05 *). i) Normalized number of mitochondrial particles 3 mins post axotomy in DMSO and P110 treated neurons. Results are represented as mean ± SEM. N=3 independent differentiations, N≥ 26 axotomized neurons. Two-way ANOVA, Bonferroni correction (p≤0.05 *). j) Quantification of axotomy-induced mitochondrial fission wave. Normalized number of mitochondrial particles post axotomy 0–100, 200–300 and 400–500 μm from the site of axotomy. Results are represented as mean ± SEM. N=3 independent differentiations, N≥ 23 axotomized neurons. One-way ANOVA, Bonferroni correction (*p≤0.05, 0–100 μm vs 200–300 μm, # p≤0.05, 0–100 μm vs 400–500 μm). k) Representative images of axotomy-induced mitochondrial fission wave, Pre axotomy (0), 10-, 30- and 120-minutes post axotomy. Neurons sparsely transduced with mitoGFP (green). (Scale bar = 25 μm). l) Quantification of axotomy-induced progressive axon degeneration. Axon degeneration index (ADI) 0–100, 200–300 and 400–500μm from the site of axotomy. Results are represented as mean ± SEM. N=3 independent differentiations, N≥ 14 axotomized neurons. (*p≤0.05, 0–100 μm vs 200–300 μm, ## p≤0.01, ### p≤0.005, 0–100 μm vs 400–500 μm). m) Representative images of axotomy-induced axon degeneration. Pre axotomy (0), 10-, 30- and 120-minutes post axotomy. Neurons sparsely transduced with cyto-mApple (red). * Marks the site of axotomy. (Scale bar = 25 μm). n) Representative images of axotomy-induced neuron death. Pre and 12-hours post axotomy. Arrow indicates axotomized neuron. Neurons sparsely transduced with cyto- mApple (red) and mitoGFP (green). (Scale bar = 40 μm). o) Quantification of axotomy-induced neuron death. Percentage of dead neurons 12 hours post axotomy. Results are represented as mean ± SEM. N=3 independent differentiations, N≥30 axotomized neurons. Unpaired t-test (p≤0.01 **).
Figure 2 –
Figure 2 –. DLK regulates axotomy-induced mitochondrial fission
a) Representative images of DLK colocalization at the site of mitochondrial fission after axotomy. DLK-GFP (green) and mitochondria (mitoRFP, magenta). (Scale bar = 10 μm). b) Percentage mitochondrial fission events where DLK is localized at the site of fission. Results are represented as mean ± SEM. N=3 independent differentiations, N≥30 axotomized neurons. c) Representative images of WT and DLK KO neurons transduced with mitoGFP (green) pre (Pre) and 5 mins post axotomy (PA). * Marks the site of axotomy. (Scale bar = 25 μm). d) Normalized number of mitochondrial particles post axotomy in WT (black) and DLK KO (green) neurons. Results are represented as mean ± SEM. N=3 independent differentiations, N≥ 30 axotomized neurons. (Two-way ANOVA, Bonferroni correction (p≤0.05 *) e) Normalized number of mitochondrial particles post axotomy in DMSO (black) and GNE3511 (green)-treated neurons. Results are represented as mean ± SEM. N=3 independent differentiations, N≥ 25 axotomized neurons. (Two-way ANOVA, Bonferroni correction (p≤0.05 *) f) Normalized number of mitochondrial particles post axotomy in DLK KO neurons transduced with WT DLK-GFP (green), DLK-C127S-GFP (black) or DLK-S302A-GFP (purple). Results are represented as mean ± SEM. N=3 independent differentiations, N≥ 23 axotomized neurons. Two-way ANOVA, Bonferroni correction (*p≤0.05, WT DLK vs DLK C127S, # p≤0.05, WT DLK vs S302A). g) Representative images of neurons transduced with mitoGFP (green) treated with DMSO and JNKi pre (Pre) and 5 mins post axotomy (PA). * Marks the site of axotomy. (Scale bar = 25 μm). h) Normalized number of mitochondrial particles post axotomy in DMSO (black) and JNKi (green)-treated neurons. Results are represented as mean ± SEM. N=3 independent differentiations, N≥ 30 axotomized neurons. (Two-way ANOVA, Bonferroni correction (p≤0.05 *)
Figure 3 –
Figure 3 –. Activation of the DLK pathway by overexpression causes increased DRP1 phosphorylation
a) Representative western blots of HEK293A cells transfected for 24 hours with WT, C127S and S302A DLK-GFP. Immunoblot for pS616-DRP1, pS637-DRP1, total DRP1, DLK, pS63-cJun and loading control ß actin. b) Quantification of pS63-cJun/ ß actin levels after 24-hour expression of WT, C127S and S302A DLK-GFP in HEK293A cells. Results are represented as mean ± SEM. One-way ANOVA, Bonferroni correction (p≤0.05 *). c) Quantification of pS616-DRP1/total DRP1 levels after 24-hour expression of WT, C127S and S302A DLK-GFP in HEK293A cells. Results are represented as mean ± SEM. One-way ANOVA, Bonferroni correction (p≤0.05 *). d) Quantification of total DRP1/ ß actin levels after 24-hour expression of WT, C127S and S302A DLK-GFP in HEK293A cells. Results are represented as mean ± SEM. One-way ANOVA, Bonferroni correction (not significant, ns). e) Quantification of pS637 DRP1/ ß actin levels after 24-hour expression of WT, C127S and S302A DLK-GFP in HEK293A cells. Results are represented as mean ± SEM. One-way ANOVA, Bonferroni correction (not significant, ns). f) Phospho-mass spectrometry. pS616-DRP1 peptide / total DRP1 peptide levels from purified GST-DRP1 in HEK 293A cells expressing GST-DRP1, GST-DRP1 and DLK-GFP or GST-DRP1 and DLK-S302A-GFP. Results are represented as mean ± SEM. One-way ANOVA, Bonferroni correction (p≤0.01 **). g) Representative images of HEK-293A cells expressing WT, C127S and S302A DLK-GFP (green) and mitoTracker (orange) for 24 hours. (Scale bar = 10 μm). h) Quantification of mitochondrial morphology in HEK293A cells transfected for 24 hours with WT, C127S and S302A DLK-GFP. N=3 individual transfections. Results are represented as mean ± SEM. Two-way ANOVA, Bonferroni correction (WT vs C127S p≤0.0001 ****, WT vs S302A p≤0.0001 ****, C127S vs S302A not significant, ns). i) Representative western blots HEK-293A cells expressing dCAS9 transduced with control and DRP1 gRNAs. Immunoblot for total DRP1 and loading control ß actin. j) Representative images of Control and DRP1 KD HEK-293A cells expressing DLK-HALO for 24 hours. NLS-GFP (green), DLK-HALO (white), mitoTracker (orange). (Scale bar = 10 μm). k) Quantification of Control and DRP1 KD HEK-293A cells mitochondrial morphology. Cells transfected for 24 hours with DLK-HALO. N=3 individual transfections. Results are represented as mean ± SEM. (Two-way ANOVA, Bonferroni correction (p≤0.01 **)
Figure 4 –
Figure 4 –. Axotomy causes DLK-dependent phosphorylation of DRP1
a) Schematic representation of i3Neuron center plating and axotomy for protein harvesting after injury. b) Representative western blots of WT and DLK KO neuron cell bodies untreated (UT), 2 and 4 hours post axotomy. Immunoblot for p-S616 DRP1, total DRP1 and loading control ß actin. c) Quantification of pDRP1 (S616)/ total DRP1 levels in WT and DLK KO neuron cell bodies untreated (UT), 2 and 4 hours post axotomy. Results normalized to UT. Results are represented as mean ± SEM. N=3 independent differentiations. One-way ANOVA. No significant changes observed. d) Representative western blots of WT and DLK KO neuron axons untreated (UT), 2 and 4 hours post axotomy. Immunoblot for p-S616 DRP1, total DRP1 and loading control ß actin. e) Quantification of pDRP1 (S616)/ total DRP1 levels in WT and DLK KO neuron axons 0, 2 and 4 hours post axotomy. Results normalized to UT. Results are represented as mean ± SEM. N=3 independent differentiations. Two-way ANOVA. Bonferroni correction (p≤0.05*). f) Representative images of WT and DLK KO axons stained for ßIII tubulin (red) and pDRP1 S616 (white) untreated (UT), 30 mins and 1 hour post axotomy. (Scale bar = 25 μm). g) Quantification of pDRP1 S616 fluorescence in WT and DLK KO neuron axons after axotomy. Results normalized to untreated axons. Results are represented as mean ± SEM. N=3 independent differentiations. Two-way ANOVA, Bonferroni correction (p≤0.05 *) h) Schematic representation of optic nerve crush injury model. Bracket and * indicate the proximal portion of the injured nerve harvested for western blotting. i) Representative western blots of proximal portion of ipsilateral (I) injured and contralateral (C) optic nerves 24 hours after optic nerve crush. Immunoblot for p-S616 DRP1, total DRP1 and loading control ß actin. j) Quantification of pDRP1 (S616)/ total DRP1 levels after optic nerve crush. Results normalized to contralateral side (C). Results are represented as mean ± SEM. Unpaired t-test (p≤0.05 *). k) Quantification of total DRP1/ ß actin levels after optic nerve crush. Results normalized to contralateral side (C). Results are represented as mean ± SEM. Unpaired t-test not significant, ns.
Figure 5 –
Figure 5 –. Blocking DRP1 or DLK delays axon degeneration
a) Schematic representation of i3Neuron laser axotomy. Dashed box indicates the field of view b) Representative images of WT and DLK KO neuron axons transduced with cyto mApple (red) proximal to the site of injury 0,4, 8 and 24 hours post axotomy (Scale bar = 25 μm). c) Quantification of axon degeneration index (ADI) in WT and DLK KO neurons 0, 4, 8 and 24 hours post axotomy. Results are represented as mean ± SEM. N=3 independent differentiations, N≥ 33 axons. Two-way ANOVA, Bonferroni correction (p≤0.005 ***, p≤0.001 ****). d) Schematic representation of i3Neuron laser axotomy. Dashed box indicates field of view. e) Representative images of Control and DRP1 KD neuron axons transduced with cyto mApple (red) proximal to the site of injury 0, 4, 8 and 24 hours post axotomy (Scale bar = 25 μm). f) Quantification of axon degeneration index (ADI) in WT and DLK KO neurons 0, 4, 8 and 24 hours post axotomy. Results are represented as mean ± SEM. N=3 independent differentiations, N≥ 33 axons. Two-way ANOVA, Bonferroni correction (p≤0.005 ***, p≤0.001 ****). g) Schematic representation of i3Neuron laser axotomy. Dashed box indicates field of view. h) Representative images of WT and DLK KO neuron cell bodies transduced with cyto mApple (red) pre and 18 hours post axotomy (PA). (Scale bar = 40 μm). i) Percentage degenerated WT and DLK KO 18 post axotomy. Results are represented as mean ± SEM. N=3 independent differentiations. Unpaired t-test (p≤0.05 *). j) Schematic representation of i3Neuron laser axotomy. Dashed box indicates field of view. k) Representative images of Control and DRP1 KD neuron cell bodies transduced with cyto mApple (red) pre and 18 hours post axotomy (PA). (Scale bar = 40 μm). l) Percentage degenerated Control and DRP1 KD 18 post axotomy. Results are represented as mean ± SEM. N=3 independent differentiations. Unpaired t-test (p≤0.05 *).
Figure 6 –
Figure 6 –. DRP1 mediates cell death after ONC
a) Schematic representation of RGC survival following optic nerve crush (ONC). b) Western blots of Control and DRP1 gRNA transduced optic nerved. Immunoblot for DRP1 and loading control ß actin. c) Quantification of DRP1 knockdown by Western blot. Results are represented as mean ± SEM. d) Representative images of cleaved caspase 3 positive cells in saCas9-Control and saCas9-DRP1 gRNA transduced RGCs 3 days after ONC. (Scale bar = 25 μm). e) Average cleaved caspase 3 positive cells per section in saCas9-Control, saCas9-DRP1 gRNA and EGFP transduced RGCs after nerve crush. Results are represented as mean ± SEM. N≥4 animals per condition. One-way ANOVA, Bonferroni correction. (Control gRNA vs EGFP, not significant, ns. Control gRNA vs DRP1 gRNA p≤0.05 *. DRP1 gRNA vs EGFP p≤0.01 **). f) Representative images of retinas 7 days post ONC and immunostained for RGC marker RBPMS (magenta). Images acquired at similar areas and the same distance from the optic nerve head (ONH). Scale bar = 100 μm. g) Quantification of RBPMS-positive RGCs in the retinas of control and DRP1 gRNA mice at 7DPI. (N=8 mice per condition. Unpaired t-test P < 0.0001 ****) h) Representative isodensity maps display the topographical survival of RBPMS+RGCs at 7 days post-injury. DRP1 gRNA treatment delays ONC-induced RGC degeneration across the retina. Color scale for isodensity maps ranges from 0 (purple) to 3,600 (red) RGCs/mm2.
Figure 7 –
Figure 7 –. BAX regulates cell death after axotomy
a) Representative images of WT neurons treated with DMSO or GNE3511 pre- and 1-hour post-axotomy (PA) expressing mitoGFP (green) and A1-BAX/B1-DRP1 complexes (red). (Scale bar = 5 μm). b) Quantification of A1-BAX/B1-DRP1 fluorescence fold change in the mitochondria of DMSO or GNE3511 treated neurons 1-hour post-axotomy. Results are represented as mean ± SEM. N=3 independent differentiations, N≥ 34 axotomized neurons. Two-way ANOVA, Bonferroni correction. (p≤0.05 *). c) Quantification of A1-BAX/B1- WT DRP1 and A1-BAX/B1- DRP1 S616A fluorescence fold change in the mitochondria 1-hour post-axotomy. Results are represented as mean ± SEM. N=3 independent differentiations, N≥ 34 axotomized neurons. Two-way ANOVA, Bonferroni correction. (p≤0.05 *). d) Representative images of DMSO and BAXi treated neuron cell bodies transduced with cyto mApple (red) pre and 18 hours post axotomy (PA). (Scale bar = 40 μm). e) Percent degenerated neurons 18 hours post axotomy treated with either DMSO or BAXi. Results are represented as mean ± SEM. N=3 independent differentiations. Unpaired t-test (p≤0.05 *). f) Quantification of axon degeneration index (ADI) of DMSO and BAX-A-treated neurons 24 hours after axotomy. Results are represented as mean ± SEM. N=3 independent differentiations. One-way ANOVA, Bonferroni correction (p≤0.001 ***, not significant, ns). g) Illustration of microfluidic devices used to separate axons from somas allowing for the local treatment of i3Neuron axons. h) Representative images of WT axons separated using microfluidic chambers treated with DMSO, BAX-A or BAX-A + GNE3511 for 24 hours. (Scale bar = 25 μm). i) Quantification of axon degeneration index (ADI) of isolated axons treated with DMSO BAX-A and BAX-A + GNE3511 for 24 hours. Results are represented as mean ± SEM. N=3 independent differentiations. One-way ANOVA, Bonferroni correction (p≤0.001 ****, not significant, ns).

References

    1. Whitmore A.V., et al., The proapoptotic proteins Bax and Bak are not involved in Wallerian degeneration. Cell Death Differ, 2003. 10(2): p. 260–1. - PubMed
    1. Deckwerth T.L., et al., BAX is required for neuronal death after trophic factor deprivation and during development. Neuron, 1996. 17(3): p. 401–11. - PubMed
    1. Simon D.J., et al., Axon Degeneration Gated by Retrograde Activation of Somatic Proapoptotic Signaling. Cell, 2016. 164(5): p. 1031–45. - PMC - PubMed
    1. Simon D.J., et al., A caspase cascade regulating developmental axon degeneration. J Neurosci, 2012. 32(49): p. 17540–53. - PMC - PubMed
    1. Osterloh J.M., et al., dSarm/Sarm1 is required for activation of an injury-induced axon death pathway. Science, 2012. 337(6093): p. 481–4. - PMC - PubMed

Publication types