[Preprint]. 2023 Nov 5:2023.01.31.525983.
doi: 10.1101/2023.01.31.525983.

Perturb-tracing enables high-content screening of multiscale 3D genome regulators

Affiliations

Perturb-tracing enables high-content screening of multiscale 3D genome regulators

Yubao Cheng et al. bioRxiv. .

Update in

Abstract

Three-dimensional (3D) genome organization becomes altered during development, aging, and disease1-23, but the factors regulating chromatin topology are incompletely understood and currently no technology can efficiently screen for new regulators of multiscale chromatin organization. Here, we developed an image-based high-content screening platform (Perturb-tracing) that combines pooled CRISPR screen, a new cellular barcode readout method (BARC-FISH), and chromatin tracing. We performed a loss-of-function screen in human cells, and visualized alterations to their genome organization from 13,000 imaging target-perturbation combinations, alongside perturbation-paired barcode readout in the same single cells. Using 1.4 million 3D positions along chromosome traces, we discovered tens of new regulators of chromatin folding at different length scales, ranging from chromatin domains and compartments to chromosome territory. A subset of the regulators exhibited 3D genome effects associated with loop-extrusion and A-B compartmentalization mechanisms, while others were largely unrelated to these known 3D genome mechanisms. We found that the ATP-dependent helicase CHD7, the loss of which causes the congenital neural crest syndrome CHARGE24 and a chromatin remodeler previously shown to promote local chromatin openness25-27, counter-intuitively compacts chromatin over long range in different genomic contexts and cell backgrounds including neural crest cells, and globally represses gene expression. The DNA compaction effect of CHD7 is independent of its chromatin remodeling activity and does not require other protein partners. Finally, we identified new regulators of nuclear architectures and found a functional link between chromatin compaction and nuclear shape. Altogether, our method enables scalable, high-content identification of chromatin and nuclear topology regulators that will stimulate new insights into the 3D genome functions, such as global gene and nuclear regulation, in health and disease.


Figures

Extended Data Fig. 1.
Extended Data Fig. 1.. CRISPR screen library allows for sgRNA expression for genome editing and the barcode RNA expression for BARC-FISH decoding.
a, Schematic of the construction of CRISPR screen library. A CRISPR knockout plasmid library containing sgRNA-barcode associations was constructed to generate a lentivirus library, which was transduced into human A549-Cas9 cells to produce a cell library. b, Design of the CRISPR screen plasmid and the lentiviral integration strategy. The sgRNA-barcode cassette was composed of human U6 promoter (hU6, blue), sgRNA (yellow), barcode (purple) and UMI (dark blue) sequences and placed within 3’ long terminal repeat (3’ LTR, dark gray), downstream of a strong RNA Pol II promoter (CMV, green). This cassette was duplicated and inserted within 5’ LTR (light gray) during lentiviral integration. Therefore, the cassette within 5’ LTR was able to express the sgRNA for genome editing, while the other copy was driven by CMV promoter to express a high level of barcode RNA for BARC-FISH decoding. Other elements on the plasmid including EF-1α promoter (pink), Puromycin resistance gene (magenta) and WPRE element (brown) were shown. c, BARC-FISH decoding efficiency in the CRISPR screen cell library. After BARC-FISH decoding procedure, the decoded barcodes were compared and matched to the barcodes determined by NGS. 33% of the imaged cells contained barcodes with perfect matches. After the error correction, 51% of the cells contained matched barcodes. d, Analysis of barcode quality determined by NGS. The sgRNA-barcode associations in the CRISPR screen cell library were determined by NGS (see Methods, “Detection of sgRNA-barcode associations in the cell library” section). In total, 4,469 barcodes were detected, among which 76% were good codes associating with one unique sgRNA. 413 sgRNAs targeting 137 genes and 8 non-targeting controls were found to be associated with these good codes. 412 of the 413 sgRNAs were observed in the image-based screen.
Extended Data Fig. 2.
Extended Data Fig. 2.. Cloning strategy of plasmid libraries, CRISPR knockout efficiency, and the Geminin-based cell cycle identification.
a, The barcode plasmid library was assembled from individual oligos through overlapping ligation, overlapping PCR, limited-cycle PCR and Gibson Assembly (see Methods, “Barcode plasmid library construction” section). Each of the forward-strand oligos contained three alternative sequences (in the smaller gray dashed box), represented by three different colors cyan, magenta, and yellow. The overlapping oligos in the reverse strand contained 9 alternative sequences (in the larger gray dashed box). Oligos at the two ends carried PCR priming regions (straight gray lines). The barcode was divided into two halves which were subjected to overlapping ligation to form two double-stranded fragments. The two fragments were assembled by overlapping PCR to form a full-length barcode. The barcode was then amplified and added with UMI (unique molecular identifier) by limited-cycle PCR primers. The barcode-UMI fragments were inserted into a digested plasmid backbone through Gibson Assembly to construct the final barcode plasmid library. To clone the CRISPR screen plasmid library, sgRNA fragments and barcode-UMI fragments were amplified from the premade sgRNA plasmid library and barcode plasmid library respectively, through limited-cycle PCR. The sgRNA and barcode-UMI were then Gibson Assembled into a digested lentiviral plasmid backbone to generate the final CRISPR screen plasmid library (see Methods, “CRISPR screen plasmid library construction” section). The UMI was necessary for sequencing-based mapping of barcode-sgRNA associations (see Methods, “Next-generation sequencing (NGS) library preparation for mapping sgRNA-barcode associations”). b, Percentage of frameshift mutations of sgCHD7, sgTBX6, sgRUNX3, sgNIPBL and sgLRIF1. c, Two representative cells from the screen datasets were shown to demonstrate the Geminin staining strategy for G1 phase cell detection. Geminin antibody stain (magenta) is absent in a G1 phase cell (left), which showed two DNA FISH foci of TAD3 (yellow) of chr22. The S/G2 phase cell (right) is positive for Geminin stain and have four DNA FISH foci of TAD3 in two pairs, indicating replicated TAD3 DNA. Because Geminin and the yellow-green fiducial beads were imaged using the same laser channel, bead patterns were seen in both images (small, round magenta spots outside of the nuclei). Scale bar: 10 μm.
Extended Data Fig. 3.
Extended Data Fig. 3.. Validation of CHD7 perturbation phenotypes using RNA interference.
a, Western blot of siCtrl- and siCHD7-treated A549-Cas9 nuclear extracts. Top: anti-CHD7 antibody; bottom: anti-Actin B antibody. b, A-B compartment profile of chr22 in siCtrl cells. c, A-B compartment profile of chr22 in siCHD7 cells. d, Polarization indices of chr22 A-B compartments of siCtrl (white) and siCHD7 (orange). Shadowed boxes show the polarization indices from randomized controls, where the compartment identities of TADs are scrambled. e, Compartmental contact frequencies of siCtrl and siCHD7 (shadowed) among A compartment regions (red), between A and B compartment regions (purple), and among B compartment regions (blue). f, Overall inter-TAD distance of siCtrl and siCHD7. g, Radii of gyration of siCtrl and siCHD7. P values in d, e and g were calculated by two-sided Wilcoxon rank sum test. P value in f was calculated by two-sided Wilcoxon signed rank test.
Extended Data Fig. 4.
Extended Data Fig. 4.. Validation of CHD7 perturbation phenotypes using overexpression.
a, A-B compartment profile of chr22 in A549-Cas9 cells with GFP overexpression. b, A-B compartment profile of chr22 in A549-Cas9 cells with CHD7 overexpression. c, Polarization indices of cells with GFP (white) and CHD7 (orange) overexpression and the corresponding randomized controls (shadowed). d, Compartmental contact frequencies of cells with GFP of CHD7 (shadowed) overexpression in A compartments (red), across A and B compartments (purple) and in B compartments (blue). e, Overall inter-TAD distance of chr22 in cells with GFP and CHD7 overexpression. f, Radii of gyration of chr22 in cells with GFP and CHD7 overexpression. P values in c, d and f were calculated by two-sided Wilcoxon rank sum test. P value in e were calculated by two-sided Wilcoxon signed rank test.
Extended Data Fig. 5.
Extended Data Fig. 5.. Validation of CHD7 perturbation phenotypes in a different cell background and genomic context.
a, Log2 fold change matrix of overall inter-TAD distance of chr21 between siCHD7 and siCtrl in hTERT RPE-1 cells. b, Overall inter-TAD distance of chr21 in siCtrl and siCHD7 cells. c, Radii of gyration of chr21 in siCtrl and siCHD7 cells. d, Log2 fold change of short-range and long-range inter-TAD distances between siCHD7 and siCtrl. e, Compartmental contact frequencies in A compartments (red), across A and B compartments (purple) and in B compartments (blue) of chr21 in siCtrl and siCHD7 cells. P values in b and d were calculated by two-sided Wilcoxon signed rank test. P values in c and e were calculated by two-sided Wilcoxon rank sum test. Number of traces analyzed: 904 (siCtrl) and 210 (siCHD7).
Extended Data Fig. 6.
Extended Data Fig. 6.. Validation of CHD7’s long range chromatin compaction function in neural crest cells.
a, Western blot of shControl- and shCHD7-transduced human embryonic stem cells (hESC) and human neural crest progenitors (hNCP). Top: anti-CHD7 antibody; middle: anti-SOX10 antibody; bottom: anti-HSP90 antibody. CHD7 increased upon neural crest induction, and reduced in shCHD7 hNCP cells compared to shControl. Sox10, the neural crest marker, was expressed at similar levels in shControl and shCHD7 hNCP cells. HSP90 is a loading control. b, Log2 fold change of overall inter-TAD distance of chr22 between shCHD7 and shControl hNCP cells. Number of traces analyzed: 4,657 (shControl) and 2,796 (shCHD7). c, Log2 fold change of short-range and long-range inter-TAD distances of chr22 between shCHD7 and shContrl hNCP cells. P values were calculated by two-sided Wilcoxon signed rank test.
Extended Data Fig. 7.
Extended Data Fig. 7.. CHD7 binds diverse genomic regions.
a, Example tracks of CUT&RUN peak profiles of CHD7 and other proteins/epigenetic mark over different genomic regions. b, Heat map of other proteins/epigenetic mark localized to CHD7 peaks by CUT&RUN. c, Peak annotation for all CHD7 CUT&RUN peaks. d, Overlap of CUT&RUN peaks of CTCF, RAD21, and H3K4me3 with CHD7 peaks. e, Top 10 gene ontology terms up and down in siCHD7 cells versus siControl cells based on bulk RNA-seq analyses. Gene ontology was performed using Enrichr. f, Volcano plot of RNA-seq comparing siCHD7 and siControl cells (siCHD7/siControl). Top differentially expressed genes are displayed on the graph as labels. CHD7 is highlighted and is a top differentially downregulated gene in the siCHD7 cells, validating the knockdown.
Extended Data Fig. 8.
Extended Data Fig. 8.. HDAC inhibition causes short-range chromatin decompaction and long-range chromatin compaction.
a, H3K27ac IF measurements of DMSO-treated control (left) and TSA-treated (middle) A549 cells, and the quantification of mean signal intensity (right). The error bars represent standard deviations. Number of nuclei analyzed: 103 (DMSO) and 85 (TSA). b, Adjacent TAD contact frequency of DMSO- and TSA-treated cells. c, Log2 fold change of contact frequency between each pair of adjacent TADs along chr22 of TSA-treated cells compared to DMSO-treated cells. d, Short-range inter-TAD distance along chr22 of DMSO- and TSA-treated cells. e, Long-range inter-TAD distance along chr22 of DMSO- and TSA-treated cells. f, Overall inter-TAD distance of chr22 of DMSO- and TSA-treated cells. g, Radii of gyration of chr22 in DMSO- and TSA-treated cells. P value in a was calculated by two-tailed unpaired t test. P values in b and d-f were calculated by two-sided Wilcoxon signed rank test. P value in g was calculated by two-sided Wilcoxon rank sum test.
Extended Data Fig. 9.
Extended Data Fig. 9.. Tissue specific expression of top hits based on bulk RNA sequencing results from the Human Protein Atlas.
This figure was created with Biorender.
Fig. 1.
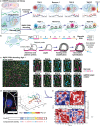
Fig. 1.. Perturb-tracing enables image-based pooled CRISPR screen of chromatin and nuclear organization regulators.
a, Schematic of the screening approach. A lentivirus library encoding paired sgRNAs and barcode RNAs was transduced into human A549 cells expressing Cas9 protein. The organization of chr22 was determined by chromatin tracing and the identity of the knockout gene was determined by BARC-FISH decoding of the barcode RNAs. For chromatin tracing, all 27 TADs spanning chr22 were sequentially visualized in a multiplexed DNA FISH procedure. For BARC-FISH decoding, 10 digits of the barcode were amplified and sequentially imaged. b, A scheme of the BARC-FISH method. In each cell, the expressed barcode RNA was composed of 10 “digits”, and each digit had one of three different values (values 0, 1 and 2, represented by orange, cyan, and magenta respectively). Each digit was hybridized with a linear probe and padlock probe, enabling ligation of the padlock probe, which was then subjected to rolling circle amplification, generating an amplicon containing multiple copies of the digit sequences. Dye-labelled secondary probes were then introduced for imaging, reading out the value of the digit. c, An example of BARC-FISH decoding. Left: A representative field of view from the screen with BARC-FISH signals shown in orange, cyan, and magenta, cell segmentation shown as white lines, and total protein stain in green. Right: The yellow-boxed cell in the left panel in 10 rounds of decoding. Scale bars: 20 μm. d, Chromatin tracing of the yellow-boxed cell in c. Left: An image of the cell, with the traces of the two copies of chr22 shown in red and DAPI stain shown in blue. Right: 3D chromatin trace of the yellow-boxed chromosome in the left panel. The 3D positions of each TAD were shown as pseudo-colored spots, connected with a smooth curve. Below: The genomic positions of TADs 1–27 on chr22, and their corresponding compartment identity (red: compartment A; blue: compartment B). Scale bar: 20 μm. e, Example matrices of log2 fold changes of inter-TAD spatial distances for selected hits from the screen.
Fig. 2.
Fig. 2.. Perturb-tracing screen identified regulators of multi-scale chromatin folding.
a, Log2 fold change (log2fc) of spatial distance between adjacent TADs versus −log10 false discovery rate (FDR) for each perturbation. Each dot represents a perturbation in the screen library. In all volcano plots, the top hits (nuclear proteins with the largest log2fc and FDRs<0.1) in both directions are indicated with blue (knockout leads to upregulation) and red dots (knockout leads to downregulation), respectively. The top candidate genes which when knocked out led to increased adjacent TAD distances are: RB1, MRVI1 and PIP5K1B; the top candidate genes which when knocked out caused decreased adjacent TAD distances are: GLDC, NR4A1 and ZNF114. Positive controls (NIPBL and CTCF) are marked in black. b, Log2 fold change of adjacent TAD distance across chr22 for selected hits. c, Spatial distances between adjacent TADs for non-targeting control and selected hits. d, Log2 fold change of long-range A-A contact frequency versus −log10 FDR for each perturbation. Top three hits in both directions including NR4A1, PDE1A, HOXB9, RB1, PCBP1 and LRRC10B are labeled. e, Long-range A-A contact frequencies for non-targeting control and selected hits. f, Log2 fold change of long-range A-B contact frequency versus −log10 FDR for each perturbation. Top three hits in both directions, including RFESD, HOXB9, FAM69B, C2CD2, CHD7 and FAM13C, are labeled. g, Long-range A-B contact frequencies for non-targeting control and selected hits. h, Log2 fold change of long-range B-B contact frequency versus −log10 FDR for each perturbation. Top hits in both directions, including FOS, NR4A1, DDX24 and MYBPH, are labeled. i, Long-range B-B contact frequencies for non-targeting control and selected hits. j, Log2 fold change of overall inter-TAD distances versus −log10 FDR for each perturbation. Top three hits in both directions, including PCBP1, RB1, CHD7, GLDC, HOXB9 and CUL1, are labeled. k, Overall inter-TAD distances for non-targeting control and selected hits. l, Log2 fold change of individual overall inter-TAD distances in chr22 for selected hits. P values in c and k were calculated by two-sided Wilcoxon signed rank test. P values in e, g and i were calculated by two-sided Wilcoxon rank sum test. In all box plots throughout the manuscript, the boxes cover the 25th to 75th percentiles, the whiskers cover the 10th to 90th percentiles, and the line in the middle of the boxes represents the median value. For all relevant panels, significance is represented as *p<0.1. **p<0.05. ***p<0.01.
Fig. 3.
Fig. 3.. Characterization of the regulators of multi-scale chromatin folding.
a, Fold change (bubble color) and significance (circle size) of multi-scale chromatin folding phenotypes of top hits. Phenotypic changes with p < 0.05 are not shown. b, Correlation of log2 fold change (log2fc) of short-range inter-TAD distance (defined as spatial distances between genomic regions that are less than 3Mb apart) between sgNIPBL (x axis) and sgCTCF (y axis). c, Correlation of log2fc of short-range inter-TAD distance between sgNIPBL (x axis) and a representative top hit sgDDX24 (y axis). d, Top hits significantly correlated with NIPBL in log2fc of short-range inter-TAD distance upon knockout. e, A-B compartment score profile of Chr22. f, Matrix of average A-B compartment scores of pairs of TADs. g, Correlation between the log2fc of inter-TAD distance upon ZNF114 knockout and the average A-B compartment score of the TADs. h, Top hits with 3D genome effects (log2fc of inter-TAD distance upon knockout) significantly correlated with the AB compartment score matrix. Error bars in d and h represent 95% confidence intervals. Stars represent the significance of the correlation: *p<0.05, ** p<0.01, ***p<0.001, ****p<0.0001.
Fig. 4.
Fig. 4.. CHD7 is a long-range chromatin compactor that globally suppresses gene expression.
a, Log2 fold change of inter-TAD distance of siCHD7 compared to siCtrl. Number of traces analyzed: 3,558 (siCtrl) and 4,134 (siCHD7). b, Log2 fold change of short-range (defined as spatial distances between genomic regions that are less than 3Mb apart) and long-range (defined as spatial distances between genomic regions that are more than 3Mb apart) inter-TAD distances between siCHD7 and siCtrl. c, Log2 fold change of inter-TAD distance of CHD7 overexpression compared to GFP overexpression. Number of traces analyzed: 3,157 (GFP OE) and 1,174 (CHD7 OE). d, Log2 fold change of short-range and long-range inter-TAD distances between CHD7 and GFP overexpression. e, Log2 fold change of inter-TAD distance of TSA-treated cells compared to DMSO-treated cells. Number of traces analyzed: 1,214 (DMSO) and 2,223 (TSA). f, Log2 fold change of short-range and long-range inter-TAD distances between cells with TSA and DMSO treatment. g, Log2 fold change of inter-TAD distance of CHD7-ΔBRK (BRK domain deletion) overexpression compared to GFP overexpression. Number of traces analyzed: 3,415 (CHD7-ΔBRK OE) and 2,164 (GFP OE). h, Log2 fold change of short-range and long-range inter-TAD distances between CHD7-ΔBRK OE and GFP OE. i, Log2 fold change of inter-TAD distance of CHD7-K999R overexpression compared to GFP overexpression. Number of traces analyzed: 2,045 (CHD7-K999R) and 2,164 (GFP OE) j, Log2 fold change of short-range and long-range inter-TAD distances between CHD7-K999R OE and GFP OE. All chromatin tracing experiments in this figure were done in the A549 cell background, targeting chr22. P values were calculated by two-sided Wilcoxon signed rank test. k, Representative images of dye-labeled lambda DNA without/with purified CHD7. Scale bar: 500 μm. l, Spatial distribution of 130 genes decoded by RNA MERFISH in siCtrl and siCHD7 cells. Two representative cells are shown for each condition. Scale bar: 10 μm. m, Average RNA counts per cell for each gene in siCHD7 versus siCtrl cells. The red dashed line represents the x=y line. n, −Log10 false discovery rate (FDR) versus log2 fold change (log2fc) of average RNA counts per cell for each gene from siCtrl to siCHD7. Number of cells analyzed: 1,979 (siCtrl) and 1,186 (siCHD7) in m and n. o, Representative cell images of poly-A stain for siCtrl and siCHD7 cells. Scale bar: 20 μm. p, Mean fluorescent intensity of poly-A stain in individual nuclei of siCtrl and siCHD7 cells. P value was calculated by two-sided Wilcoxon rank sum test. Number of nuclei analyzed: 666 (siCtrl) and 594 (siCHD7).
Fig. 5.
Fig. 5.. Perturb-tracing screen identified hits that regulate chromosome association with nuclear lamina and the morphological properties of the nucleus.
a, Log2 fold change of chromosome distance to nuclear lamina versus −log10 FDR. Top hits in both directions, including LRRC10B, DDX21, HMGA2, CUL1, PRSS22 and MAB21L2, are labeled. b, Chromosome distance to nuclear lamina of non-targeting control and selected hits. c, Log2 fold change of distances between each TAD on chr22 to nuclear lamina of selected hits. d, Log2 fold change of nuclear intensity unevenness (measured as coefficient of variation of nuclear voxel intensities) versus −log10 FDR. Top hits RB1 and MYBPH are labeled. e, Nuclear intensity unevenness of non-targeting control and selected hits. f, Heatmap of nuclear intensity deviation from mean intensity of representative nuclei from non-targeting control (left column) and selected hit sgRB1 (right column). Scale bar: 10 μm. g, Voxel intensity distribution of all nuclei from non-targeting control (black curve) and selected hit sgRB1 (red curve). Dashed lines indicate the standard deviations of the indicated distributions. h, Log2 fold change of nuclear sphericity versus −log10 FDR. Top hits TRIM36 and EEPD1 are labeled. i, Nuclear sphericity of non-targeting control and selected hits. j, Representative nuclei images of non-targeting control (left column) and selected hits that regulate nuclear sphericity, TRIM36 (middle column) and EEPD1 (right column). Each column contains the DAPI staining of two representative cells from the indicated perturbation. Scale bar: 10 μm. P values in b, e and i were calculated by two-sided Wilcoxon rank sum test.
Fig. 6.
Fig. 6.. A link between chromatin compaction and nuclear shape.
a, Correlation coefficients (bubble color) and significance of correlations (bubble size) between pairs of 3D genome/nucleome features calculated using all top hits. b, Nuclear sphericities of siCtrl and siCHD7 A549-Cas9 Cells. Number of cells analyzed: 1,156 (siCtrl) and 1,412 (siCHD7). c, Representative DAPI images of siCtrl and siCHD7 A549-Cas9 cells. d, Simulated chromatin polymer folding conformations and the corresponding bounding envelop sphericities at different chromatin self-interaction energies (K = 1, 0.4 or 0.1). Lower energy corresponds to weaker chromatin interaction. N = 100 simulated conformations for each energy. P values in b and d were calculated by two-sided Wilcoxon rank sum test.

References

    1. Fraser P. & Bickmore W. Nuclear organization of the genome and the potential for gene regulation. Nature 447, 413–417, doi:10.1038/nature05916 (2007). - DOI - PubMed
    1. Bickmore W. A. & van Steensel B. Genome Architecture: Domain Organization of Interphase Chromosomes. Cell 152, 1270–1284, doi:10.1016/j.cell.2013.02.001 (2013). - DOI - PubMed
    1. Krijger P. H. & de Laat W. Regulation of disease-associated gene expression in the 3D genome. Nat Rev Mol Cell Biol 17, 771–782, doi:10.1038/nrm.2016.138 (2016). - DOI - PubMed
    1. Hnisz D., Shrinivas K., Young R. A., Chakraborty A. K. & Sharp P. A. A Phase Separation Model for Transcriptional Control. Cell 169, 13–23, doi:10.1016/j.cell.2017.02.007 (2017). - DOI - PMC - PubMed
    1. Yu M. & Ren B. The Three-Dimensional Organization of Mammalian Genomes. Annu Rev Cell Dev Biol 33, 265–289, doi:10.1146/annurev-cellbio-100616-060531 (2017). - DOI - PMC - PubMed

Publication types