[Preprint]. 2023 Feb 3:2023.02.02.526674.
doi: 10.1101/2023.02.02.526674.

CDK4/6 inhibition enhances SHP2 inhibitor efficacy and is dependent upon restoration of RB function in malignant peripheral nerve sheath tumors

Affiliations

CDK4/6 inhibition enhances SHP2 inhibitor efficacy and is dependent upon restoration of RB function in malignant peripheral nerve sheath tumors

Jiawan Wang et al. bioRxiv. .

Update in

Abstract

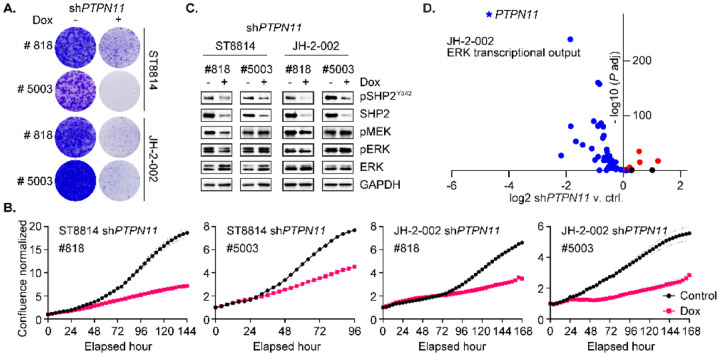
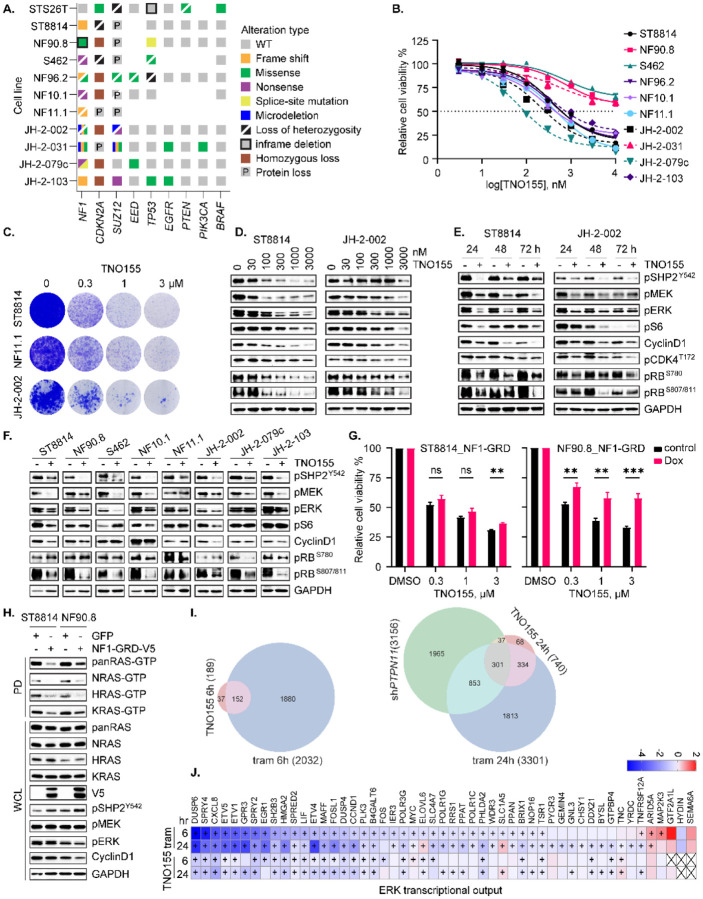
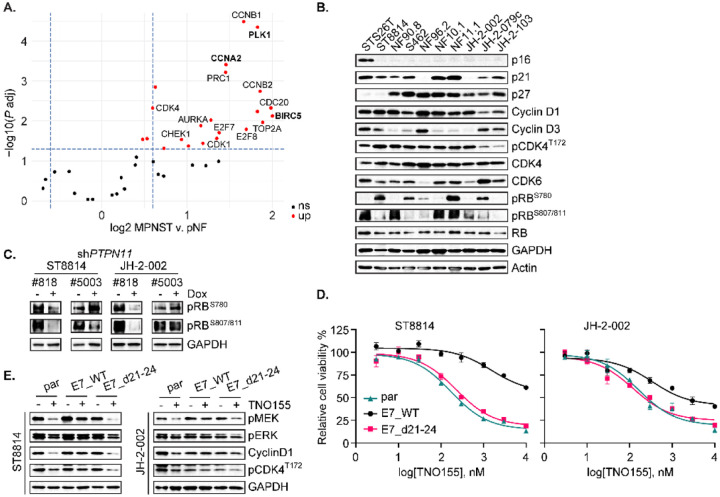
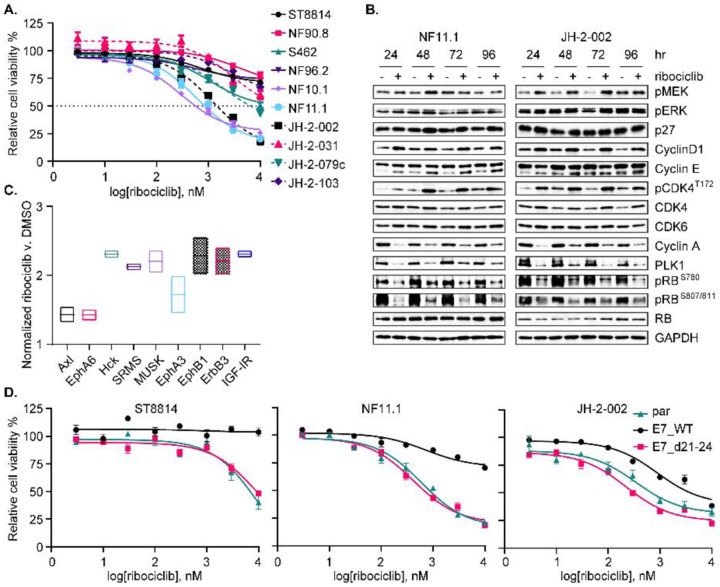
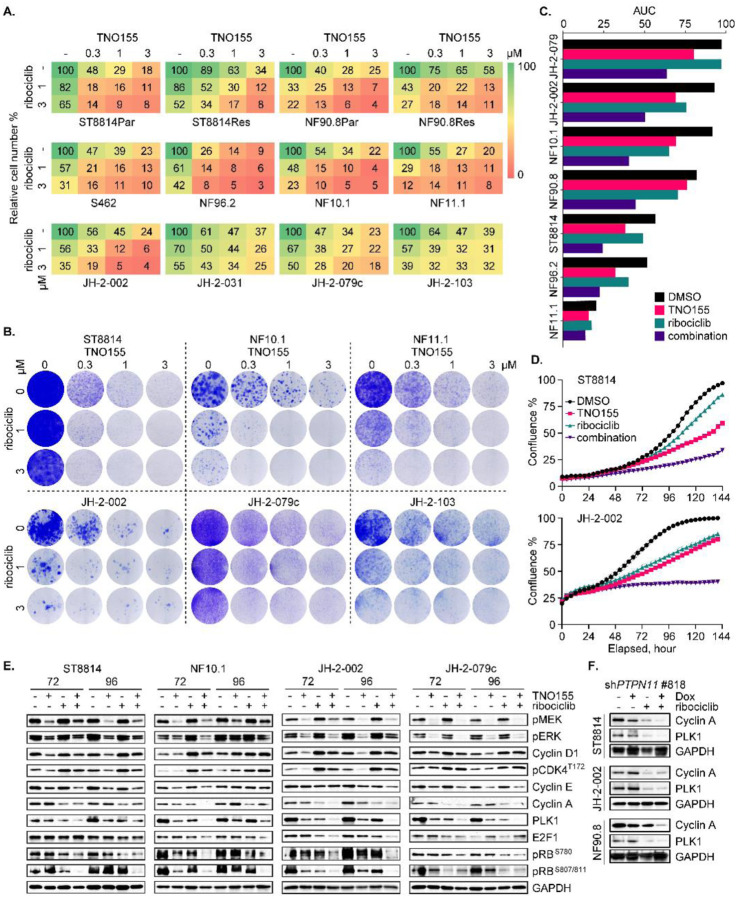
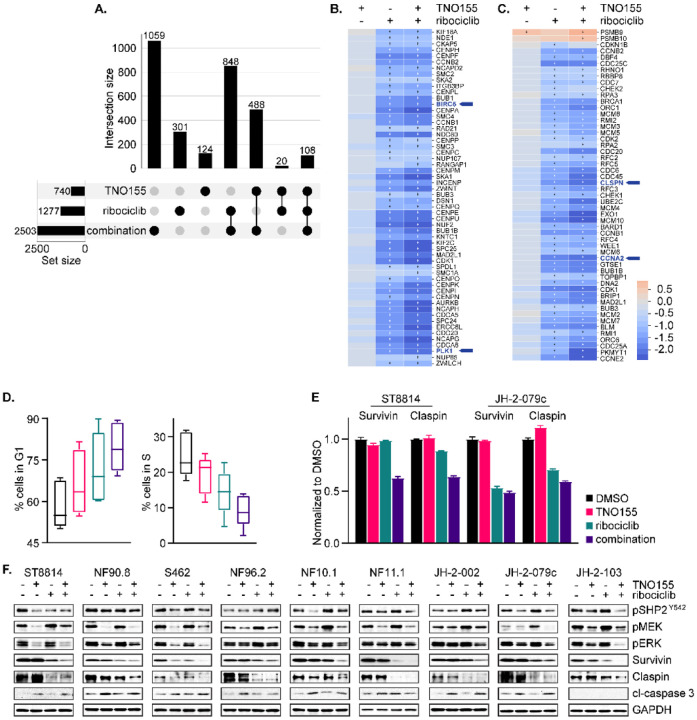
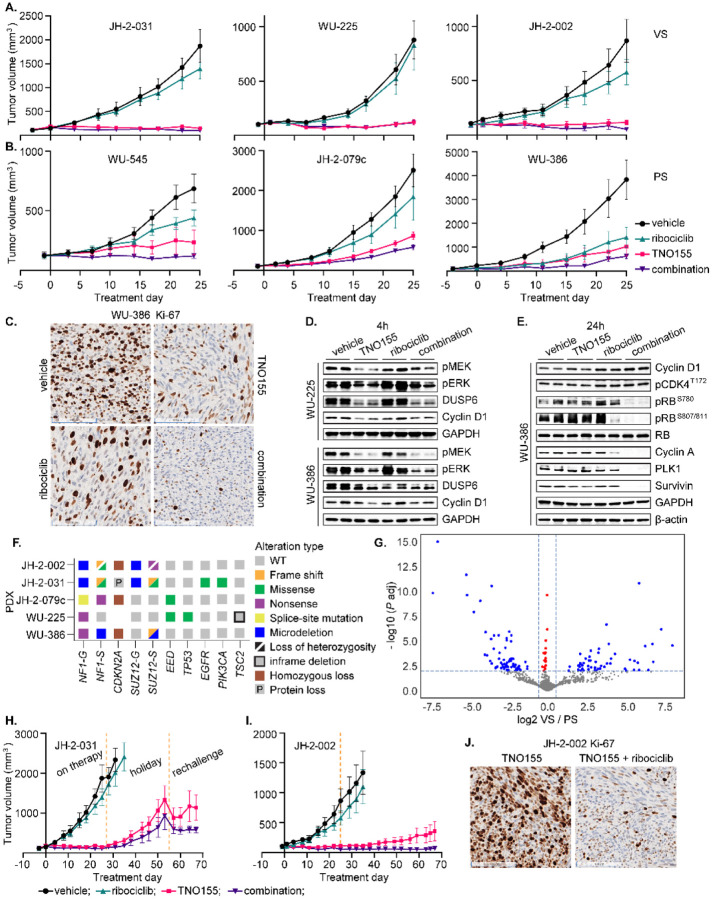
Malignant peripheral nerve sheath tumors (MPNST) are highly aggressive soft tissue sarcomas with limited treatment options, and novel effective therapeutic strategies are desperately needed. We observe anti-proliferative efficacy of genetic depletion or pharmacological inhibition using the clinically available SHP2 inhibitor (SHP2i) TNO155. Our studies into the signaling response to SHP2i reveal that resistance to TNO155 is partially mediated by reduced RB function, and we therefore test the addition of a CDK4/6 inhibitor (CDK4/6i) to enhance RB activity and improve TNO155 efficacy. In combination, TNO155 attenuates the adaptive response to CDK4/6i, potentiates its anti-proliferative effects, and converges on enhancement of RB activity, with greater suppression of cell cycle and inhibitor-of-apoptosis proteins, leading to deeper and more durable anti-tumor activity in in vitro and in vivo patient-derived models of MPNST, relative to either single agent. Overall, our study provides timely evidence to support the clinical advancement of this combination strategy in patients with MPNST and other tumors driven by loss of NF1.


Conflict of interest statement

Competing interests: JW, SEM and CAP have a pending patent related to this study. The authors have no additional financial interests.

Figures

Fig. 1.
Fig. 1.. PTPN11 genetic depletion reduces MPNST cell growth and alters MEK/ERK activity.
(A) ST8814 and JH-2–002 transduced with doxycycline (Dox) inducible constructs expressing shPTPN11 #818 or #5003, were treated with vehicle or 300 ng/ml Dox for two weeks. Cells were fixed with 10% neutral buffered formalin and then stained with crystal violet. (B) Cells as in A. were treated with vehicle or 300 ng/ml Dox for up to seven days. The phase confluence was monitored by Incucyte real-time imaging system, normalized to corresponding 0-hour scan. (C) Cells as in A. were treated with vehicle or 300 ng/ml Dox for 72 hours, and the indicated proteins were assessed using immunoblot. (D) JH-2–002 transduced with Dox-inducible shPTPN11 #818 was treated with vehicle or 300 ng/ml Dox for 72 hours, and then three replicates were collected for RNAseq, and the fourth replicate was collected for immunoblotting validation. RNAseq result revealed a significant decrease in PTPN11 RNA expression (n= 3, P adj= 0, LFC= −4.69) when comparing shPTPN11 v. ctrl. A total of 51 genes representing MEK/ERK transcriptional output (31), were assessed for their expression after PTPN11 knockdown. A volcano plot demonstrating log2 fold change of shPTPN11 v. ctrl as a function of −log10 (P adj) is shown. Black dots= not significant (ns, P adj> 0.05); red dots= log2 fold change (LFC)> 0 and blue dots= LFC< 0 (P adj< 0.05). 73% (37/51) of genes in the set were significantly transcriptionally downregulated following PTPN11 genetic depletion.
Fig. 2.
Fig. 2.. SHP2i TNO155 alters growth and gene expression in NF1-MPNST cells.
(A) Onco-print of key driver genes (NF1, CDKN2A, SUZ12 and EED) in MPNST and putative others across a panel of MPNST cell lines is shown. (B) Ten NF1-associated MPNST cell lines were treated with increasing dose of the SHP2i TNO155 for five days. Cell viability was evaluated by using the cell counting kit-8 (CCK-8) assay measuring metabolic activity. (C) Three NF1-MPNST cell lines were treated with DMSO or TNO155 (0.3, 1 and 3 μM) for about two weeks. Cells were fixed with 10% neutral buffered formalin and then stained with crystal violet. (D-E) ST8814 and JH-2–002 were treated with increasing dose (30–3000 nM) of TNO155 for 24 hours (D) or 0.3 μM TNO155 over a time course (E). Signaling intermediates in ERK and cell cycle pathways were detected using immunoblot. (F) Eight NF1-MPNST cell lines were treated with DMSO or 0.3 μM TNO155 for 48 hours. The representative signal intermediates in ERK and cell cycle pathways were detected using immunoblot. (G) ST8814 and NF90.8 transduced with doxycycline-inducible NF1-GRD (GAP related domain) were pretreated with vehicle control or 300 ng/ml Dox, followed by treatment with DMSO or TNO155 (0.3, 1 and 3 μM) for five days. Cell viability was assessed using CCK-8. (H) ST8814 and NF90.8 transduced with doxycycline-inducible GFP or V5 tagged NF1-GRD were treated with 300 ng/ml Dox for 24 hours. RAS activity and signaling intermediates were detected using immunoblot following the active RAS pull-down assay. PD= pull down; WCL= whole cell lysate. (I) Venn diagram showing the number of overlapped significant genes (P adj<0.05 and |fold change|>1.5) between shPTPN11, TNO155 and trametinib at 6- and 24-hour time points. (J) Heatmap demonstrating changes in transcriptional output of the 51 ERK signature genes, derived from RNAseq analysis of JH-2–002 after DMSO, 0.3 μmol/L TNO155 or 20 nmol/L trametinib treatment (6 and 24 hours).
Fig. 3.
Fig. 3.. Loss of function in RB1 confers resistance to TNO155.
(A) Volcano plot from RNAseq analysis revealing cell cycle dysregulation comparing MPNST v. pNF. (B) Selected cell cycle regulators were evaluated in the nine NF1-associated and one sporadic (STS26T) MPNST cell lines. (C) ST8814 and JH-2–002 transduced with doxycycline (Dox) inducible constructs expressing shPTPN11 #5003 or #818, were treated with vehicle or 300 ng/ml Dox for 72 hours, and RB phosphorylation at serine 780 or serine 807/811 was assessed. (D) ST8814 parental (par), or stable lines transduced with pLXSN-neomycin-E7 WT or E7 d21–24 mutant; and JH-2–002 parental, or stable lines transduced with pMSCV-puromycin-E7 WT or E7 d21–24 mutant, were treated with increasing dose of TNO155 for five days. Cell viability was evaluated by using the CCK-8 assay. (E) Cells as in D. were treated with DMSO or 0.3 μmol/L TNO155 for 48 hours.
Fig. 4.
Fig. 4.. Responses of NF1-MPNST cells to the CDK4/6i ribociclib.
(A) Ten NF1-associated MPNST cell lines were treated with increasing dose of the CDK4/6i ribociclib for five days. Cell viability was evaluated by using the CCK-8 assay. (B) Two NF1-MPNST cell lines were treated with DMSO or 1 μmol/L ribociclib over a time course. Signal intermediates in ERK and cell cycle pathways were assessed. (C) JH-2–002 cells were treated with DMSO or 1 μmol/L ribociclib for 24 hours. 71 phosphorylated human receptor tyrosine kinases (RTK) were evaluated using human RTK phosphorylation array C1. Signal intensity from technical duplicates was quantified using densitometry analysis, normalized to ribociclib v. DMSO, and significantly altered RTKs are shown. (D) Cells as in Fig 3E were treated with increasing doses of ribociclib for five days. Cell viability was evaluated by using the CCK-8 assay.
Fig. 5.
Fig. 5.. Combined inhibition of SHP2 and CDK4/6 effectively suppresses MPNST cell growth.
(A) ST8814 and NF90.8 parental (Par) and trametinib-resistant (Res) lines, and eight NF1-MPNST cell lines were treated with DMSO, TNO155 (0.3, 1 and 3 μmol/L), ribociclib (1 and 3 μmol/L) and their combination for 7–10 days. Direct cell counting using trypan blue exclusion assay was performed by TC20 automated cell counter. (B) Cells as in A. were treated with drugs for 2–3 weeks, and colony formation was evaluated using crystal violet assay. (C) Area under the curve (AUC) is calculated based on the Incucyte cell confluence monitoring of the seven cell lines as shown, treated with DMSO, TNO155 (0.3 μmol/L), ribociclib (1 μmol/L) and their combination for six days. (D) Two NF1-MPNST cell lines were treated with DMSO, TNO155 (0.3 μmol/L), ribociclib (1 μmol/L) and their combination for six days. Cell confluence was monitored using Incucyte imaging systems. (E) Four NF1-MPNST cell lines were treated with DMSO, 0.3 μmol/L TNO155 and/or 1 μmol/L ribociclib for 72 and 96 hours. ERK signaling and cell cycle regulators were evaluated using immunoblot. (F) Three NF1-MPNST cell lines transduced with shPTPN11 #818 were pretreated with vehicle or 300 ng/ml Dox for 72 hours, followed by treatment with DMSO or 1 μmol/L ribociclib for additional 72 hours. Cell lysates were assessed for expression of the indicated proteins.
Fig. 6.
Fig. 6.. Combination of TNO155 and ribociclib additively inhibits cell cycle and induces apoptosis.
(A) Upset matrix plot derived from RNAseq analysis, showing the overlapping numbers of significant genes (P adj< 0.05 and |FC|> 1.5) after 24-hour treatment with 0.3 μmol/L TNO155, 1 μmol/L ribociclib and their combination, normalized to DMSO control. (Rows=the sets; Columns=intersections between these sets). (B and C) Heatmaps demonstrating the more potent transcriptional inhibition of mitotic prometaphase (B) and cell cycle checkpoints (C) by combined TNO155+ribociclib relative to either single agent alone, highlighting BIRC5, PLK1, CLSPN and CCNA2. + = significance. (D) Five NF1-MPNST cell lines were treated with DMSO, 0.3 μmol/L TNO155 and/or 1 μmol/L ribociclib for 48 hours, following overnight starvation in 0.1% FBS-containing culture medium to synchronize cells. Cells were fixed in ice cold 70% ethanol and stained with propidium iodide/ RNase staining solution (Cell Signaling Technology, #4087), and then analyzed by flow cytometry. (E) ST8814 and JH-2–079c were treated with DMSO, 0.3 μmol/L TNO155 and/or 1 μmol/L ribociclib for 48 hours, and then protein lysates were assessed using human apoptosis antibody array (R&D systems, #ARY009). Signal intensity from technical duplicates was quantified by densitometry analysis using image J and normalized to DMSO. Data represent mean ± SEM. (F) Nine NF1-MPNST cell lines were treated as in E. and the indicated proteins involved in apoptosis and ERK signaling were detected using immunoblot.
Fig. 7.
Fig. 7.. The combination of TNO155 and ribociclib is active against MPNST tumor growth in vivo.
(A-B) 5- to 6-week-old female NRG mice bearing six individual NF1-MPNST patient-derived xenografts (PDX) were treated with vehicle, ribociclib (75 mg/kg, once daily), TNO155 (7.5 mg/kg, twice daily) or their combination by oral gavage for about four weeks. Tumor size was measured twice weekly. Average tumor volume of 4–5 mice per arm was plotted over the time course of treatment days. VS= very sensitive; PS= partially sensitive. (C) Tumors of each arm from the PDX WU-386 were harvested four hours post last dose of 4 weeks on drugs and fixed in 10% NBF. The Ki-67 expression was assessed using IHC. (D-E) Tumors of each arm from the PDX WU-225 and WU-386 were harvested 4 hours post last dose, 4 weeks on drugs (D), or 24 hours post last dose, 3 days on drugs (E). The indicated proteins involved in ERK and cell cycle signaling were detected by immunoblot. (F). Onco-print of key driver genes (NF1, CDKN2A, SUZ12 and EED) in MPNST and putative others across a panel of MPNST PDX is shown. For NF1 and SUZ12, both germline (G) and somatic (S) mutations are shown. (G) Volcano plot demonstrating log2 fold change of VS/PS as a function of −log10 (P adj). Blue dots represent 227 genes that were significantly altered (P adj< 0.05 and |L2FC| > 0.585) when comparing the RNA seq data of VS (JH-2–031, WU-225 and JH-2–002) v. PS (WU-545, JH-2–079c and WU-386). (H) The mice bearing the PDX JH-2–031 were on initial treatment as in A. for about four weeks, and then left untreated for another four weeks before rechallenging with the combination for additional two weeks. (I) The mice bearing the PDX JH-2–002 as in A. were continuously on treatment for ten weeks. (J) Tumors of each arm from the PDX JH-2–002 were harvested four hours post last dose of 10 weeks on drugs and fixed in 10% NBF. The Ki-67 expression was assessed using IHC.

References

    1. Ducatman B. S., Scheithauer B. W., Piepgras D. G., Reiman H. M., Ilstrup D. M., Malignant peripheral nerve sheath tumors. A clinicopathologic study of 120 cases. Cancer 57, 2006–2021 (1986). - PubMed
    1. Evans D. G. et al. , Malignant peripheral nerve sheath tumours in neurofibromatosis 1. J Med Genet 39, 311–314 (2002). - PMC - PubMed
    1. Shurell E. et al. , Gender dimorphism and age of onset in malignant peripheral nerve sheath tumor preclinical models and human patients. BMC Cancer 14, 827 (2014). - PMC - PubMed
    1. Brohl A. S., Kahen E., Yoder S. J., Teer J. K., Reed D. R., The genomic landscape of malignant peripheral nerve sheath tumors: diverse drivers of Ras pathway activation. Sci Rep 7, 14992 (2017). - PMC - PubMed
    1. Lee W. et al. , PRC2 is recurrently inactivated through EED or SUZ12 loss in malignant peripheral nerve sheath tumors. Nat Genet 46, 1227–1232 (2014). - PMC - PubMed

Publication types