[Preprint]. 2023 Feb 1:2023.02.01.526586.
doi: 10.1101/2023.02.01.526586.

Eukaryotic-like gephyrin and cognate membrane receptor coordinate corynebacterial cell division and polar elongation

Affiliations

Eukaryotic-like gephyrin and cognate membrane receptor coordinate corynebacterial cell division and polar elongation

M Martinez et al. bioRxiv. .

Update in

Abstract

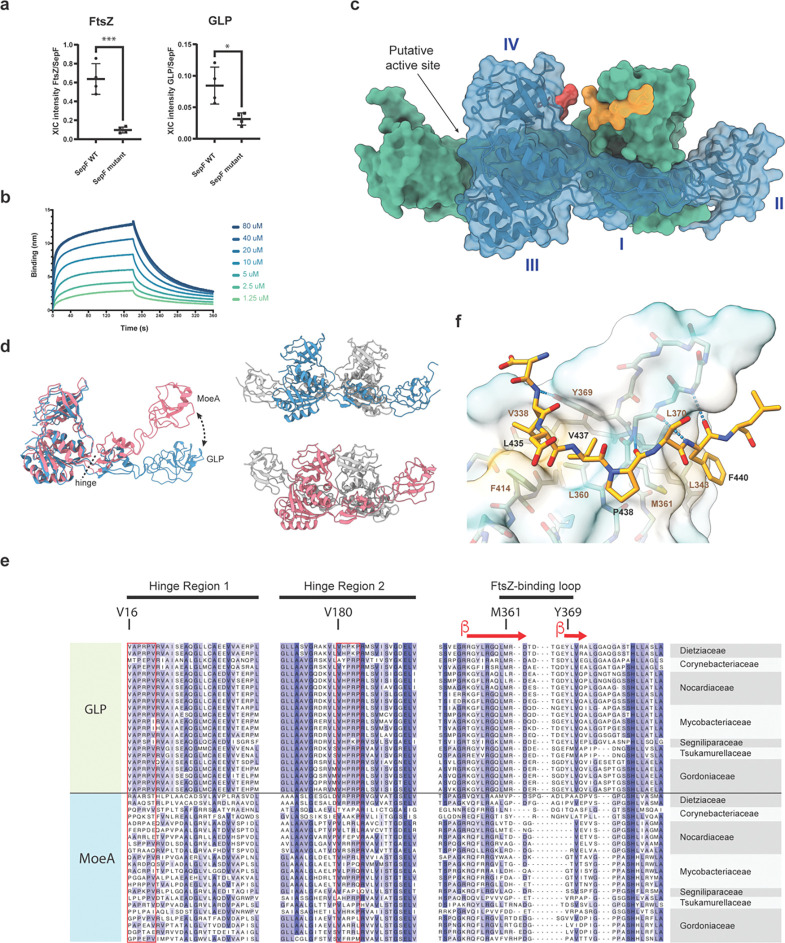
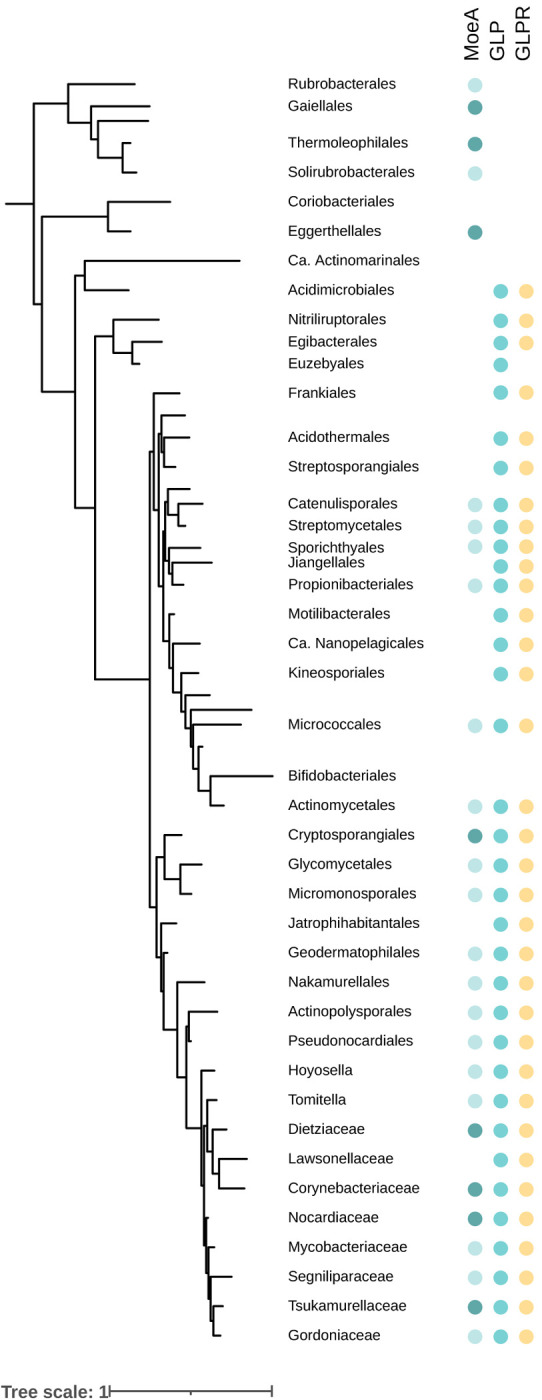
The order Corynebacteriales includes major industrial and pathogenic actinobacteria such as Corynebacterium glutamicum or Mycobacterium tuberculosis . Their elaborate multi-layered cell wall, composed primarily of the mycolyl-arabinogalactan-peptidoglycan complex, and their polar growth mode impose a stringent coordination between the septal divisome, organized around the tubulin-like protein FtsZ, and the polar elongasome, assembled around the tropomyosin-like protein Wag31. Here, we report the identification of two new divisome members, a gephyrin-like repurposed molybdotransferase (GLP) and its membrane receptor (GLPR). We show that the interplay between the GLPR/GLP module, FtsZ and Wag31 is crucial for orchestrating cell cycle progression. Our results provide a detailed molecular understanding of the crosstalk between two essential machineries, the divisome and elongasome, and reveal that Corynebacteriales have evolved a protein scaffold to control cell division and morphogenesis similar to the gephyrin/GlyR system that in higher eukaryotes mediates synaptic signaling through network organization of membrane receptors and the microtubule cytoskeleton.


Conflict of interest statement

Competing interests

The authors declare no competing financial interests.

Figures

Figure 1:
Figure 1:. Identification of GLP as a new member of the corynebacterial divisome.
(a) The core interactome of SepF, including proteins recovered from 3 independent co-IP experiments using different strains/antibodies: Cglu/α-SepF; Cglu_SepF-Scarlet/α-SepF and Cglu_SepF-Scarlet/α-Scarlet; performing for each one pairwise comparisons with controls. (Table S1 and Figure S1a). The square size for each interactor is proportional to its enrichment in the interactome compared to the proteome (Table S1). (b) GLP depletion. Representative images in phase contrast (upper row) and membrane staining (nile red) fluorescent signal (lower row) of Cglu_Δglp and Cglu. Frequency histogram indicating the number of septa per cell for Cglu (yellow) and Cglu_Δglp (red), calculated from n cells imaged from 3 independent experiments for each strain (Cglu, n=718, 1468 and 1223; Cglu_Δglp, n=873, 1538 and 840); bars represent the mean ± SD. Violin plots showing the distribution of cell length (***, d = 1,76, p ~ 0) and cell width (****, d = 2,21, p ~ 0) for Cglu (in yellow) and Cglu_Δglp (in red); the number of cells used (n) is indicated below each violin plot (cells from triplicate experiments); the box indicates the 25th to the 75th percentile, the mean and the median are indicated with a dot and a line in the box, respectively. (c) Ethambutol sensitivity assay. BHI overnight cultures of Cglu and Cglu_Δglp complemented with the empty plasmid or mNeon-GLP were normalized to an OD600 of 0.5, serially diluted 10-fold, and spotted onto BHI agar medium with or without 1 μg/ml (d) Localization of mNeon-GLP in Cglu. Representative images in phase contrast, membrane staining and mNeon-GLP fluorescent signal for the Cglu. The arrow indicates the GLP localization prior to septum formation. Heatmap representing the localization pattern of mNeon-GLP; 3879 cells were analyzed, from triplicate experiments. Scale bars 5μm. (e) Maximum likelihood phylogeny of MoeA paralogs in Actinobacteria. Clades with a green background correspond to GLP, while clades in gray correspond to other MoeA paralogs. The genomic context of GLP/MoeA is indicated for each gene present in Cglu (Cgl locus tag) and M. tuberculosis (Rv locus tag) genomes. Monophyletic classes were collapsed into a single branch for clarity. Dots indicate UFB > 0.85. The scale bar represents the average number of substitutions per site. For the detailed tree, see Supporting Data.
Figure 2:
Figure 2:. GLP-FtsZ interaction.
(a) Comparison of the recovery of FtsZ and GLP in co-IP of Cglu_SepF-Scarlet-/α-Scarlet and the mutant unable to bind FtsZ (SepFK125E/F131A-Scarlet) using α-Scarlet. Each point corresponds to the normalized XIC intensity in each replicate of each condition, calculated as described in methods section; mean and SD are shown. Statistical analysis was performed using unpaired Student’s t-test (p < 0.05). FtsZ fold change = 6.61 (p value 0.0006); GLP fold change = 2.70 (p value 0.014). The corresponding analysis for each of the 11 core interactors is shown in Table S1b. (b) Sensorgrams of GLP binding to immobilized SUMO-FtsZ by biolayer interferometry. A series of measurements using a range of concentrations for GLP (inset) was carried out to derive the equilibrium dissociation constant (Kd) (fitting shown in Figure S3a). (c) Crystal structure of the GLP homodimer (blue and green) in complex with FtsZCTD (yellow and red). The GLP monomer is composed of 4 structural domains (labelled I-IV in the blue monomer): domain I (residues 20–45 and 146–181), domain II (residues 46–145), domain III (residues 1–19 and 182–331), and domain IV (residues 332–417). The location of the putative active site at the distal dimer interface is also indicated. (d) Left panel: The superposition of the monomers from GLP (blue) and MoeA from E. coli (pink, pdb 1g8l) reveals a pronounced conformational change from a hinge region at the interface between domain I and III. This change leads to a central open (GLP, blue) or closed (MoeA, pink) conformation in the respective homodimers (right panel). (e) Partial alignment of three selected regions from MoeA paralogs in Corynebacteriales. Sequences of GLP and MoeA are shown for the same species, representatives of all Corynebacteriales families. The FtsZ-binding loop is delimited by the key residues methionine (M361) and tyrosine (Y369) indicated according to their position on the Cglu sequence. The Pro-rich hinge regions 1 and 2 are indicated by a red rectangle and the first residue inside the box is numbered and highlighted above. (f) Detailed view of FtsZ-GLP interactions. Residues involved in protein-protein interactions are labelled, the molecular surface of GLP is shown according to hydrophobicity (yellow=hydrophobic, green=hydrophilic), and intermolecular hydrogen bonds are shown as blue dotted lines.
Figure 3:
Figure 3:. Phyletic pattern for the presence of MoeA, GLP and GLPR in Actinobacteria.
Full circles indicate presence of the gene in more than 50% of the analyzed genomes of the phylum. Column MoeA indicates the presence of one (light blue) or more (dark blue) paralogs, except for GLP that is indicated in a separate column. The presence of GLPR is indicated by yellow dots. The phyletic pattern is represented on a reference Actinobacteria tree. Actinobacteria classes were collapsed into a single branch for clarity. Dots indicate UFB > 0.85. The scale bar represents the average number of substitutions per site. For the detailed tree see Figure S4, and for the detailed analysis see Table S3.
Figure 4:
Figure 4:. Identification of GLPR as a membrane receptor for GLP.
(a) Schematic representation of GLPR, with the 3 transmembrane segments and the short external loops shown in green and the intrinsically disordered regions IDR1 (residues 27–218) and IDR2 (residues 263–340) in red and blue, respectively. The two IDRs are highly charged, with theoretical isoelectric points (pI) of 4.05 (IDR1) and 10. 87 (IDR2). (b) Sensorgrams of GLP binding to immobilized GLPR by biolayer interferometry. A series of measurements using a range of concentrations for GLP (inset) was carried out to derive the equilibrium dissociation constant (Kd) (see Figure S5a). (c) Comparison of the GLP-FtsZCTD complex (red, left panel) with the Gephyrin-GlyR complex (blue, right panel, PDB code: 2fts). In both cases the FtsZCTD and GlyR peptides (molecular surfaces) bind the domain IV (in colour) of GLP and gephyrin respectively. (d) Cell fractionation and subcellular localization of GLP. Total (T), soluble (S) and membrane (M) fractions of Cglu or Cglu_xglpr strains were obtained by differential centrifugation and analyzed by Western blot using an α-GLP antibody.
Figure 5:
Figure 5:. GLPR links the mid-cell divisome with the future polar elongasome via Wag31.
(a) Representative images GLPR-mNeon expressed in Cglu and Cglu_Δglpr. The heatmap of the localization pattern of GLPR-mNeon in Cglu; 111 cells were analyzed. (b) Violin plots of cell length distribution for Cglu_Δglpr + GLPR-mNeon (light green), Cglu + GLPR-mNeon (dark green) and Cglu (yellow). Significance indicated corresponds to values of Cohen’s d: (**, d = 0,98, p = 2,88e-85), (ns, d = 0,49, p = 6,34e-19), (ns, d = 0,39, p = 2,78e-13)). The corresponding Western Blots are shown in Figure S6d. (c) Representative images of Cglu_Δglpr complemented with GLPR-mNeon, GLPR, or GLPRΔIDR2 (in overexpression conditions of 1% gluconate). (d) Violin plots showing the distribution of cell surface areas for Cglu_Δglpr + GLPR-mNeon (green), Cglu_Δglpr + GLPRΔIDR2 (orange) and Cglu (yellow). For Cglu_Δglpr + GLPR-mNeon, only cells showing a mean intensity of mNeon fluorescence greater than 35000 were considered, to discard cells that lost the plasmid. Significance Cohen’s d: (****, d = 3,95, p = 7,34e-63), (****, d = 2,35, p = 1,01e-46), (***, d = 1,4, p = 5,37e-319)). The Western blots of whole cell extracts of all those strains are shown in Figure S6e. (e) Violin plots of cell length distribution for Cglu_Δglpr + GLPR (blue), Cglu + GLPRΔIDR2 (orange) and Cglu (yellow) and Cglu_Δglp (violet). Cohen’s d: (**, d = 1,17, p = 7,22e-255), (*, d = 0,61, p = 3,07e-60), (ns, d = 0,49, p = 8,12e-34), (*, d = 1,70, p = 6,24e-138, for Cglu + GLPRΔIDR2 vs Cglu_Δglp)). (f) Frequency histogram of the number of septa per cell for Cglu (yellow), Cglu_Δglp + GLPRΔIDR2 (orange) and Cglu_Δglp (violet), calculated from n cells from 3 independent experiments (Cglu, n=718, 1468 and 1223; Cglu_Δglp + GLPRxIDR2, n = 451, 737 and 841; Cglu_Δglp, n=873, 1538 and 840); bars represent the mean ± SD. For all violin plots: The box indicates the 25th to the 75th percentile, mean and median are indicated with a dot and a line in the box, respectively. The number of cells used in the analyses (n) below each violin representation corresponds to triplicates. (g) Localization of Wag31-mNeon in the multiseptated Cglu_Δglp strain (in overexpression conditions of 1% gluconate). Representative images are shown for phase contrast, Wag31-mNeon and nile red (membrane). The arrows indicate septum rounding inside the cell upon Wag31-mNeon overexpression in Cglu_Δglp. Scale bars 5μm. (h) Co-IP of GLPR-Wag31 in Cglu, Cgluglp and Cgluglpr strains. GLPR was used as bait. Total (T), wash (W) and elution (E) fractions were analyzed by Western blot using α-GLPR and α-Wag31 antibodies. Arrows indicate GLPR (top) and Wag31 (bottom). (i) Comparison of Wag31 recovery in co-IPs of GLP from Cglu and Cglu_Δglpr strains. Each point corresponds to the normalized XIC intensity in each replicate of each condition; mean and SD are shown. Statistical analysis was performed using unpaired Student’s t-test (p < 0.05). Wag31 fold change = 1.78 (p value 0.004). (j) Sensorgrams of Wag31 binding to immobilized GLPR by biolayer interferometry. A series of measurements using a range of concentrations for Wag31 was carried out to derive the equilibrium dissociation constant (Kd) (Figure S7a).
Figure 6:
Figure 6:. Interaction network and proposed function for GLP-GLPR.
(a) The known direct interactions and their associated apparent Kd values. Note that the SepF-FtsZ was determined using SPR (Sogues et al, 2020), whereas all other measurements were done with BLI (this work). (b) Working model on the roles of GLP-GLPR-Wag31 in the divisome-elongasome transition during cytokinesis in Corynebacteriales. At the septum, GLP-GLPR would control the functional status of Wag31 and prevent a premature pole formation through excessive Wag31 accumulation. Once cell division is completed, this septal control on Wag31 will disappear and an elongation competent cell pole can form.

References

    1. Hirota H., Ryter A., and Jacob F. (1968). Thermosensitive Mutants of E. coli Affected in the Processes of DNA Synthesis and Cellular Division. Cold Spring Harb Symp Quant Biol 33, 677–693. - PubMed
    1. McQuillen R., and Xiao J. (2020). Insights into the Structure, Function, and Dynamics of the Bacterial Cytokinetic FtsZ-Ring. Annu Rev Biophys 49, 1–33. 10.1146/annurev-biophys-121219-081703. - DOI - PMC - PubMed
    1. Blaauwen T. den, Hamoen L.W., and Levin P.A. (2017). The divisome at 25: the road ahead. Curr Opin Microbiol 36, 85–94. 10.1016/j.mib.2017.01.007. - DOI - PMC - PubMed
    1. Du S., and Lutkenhaus J. (2019). At the Heart of Bacterial Cytokinesis: The Z Ring. Trends Microbiol 27, 781–791. 10.1016/j.tim.2019.04.011. - DOI - PMC - PubMed
    1. Donovan C., and Bramkamp M. (2014). Cell division in Corynebacterineae. Front Microbiol 5. 10.3389/fmicb.2014.00132. - DOI - PMC - PubMed

Publication types