

This is a preprint.
FDX1 regulates cellular protein lipoylation through direct binding to LIAS
- PMID: 36778498
- PMCID: PMC9915701
- DOI: 10.1101/2023.02.03.526472
FDX1 regulates cellular protein lipoylation through direct binding to LIAS
Update in
-
FDX1 regulates cellular protein lipoylation through direct binding to LIAS.J Biol Chem. 2023 Sep;299(9):105046. doi: 10.1016/j.jbc.2023.105046. Epub 2023 Jul 13. J Biol Chem. 2023. PMID: 37453661 Free PMC article.
Abstract
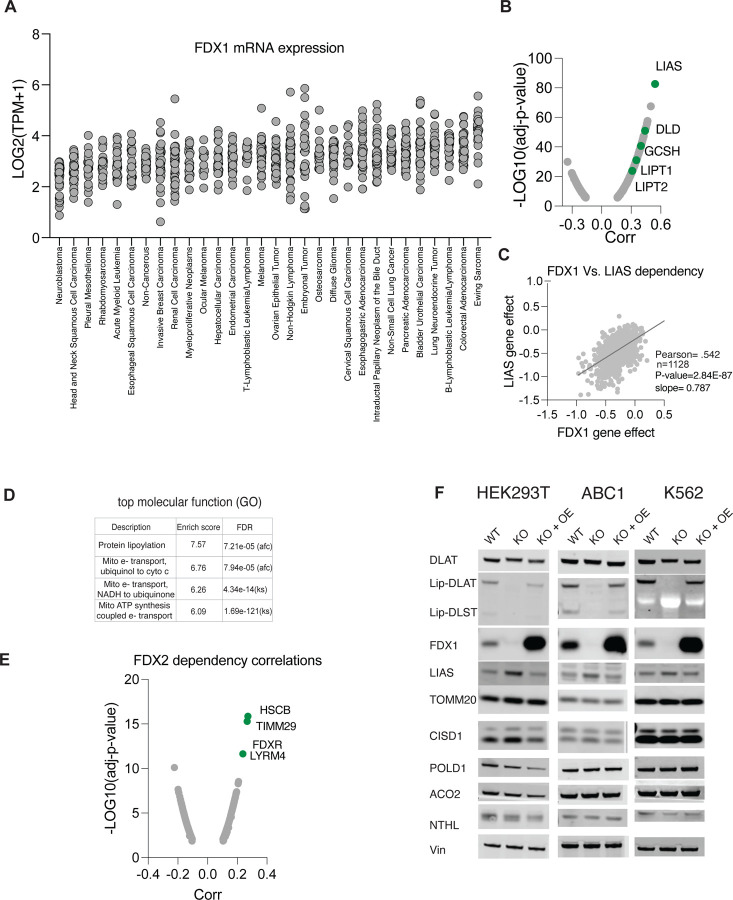
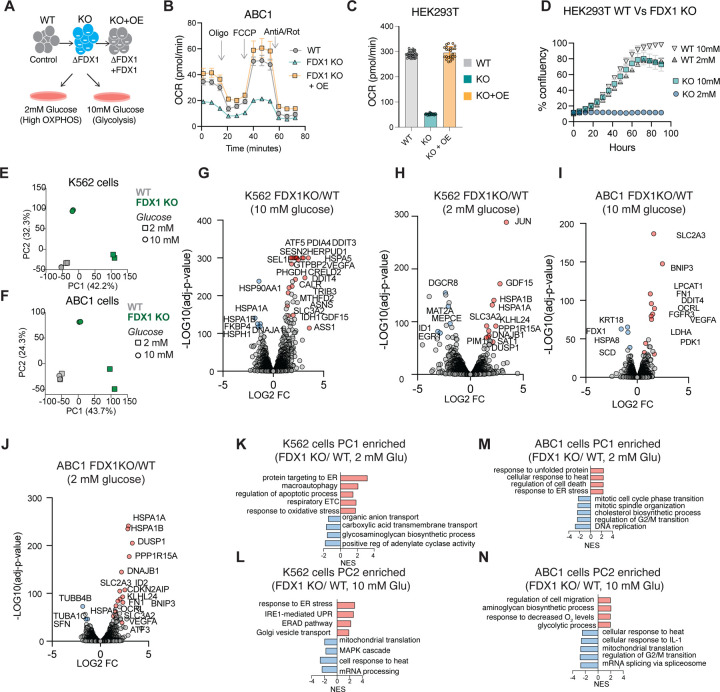
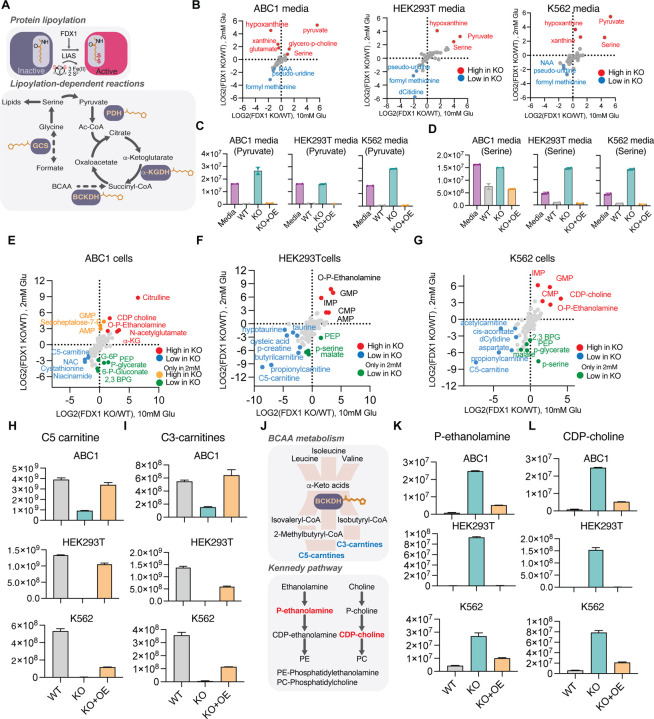
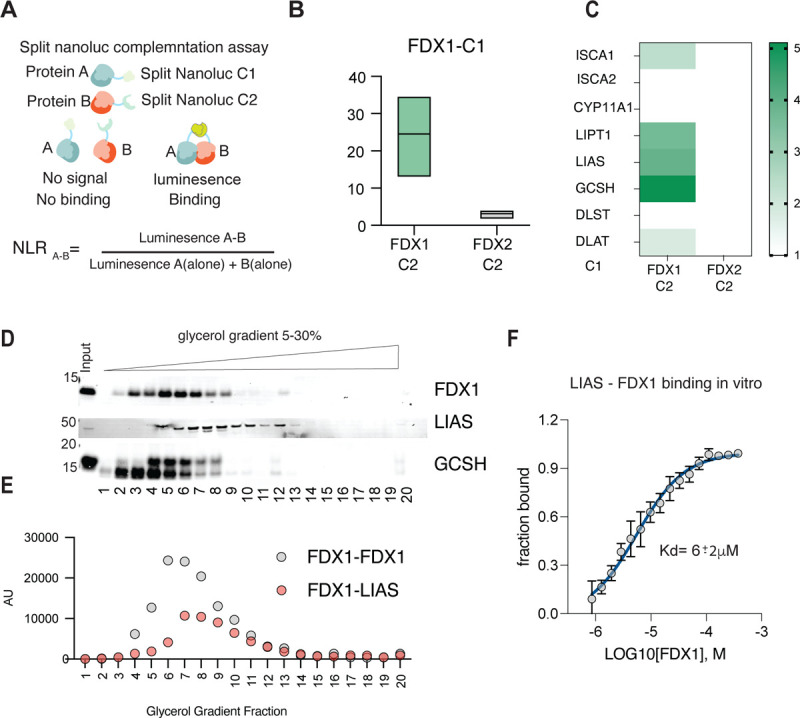
Ferredoxins are a family of iron-sulfur (Fe-S) cluster proteins that serve as essential electron donors in numerous cellular processes that are conserved through evolution. The promiscuous nature of ferredoxins as electron donors enables them to participate in many metabolic processes including steroid, heme, vitamin D and Fe-S cluster biosynthesis in different organisms. However, the unique natural function(s) of each of the two human ferredoxins (FDX1 and FDX2) are still poorly characterized. We recently reported that FDX1 is both a crucial regulator of copper ionophore induced cell death and serves as an upstream regulator of cellular protein lipoylation, a mitochondrial lipid-based post translational modification naturally occurring on four mitochondrial enzymes that are crucial for TCA cycle function. Here we show that FDX1 regulates protein lipoylation by directly binding to the lipoyl synthase (LIAS) enzyme and not through indirect regulation of cellular Fe-S cluster biosynthesis. Metabolite profiling revealed that the predominant cellular metabolic outcome of FDX1 loss-of-function is manifested through the regulation of the four lipoylation-dependent enzymes ultimately resulting in loss of cellular respiration and sensitivity to mild glucose starvation. Transcriptional profiling of cells growing in either normal or low glucose conditions established that FDX1 loss-of-function results in the induction of both compensatory metabolism related genes and the integrated stress response, consistent with our findings that FDX1 loss-of-functions is conditionally lethal. Together, our findings establish that FDX1 directly engages with LIAS, promoting cellular protein lipoylation, a process essential in maintaining cell viability under low glucose conditions.
Conflict of interest statement
Conflict of interest
PT is a consultant and has received research funding from Riva Therapeutics.
Figures
Similar articles
-
FDX1 regulates cellular protein lipoylation through direct binding to LIAS.J Biol Chem. 2023 Sep;299(9):105046. doi: 10.1016/j.jbc.2023.105046. Epub 2023 Jul 13. J Biol Chem. 2023. PMID: 37453661 Free PMC article.
-
Functional spectrum and specificity of mitochondrial ferredoxins FDX1 and FDX2.Nat Chem Biol. 2023 Feb;19(2):206-217. doi: 10.1038/s41589-022-01159-4. Epub 2022 Oct 24. Nat Chem Biol. 2023. PMID: 36280795 Free PMC article.
-
Humans possess two mitochondrial ferredoxins, Fdx1 and Fdx2, with distinct roles in steroidogenesis, heme, and Fe/S cluster biosynthesis.Proc Natl Acad Sci U S A. 2010 Jun 29;107(26):11775-80. doi: 10.1073/pnas.1004250107. Epub 2010 Jun 14. Proc Natl Acad Sci U S A. 2010. PMID: 20547883 Free PMC article.
-
Mitochondrial [2Fe-2S] ferredoxins: new functions for old dogs.FEBS Lett. 2023 Jan;597(1):102-121. doi: 10.1002/1873-3468.14546. Epub 2022 Dec 7. FEBS Lett. 2023. PMID: 36443530 Review.
-
The molecular mechanisms of cuproptosis and its relevance to cardiovascular disease.Biomed Pharmacother. 2023 Jul;163:114830. doi: 10.1016/j.biopha.2023.114830. Epub 2023 May 8. Biomed Pharmacother. 2023. PMID: 37150036 Review.
References
-
- Hall D. O., Cammack R., and Rao K. K. (1971) Role for ferredoxins in the origin of life and biological evolution. Nature 233, 136–138 - PubMed
-
- Ewen K. M., Kleser M., and Bernhardt R. (2011) Adrenodoxin: the archetype of vertebrate-type [2Fe-2S] cluster ferredoxins. Biochim Biophys Acta 1814, 111–125 - PubMed
-
- Ewen K. M., Ringle M., and Bernhardt R. (2012) Adrenodoxin--a versatile ferredoxin. IUBMB Life 64, 506–512 - PubMed
-
- Grinberg A. V., Hannemann F., Schiffler B., Muller J., Heinemann U., and Bernhardt R. (2000) Adrenodoxin: structure, stability, and electron transfer properties. Proteins 40, 590–612 - PubMed
-
- Miller W. L. (2005) Minireview: regulation of steroidogenesis by electron transfer. Endocrinology 146, 2544–2550 - PubMed
Publication types
Grants and funding
LinkOut - more resources
Full Text Sources
Miscellaneous