[Preprint]. 2023 Jan 30:rs.3.rs-1647827.
doi: 10.21203/rs.3.rs-1647827/v1.

Peripheral immune-derived matrix metalloproteinase promotes stress susceptibility

Affiliations

Peripheral immune-derived matrix metalloproteinase promotes stress susceptibility

Flurin Cathomas et al. Res Sq. .

Update in

  • Circulating myeloid-derived MMP8 in stress susceptibility and depression.
    Cathomas F, Lin HY, Chan KL, Li L, Parise LF, Alvarez J, Durand-de Cuttoli R, Aubry AV, Muhareb S, Desland F, Shimo Y, Ramakrishnan A, Estill M, Ferrer-Pérez C, Parise EM, Wilk CM, Kaster MP, Wang J, Sowa A, Janssen WG, Costi S, Rahman A, Fernandez N, Campbell M, Swirski FK, Nestler EJ, Shen L, Merad M, Murrough JW, Russo SJ. Cathomas F, et al. Nature. 2024 Feb;626(8001):1108-1115. doi: 10.1038/s41586-023-07015-2. Epub 2024 Feb 7. Nature. 2024. PMID: 38326622 Free PMC article.

Abstract

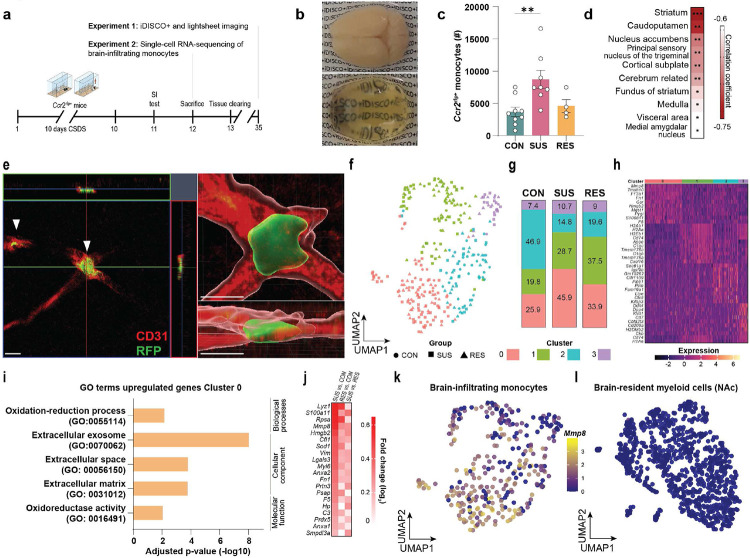
Psychosocial stress has profound effects on the body, including the peripheral immune system and the brain1,2. Although a large number of pre-clinical and clinical studies have linked peripheral immune system alterations to stress-related disorders such as major depressive disorder (MDD)3,4,5, the underlying mechanisms are not well understood. Here we show that a peripheral myeloid cell-specific proteinase, matrix metalloproteinase 8 (MMP8), is elevated in serum of subjects with MDD as well as in stress-susceptible (SUS) mice following chronic social defeat stress (CSDS). In mice, we show that this increase leads to alterations in extracellular space and neurophysiological changes in the nucleus accumbens (NAc), thereby altering social behaviour. Using a combination of mass cytometry and single-cell RNA-sequencing, we performed high-dimensional phenotyping of immune cells in circulation and brain and demonstrate that peripheral monocytes are strongly affected by stress. Both peripheral and brain-infiltrating monocytes of SUS mice showed increased Mmp8 expression following CSDS. We further demonstrate that peripheral MMP8 directly infiltrates the NAc parenchyma to control the ultrastructure of the extracellular space. Depleting MMP8 prevented stress-induced social avoidance behaviour and alterations in NAc neurophysiology and extracellular space. Collectively, these data establish a novel mechanism by which peripheral immune factors can affect central nervous system function and behaviour in the context of stress. Targeting specific peripheral immune cell-derived matrix metalloproteinases could constitute novel therapeutic targets for stress-related neuropsychiatric disorders.


Figures

Extended Data Fig. 1.
Extended Data Fig. 1.. High-dimensional phenotyping of immune cells in brain and blood with CyTOF (Cytometry by time-of-flight).
a, Gating strategy for live CD45+ cells. b, Social interaction ratio and c, locomotion of unstressed control (CON), susceptible (SUS) and resilient (RES) mice (behavioural data from blood CyTOF experiment). d, Marker expression and assigned leukocyte subpopulations in blood. e, Leukocyte subpopulation frequencies in blood. f, Social interaction ratio and g, locomotion of CON, SUS and RES mice (behavioural data from brain CyTOF experiment). h, Marker expression and assigned leukocyte subpopulations of CD45+ brain leukocytes. i, Leukocyte subpopulation frequencies in brain. (One-way ANOVA with Bonferroni post hoc test; for blood, each data point represents one biological sample; for brain, each data point represents four pooled brains). * p < 0.05, *** p < 0.001. Data are shown as means ± s.e.m. Abbreviations: moDCs: Monocyte-derived dendritic cells; NK cells: Natural killer cells; BAM: Border-associated macrophages.
Extended Data Fig. 2.
Extended Data Fig. 2.. Leukocyte subpopulation frequencies in patients with major depressive disorder (MDD) compared to healthy controls (HC).
Number of a, total leukocytes, b, eosinophils, c, lymphocytes, d, platelets and e, red blood cells in patients with MDD compared to HC. (Two-tailed Student’s t-test [all panels]). *** p < 0.001.
Extended Data Fig. 3.
Extended Data Fig. 3.. Cell type-specific RNA-sequencing of leukocyte subpopulations in circulation.
a, Social interaction ratio and b, locomotion of unstressed control (CON), susceptible (SUS) and resilient (RES) mice (One-way ANOVA with Bonferroni post hoc test). c, Representative flow cytometry plots showing gating strategy for fluorescence-activated cell sorting of Ly6Chigh monocytes, Ly6Clow monocytes, B cells and T cells. d, Principal component analysis (PCA) plot performed on the top 2000 most variable genes of sorted cells. e, Volcano plot showing the 25 most significantly differently expressed protein coding genes in Ly6Chigh monocytes of RES vs. CON mice. Venn diagrams displaying number of differentially expressed genes (adjusted p-value < 0.05 and log2 fold change > ∣1∣) in f, Ly6Clow monocytes, g, B cells and h, T cells. Volcano plots showing the 25 most significantly differentially expressed protein coding genes (if applicable) in Ly6Clow monocytes [i, SUS vs. CON, j, RES vs. CON], B cells [k, SUS vs. CON, l, RES vs. CON] and T cells [m, SUS vs. CON, n, RES vs. CON]. Top three gene ontology (GO) pathways (if applicable) in Ly6Chigh monocytes from o, significantly downregulated genes of SUS vs. CON mice, p, significantly upregulated genes in RES vs. CON and q, significantly downregulated genes in RES vs. CON mice. *** p < 0.001. Data are shown as means ± s.e.m.
Extended Data Fig. 4.
Extended Data Fig. 4.. Anatomical mapping of brain-infiltrating Ccr2rfp+ monocytes using iDISCO+.
a, Social interaction ratio and b, locomotion of unstressed control (CON), susceptible (SUS) and resilient (RES) mice (One-way ANOVA with Bonferroni post hoc test). Representative images from lightsheet imaging of c, auto-fluorescent signal (scale bar: 1000 μm) and d, monocyte signal (scale bar: 1000 μm). e, brain-infiltrating monocytes (red) in the nucleus accumbens showing accurate cell detection (yellow) by the automated software Clearmap (scale bar: 30 μm). ** p < 0.01, *** p < 0.001. Data are shown as means ± s.e.m.
Extended Data Fig. 5.
Extended Data Fig. 5.. Single-cell RNA-sequencing of brain-infiltrating Ccr2rfp+ monocytes.
a, Social interaction ratio and b, locomotion of unstressed control (CON), susceptible (SUS) and resilient (RES) mice (One-way ANOVA with Bonferroni post hoc test). c, Gating strategy for fluorescence-activated cell sorting of brain-infiltrating monocytes. Feature plots of the d, monocyte enriched gene Ccr2 and e, the microglia enriched gene P2ry12. *** p < 0.001. Data are shown as means ± s.e.m.
Extended Data Fig. 6.
Extended Data Fig. 6.. Single-cell RNA-sequencing of brain-resident myeloid cells in the nucleus accumbens (NAc).
a, Experimental outline. b, Social interaction ratio and c, locomotion of unstressed control (CON), susceptible (SUS) and resilient (RES) mice (One-way ANOVA with Bonferroni post hoc test). d, Gating strategy for fluorescence-activated cell sorting of brain-resident myeloid cells. e, Feature plots. f, Uniform Manifold Approximation and Projection (UMAP) representation of 6 clusters identified using Seurat clustering. g, Relative (%) abundance of number of cells per cluster in CON, SUS and RES mice. Cluster 5 was specific to SUS mice and cluster 4 was specific to RES mice, however, gene ontology analyses did not reveal any significantly enriched pathways. h, Heat map of top five cluster defining protein coding genes. i, heatmap of homeostatic and inflammatory genes. There were no significant differences (p-value adjusted < 0.05) in these homeostatic or inflammatory genes. *** p < 0.001. Data are shown as means ± s.e.m.
Extended Data Fig. 7.
Extended Data Fig. 7.. Stress increases matrix metalloproteinase 8 (MMP8) in both male and female mice.
a, Social interaction ratio and b, locomotion of unstressed control (CON), susceptible (SUS) and resilient (RES) male mice (One-way ANOVA with Bonferroni post hoc test). Defeat characteristics of female mice after 10 days of chronic social defeat stress (CSDS). (c, social interaction ratio, d, locomotion) (One-way ANOVA with Bonferroni post hoc test). e, Plasma levels of MMP8 in SUS compared to CON female mice after 10 days of CSDS. (One-way ANOVA with Bonferroni post hoc test). f, MMP8 plasma levels of female mice that underwent a 21-day paradigm of chronic variable stress (CVS) compared to non-stressed control mice (two-tailed Student’s t-test). Plasma levels of g, MMP2, h, MMP3, i, proMMP9 and j, MMP12 in CON, SUS and RES male mice after 10 days of CSDS. * p < 0.01, ** p < 0.01, *** p < 0.001. Data are shown as means ± s.e.m.
Extended Data Fig. 8.
Extended Data Fig. 8.. Defeat characteristics of mice assessed for brain matrix metalloproteinase 8 (MMP8) and alterations in brain extracellular space.
a, Social interaction ratio and b, locomotion of unstressed control (CON), susceptible (SUS) and resilient (RES) mice from which levels of MMP8 in the nucleus accumbens (NAc) were analysed (One-way ANOVA with Bonferroni post hoc test, each data point represents three pooled mouse brains). c, Social interaction ratio and d, locomotion of CON, SUS and RES mice analysed for the transmission electron microscopy experiment. (One-way ANOVA with Bonferroni post hoc test). ** p < 0.01, *** p < 0.001. Data are shown as means ± s.e.m.
Extended Data Fig. 9.
Extended Data Fig. 9.. Dose response study for intra-peritoneal (i.p.) injection of recombinant matrix metalloproteinase 8 (rMMP8).
Different doses of rMMP8 or vehicle (4-aminophenylmercuric acetate, APMA) were injected i.p. and blood was collected 20 min or 18 h after the injection followed by MMP8 measurement in plasma.
Extended Data Fig. 10.
Extended Data Fig. 10.. Bone marrow chimera experiment.
a, Chimerism (CD45.2+ vs. total CD45+ cells) of unstressed and stressed WT and Mmp8−/− transplants. Frequencies of circulating b, Ly6Chigh monocytes and c, neutrophils. Plasma levels of d, Interleukin 6 (IL6), e, IL10, f, IL12p40, g, C-C motif chemokine ligand 2 (CCL2), h, Vascular endothelial growth factor (VEGF) and i, Tumor necrosis factor (TNF). j, Sucrose preference test, k, splash test and l, elevated plus maze test. Sickness associated behaviours such as m, body weight, n, food consumption or o, locomotion. (Two-way ANOVA followed by Tukey’s post hoc testing [for all panels]). Data are shown as means ± s.e.m.
Extended Data Fig. 11.
Extended Data Fig. 11.. Ex vivo patch clamp electrophysiology in nucleus accumbens medium spiny neurons.
a, Resting membrane potential, b, rheobase and c, amplitude of spontaneous excitatory postsynaptic potentials (sEPSCs). (Two-way ANOVA followed by Tukey’s post hoc testing [for all panels]). Data are shown as means ± s.e.m.
Extended Data Fig. 12.
Extended Data Fig. 12.. Graphical abstract.
Stress-induced increase in peripheral MMP8 leads to social avoidance behavior associated with alterations in the extracellular space (ECM) and neurophysiological changes in the nucleus accumbens.
Fig. 1.
Fig. 1.. Stress increases monocyte numbers in circulation and in the brain, and induces a proinflammatory transcriptional signature in stress-susceptible (SUS) mice.
a, Experimental outline: After 10 days of chronic social defeat stress (CSDS), mice were tested in the social interaction (SI) test. Leukocyte subpopulation frequencies were determined in blood and brain of unstressed control (CON), SUS and resilient (RES) mice using mass cytometry (Cytometry by time-of-flight, CyTOF). t-distributed stochastic neighbor embedding (t-SNE) maps of CD45+ cells in b, blood and h, brain. The color of each cluster corresponds to the assigned cell type. c, Frequencies of Ly6Chigh monocytes, neutrophils and B cells in circulation in CON, SUS and RES mice. (One-way ANOVA with Bonferroni post hoc test, each data point represents one biological sample). Number of d, monocytes and f, neutrophils in circulation in patients with major depressive disorder (MDD) compared to healthy controls (HC) (two-tailed Student’s t-test). Correlation between perceived stress (assessed by the Perceived Stress Scale) and e, monocyte numbers and g, neutrophil numbers (Pearson correlation). i, Ly6Chigh monocytes in whole brain. (One-way ANOVA with Bonferroni post hoc test; each data point represents four pooled brains). j, Experimental outline of cell type-specific RNA-sequencing of Ly6Chigh, Ly6Clow monocytes, B cells and T cells from blood. k, Venn diagrams displaying the number of differentially expressed genes (adjusted p-value < 0.05 and log2 fold change > ∣1∣) in Ly6Chigh monocytes. l, Volcano plot showing the 25 most significantly differently expressed protein coding genes in Ly6Chigh monocytes from SUS vs. CON mice. m, Top three gene ontology (GO) terms from significantly upregulated genes in Ly6Chigh monocytes of SUS vs. CON mice. * p < 0.05, ** p < 0.01, *** p < 0.001. Data are shown as means ± s.e.m (panels c and i). Abbreviations: moDCs: Monocyte-derived dendritic cells; NK cells: Natural killer cells; BAM: Border-associated macrophages.
Fig. 2.
Fig. 2.. Increased expression of matrix metalloproteinase 8 (Mmp8) in brain-infiltrating Ly6Chigh monocytes of susceptible (SUS) mice.
a, Outline of iDISCO+ brain clearing and light sheet imaging, and single-cell RNA-sequencing experiments. b, Representative images of a mouse brain before (upper image) and after (lower image) iDISCO+ clearing. c, Number of Ccr2rfp+ monocytes in whole brain of control (CON), SUS and resilient (RES) mice (One-way ANOVA with Bonferroni post hoc test). d, Top ten most significant correlations between brain-infiltrating monocytes and social interaction ratio (lower correlation coefficients (red) indicate that higher numbers of infiltrating monocytes are associated with greater social avoidance) (Pearson correlation). e, Reconstruction of immunofluorescence images in the nucleus accumbens (NAc), blood vessels (red), Ccr2rfp+ monocytes (green, white arrows). Scale bar: 10 μm. f, Uniform Manifold Approximation and Projection (UMAP) representation of 4 clusters identified using Seurat clustering. g, Relative (%) abundance of number of cells per cluster in CON, SUS and RES mice. h, Heat map of top ten cluster-defining protein coding genes. i, Gene ontology (GO) terms of significantly (adjusted p-value < 0.05) upregulated genes of Cluster 0. j, Genes of GO terms “extracellular space” and “extracellular matrix” compared between SUS vs. CON, RES vs. CON and SUS vs. RES mice. Feature plots of normalized gene expression of Mmp8 in k, brain-infiltrating Ccr2rfp+ monocytes and l, brain-resident immune cells in the NAc. ** p < 0.01. Data are shown as means ± s.e.m.
Fig. 3.
Fig. 3.. Stress-induced increase in matrix metalloproteinase 8 (MMP8) is associated with altered extracellular space in the nucleus accumbens (NAc).
a, Plasma levels of MMP8 in unstressed control (CON), susceptible (SUS) and resilient (RES) mice (One-way ANOVA with Bonferroni post hoc test). b, Correlation of MMP8 in circulation with social interaction ratio (Pearson correlation). c, Serum MMP8 levels in patients with major depressive disorder (MDD) and healthy controls (HC) (two-tailed Student’s t-test). d, Correlation between MMP8 and Perceived Stress Scale (Pearson correlation). e, Normalized MMP8 protein levels in NAc lysates of CON, SUS and RES mice. (One-way ANOVA with Bonferroni post hoc test, each datapoint represents three pooled NAc). f, Experimental outline of recombinant (r)MMP8 biotinylation. g, Representative immunofluorescence image of the NAc of SUS mice that were injected retro-orbitally with biotinylated (r)MMP8. Scale bar: 10 μm. h, Outline of transmission electron microscopy experiment to assess the extracellular space in NAc. i, representative TEM images of CON, SUS and RES mice. Scale bar: 1 μm. j, Quantification of the extracellular space relative to total brain area (One-way ANOVA with Bonferroni post hoc test). k, Correlation between plasma MMP8 levels and extracellular space volume fraction (Pearson correlation). * p < 0.05, ** p < 0.01, *** p < 0.001. Data are shown as means ± s.e.m.
Fig. 4.
Fig. 4.. Peripheral matrix metalloproteinase 8 (MMP8) is causally linked to stress-induced social avoidance behaviour, alterations in brain extracellular space and neurophysiology.
a, Experimental outline of mice receiving either 100 μg/kg recombinant (r)MMP8 or vehicle (VEH) followed by a subthreshold stress. b, Social interaction (SI) ratio of mice injected with rMMP8 followed by a subthreshold defeat. c, Outline of social conditioned place preference (CPP) experiment. d, VEH injected mice show CPP towards a chamber that was paired with a juvenile mouse, e, while this was abolished in mice injected with rMMP8 during a subthreshold defeat. f, Outline of bone marrow chimera experiment, with bone marrow transplantation (BMT) on day 0, followed by 6 weeks of recovery and then chronic social defeat stress (CSDS). After CSDS, mice were tested in a comprehensive behaviour battery, consisting of a SI test with a novel CD-1 mouse, a juvenile interaction (JI) test with a novel same-sex juvenile mouse, sucrose preference test, elevated plus maze (EPM) and splash test. On the day of sacrifice, chimerism was validated and brains of a subset of stressed mice were processed for transmission electron microscopy (TEM) imaging of the extracellular space. g, Plasma levels of MMP8. h, SI ratio and i, time spent in the corner as a measure of social avoidance. j, Representative heat maps of behaviour during social interaction test. k, Time spent in the interaction zone during a JI test when the novel juvenile mouse was present. l, Quantification of the extracellular space relative to total brain area in WT compared to Mmp8−/− chimeras. m, Outline of ex vivo patch clamp experiment in nucleus accumbens (NAc) medium spiny neurons. n, Action potentials in Mmp8−/− and WT mice after 10 days of CSDS. o, Representative traces of action potentials evoked upon a +120 pA step of depolarizing current. p, Frequencies of spontaneous excitatory postsynaptic currents (sEPSCs) in Mmp8−/− and WT mice after 10 days of CSDS. q, Representative traces of sEPSCs. (Two-way ANOVAs followed by Tukey’s post hoc testing (for panels b, d, g, h, i, k, n, p) or two-sided Student’s t-test (for panel l). * p < 0.05, ** p < 0.01, *** p < 0.001. Data are shown as means ± s.e.m.

References

    1. Otte C. et al. Major depressive disorder. Nature Reviews Disease Primers 2, 16065, doi:10.1038/nrdp.2016.65 (2016). - DOI - PubMed
    1. Cathomas F. et al. Beyond the neuron: Role of non-neuronal cells in stress disorders. Neuron 110, 1116–1138, doi:10.1016/j.neuron.2022.01.033 (2022). - DOI - PMC - PubMed
    1. Miller A. H. & Raison C. L. The role of inflammation in depression: from evolutionary imperative to modern treatment target. Nat Rev Immunol 16, 22–34, doi:10.1038/nri.2015.5 (2016). - DOI - PMC - PubMed
    1. Dowlati Y. et al. A meta-analysis of cytokines in major depression. Biol Psychiatry 67, 446–457, doi:10.1016/j.biopsych.2009.09.033 (2010). - DOI - PubMed
    1. Raison C. L., Capuron L. & Miller A. H. Cytokines sing the blues: inflammation and the pathogenesis of depression. Trends Immunol 27, 24–31, doi:10.1016/j.it.2005.11.006 (2006). - DOI - PMC - PubMed

Publication types