. 2023;12(1):16.
doi: 10.1007/s13721-023-00410-9. Epub 2023 Feb 6.

Development of artificial neural network models to predict the PAMPA effective permeability of new, orally administered drugs active against the coronavirus SARS-CoV-2

Affiliations

Development of artificial neural network models to predict the PAMPA effective permeability of new, orally administered drugs active against the coronavirus SARS-CoV-2

Chrysoula Gousiadou et al. Netw Model Anal Health Inform Bioinform. 2023.

Abstract

Responding to the pandemic caused by SARS-CoV-2, the scientific community intensified efforts to provide drugs effective against the virus. To strengthen these efforts, the "COVID Moonshot" project has been accepting public suggestions for computationally triaged, synthesized, and tested molecules. The project aimed to identify molecules of low molecular weight with activity against the virus, for oral treatment. The ability of a drug to cross the intestinal cell membranes and enter circulation decisively influences its bioavailability, and hence the need to optimize permeability in the early stages of drug discovery. In our present work, as a contribution to the ongoing scientific efforts, we employed artificial neural network algorithms to develop QSAR tools for modelling the PAMPA effective permeability (passive diffusion) of orally administered drugs. We identified a set of 61 features most relevant in explaining drug cell permeability and used them to develop a stacked regression ensemble model, subsequently used to predict the permeability of molecules included in datasets made available through the COVID Moonshot project. Our model was shown to be robust and may provide a promising framework for predicting the potential permeability of molecules not yet synthesized, thus guiding the process of drug design.

Supplementary information: The online version contains supplementary material available at 10.1007/s13721-023-00410-9.

Keywords: Artificial neural network; COVID-19; Descriptors; Ensemble modelling; PAMPA; Permeability.


Conflict of interest statement

Conflict of interestThe authors have no competing interests to declare that are relevant to the content of this article.

Figures

Fig. 1
Fig. 1
Partition of the data: distribution of the output variable (logPe) in the whole dataset as well as in the train, test and external validation subsets
Fig. 2
Fig. 2
Diagram depicting the various steps included in the present computational analysis, i.e. data separation, pre-processing and feature selection, development and validation of the models
Fig. 3
Fig. 3
Selection of descriptors. Feature selection with random forest (recursive feature elimination) for the effective permeability (logPe) modelling, using the 141 molecules included in the train set. The best performance based on the root mean-square error (RMSEcv) (Kaur et al. 2020) corresponded to a subset of 61 descriptor variables selected as most significant in predicting the logPe values
Fig. 4
Fig. 4
Architecture and complexity of the EnsembleNN. As input variables for the ensemble, NN1 and NN2 are used, i.e. the logPe values predicted by the neural network base models NN1 and NN2, respectively, for the molecules in the training dataset. The observed logPe values of the molecules is the output of the model. The ensemble further consists of two hidden layers and three hidden neurons. The weights are depicted by black (weights with positive sign) and grey (weights with negative sign) lines. The result matrix is presented in Table 3
Fig. 5
Fig. 5
Correlation chart of the top 6 out of 61 most important descriptors, along with the modelled end point Observed Log Pe, for the modelling of membrane permeability (by passive diffusion) of 190 molecules. The distributions of the variables, their correlation to each other and to the output as well as their individual contribution in explaining the variability of the output Observed Log Pe is depicted. The Pearson correlation coefficient is reported for each pairwise comparison, with the number of stars assigned increasing with the magnitude of the correlation
Fig. 6
Fig. 6
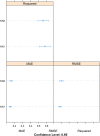
Visual comparison of the modelling results: evaluation metrics (‡R2CV, RMSECV and MAEcv) for the prediction performance of the models NN1 and NN2 obtained via cross-validation on the training set (141 molecules) with optimized parameters (Table 2A). The arithmetic mean (circles) and confidence intervals (95%) are plotted for each distribution. Here, “R-squared” refers to ‡R2CV, calculated according to Eq. (2) as described in the “Model Performance Statistics” section. The mean absolute error (MAE) (Willmott and Matsuura 2005) evaluation metric, also presented here, is less sensitive to outliers than RMSECV
Fig. 7
Fig. 7
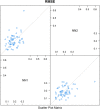
Pairwise comparison of the cross-validation results for the models NN1 and NN2 (Table 4). The scatterplot matrix shows whether the predictions from the models are correlated. The plotted results, for which correlations are examined, are based on the root mean-squared error (RMSECV). If any two models are 100% correlated, they are perfectly aligned around the diagonal. Between NN1 and NN2, the correlation is very low (0.40), meaning that there is limited redundancy in the information given by these models. This proved valuable for the creation of the ensemble model EnsembleNN (Table 2B)
Fig. 8
Fig. 8
Gain curve plots of the log Pe values predicted by the base models NN1 and NN2 and the ensemble model EnsembleNN against the experimental logPe values. The gain curves show whether the models’ predictions are sorted in the same order as the actual log Pe values. As sorting is the process of placing elements from a collection in some kind of order, the gain curve plot depicts how well the models sort their predictions compared to the true outcome values. For the evaluation of a model’s performance, the relative Gini score metric is used as follows: relative Gini score equals 1 when a model sorts exactly in the same order as the actual outcome, whereas the score is close to zero, or even negative when a model sorts poorly compared to the actual values. The metric therefore can be considered as a measure of how far from “perfect” a model is. The models NN1, NN2 and EnsembleNN show relative Gini scores 0.72, 0.69 and 1, respectively (Mount and Zumel 2020)
Fig. 9
Fig. 9
Combined plot depicting the standard deviation (sd) values calculated according to Eq. (4) for the train, test and external validation data versus the root square error (rse_ens) between the respective observed logPe values and the predictions made by the EnsembleNN model for each one of the molecules. The applicability domain (AD) threshold for the EnsembleNN is ~ 3*maxSDTrain (~ 0.69) (Mount and Zumel 2020). For new samples with sd values larger than the threshold, the logPe predictions are likely to be inaccurate. Indeed, it is clearly shown that for the molecule with sd > 1 that the difference between the observed and predicted logPe values is considerable (rse_ens > 1.5), and had it been a new sample the prediction would rightly not have been considered valid.
Fig. 10
Fig. 10
Plot depicting the Pearson correlation (%) of the experimentally observed logPe values of the molecules in the external validation set versus the values predicted by the base models NN1 (86%) and NN2 (86%) and the stacked regression model EnsembleNN (89%) (Table 2D)
Fig. 11
Fig. 11
Single decision tree created on the whole dataset (190 molecules) using the 61 descriptors selected by recursive feature elimination (RFE) with random forest. The descriptors’ values are scaled and centred. The decision path clarifies which features are associated with every decision as well as the threshold values of the top descriptors that are responsible for a molecule having high/low effective permeability (logPe) at pH 7.4. The results are presented in mean values of logPe, along with the number and percentage of molecules corresponding to these values. The logPe values of the 190 molecules are depicted progressively from white (low permeability) to deep blue (high permeability). According to the rough classification scheme introduced in the section “Permeability Measurements and Experimental Setup” where the cut-off logPe value is − 6.2 (Chi et al. 2019), the tree classifies 94 molecules as having “higher permeability” (logPe ≥ -− 6.2) and 96 as having “lower permeability” (logPe < -− 6.2), whilst 92 and 98 molecules are experimentally shown to have high/low permeability, respectively, according to the PAMPA assay results
Fig. 12
Fig. 12
The negative relationship between BCUTc1h and LogPe (permeability) as well as between BCUTc1 and XLogP (lipophilicity) is presented. In each scatterplot, the dots are sized according to a third variable, i.e. the structural descriptor BCUTw1h. It can be observed that more than one structural combinations could lead to the same LogPe and XlogP values
Fig. 13
Fig. 13
Illustration of the relationship between the descriptor FNSA.3 and the observed LogPe. Each dot on both sides of the line represents an observation, i.e. a molecule with an observed logPe and a calculated FNSA.3 value. The overall pattern of the graph suggests that higher FNSA.3 values are generally associated with increased permeability (approximately logPe ≥ -− 6.2). In each scatterplot, the dots are sized according to a third variable, i.e. the descriptors nHBDon, XlogP and TopoPSA (topological polar surface area), respectively, to explore their influence on the observed permeability. It can be clearly seen that an increase of FNSA.3 combined with low nHBDon and TopoPSA values and high XlogP (> 0, < 6) result in increased permeability

Similar articles

Cited by

References

    1. https://github.com/postera-ai/COVID_moonshot_submissions
    1. Alex A, Millan DS, Perez M, et al. Intramolecular hydrogen bonding to improve membrane permeability and absorption in beyond rule of five chemical space. Med Chem Commun. 2011;2:669–674. doi: 10.1039/C1MD00093D. - DOI
    1. Alexander DLJ, Tropsha A, Winkler DA. Beware of R2: simple, unambiguous assessment of the prediction accuracy of QSAR and QSPR models. J Chem Inf Model. 2015;55:1316–1322. doi: 10.1021/acs.jcim.5b00206. - DOI - PMC - PubMed
    1. Alloqmani, A., B., Y., Irshad, A., Alsolami, F. Deep learning based anomaly detection in images: Insights, challenges and recommendations. International Journal of Advanced Computer Science and Applications 2021, 12. 10.14569/IJACSA.2021.0120428
    1. Ambroise C, McLachlan GJ. Selection Bias in Gene Extraction on the Basis of Microarray Gene-Expression Data. Proc Natl Acad Sci USA. 2002;99:6562–6566. doi: 10.1073/pnas.102102699. - DOI - PMC - PubMed

LinkOut - more resources